Written By: Austin Kane & Sergio Harding
Habitat is a bird’s lifeblood, supporting it through all stages of its life cycle, be it breeding, wintering or migration. Virginia has a rich diversity of habitats thanks to its climate, geology, and topography.
There are many habitat classifications, each categorizing habitats in different ways. The National Land Cover Database (NLCD) is one such system. The NLCD was the source of land cover data used in models to create the breeding distribution and abundance maps presented in the Species Accounts (see Analytical Methods). We present habitat categories based on NLCD classifications. The distribution of each habitat category is shown in Figure 1, and the proportion of each habitat category covering the state of Virginia is shown in Figure 2.
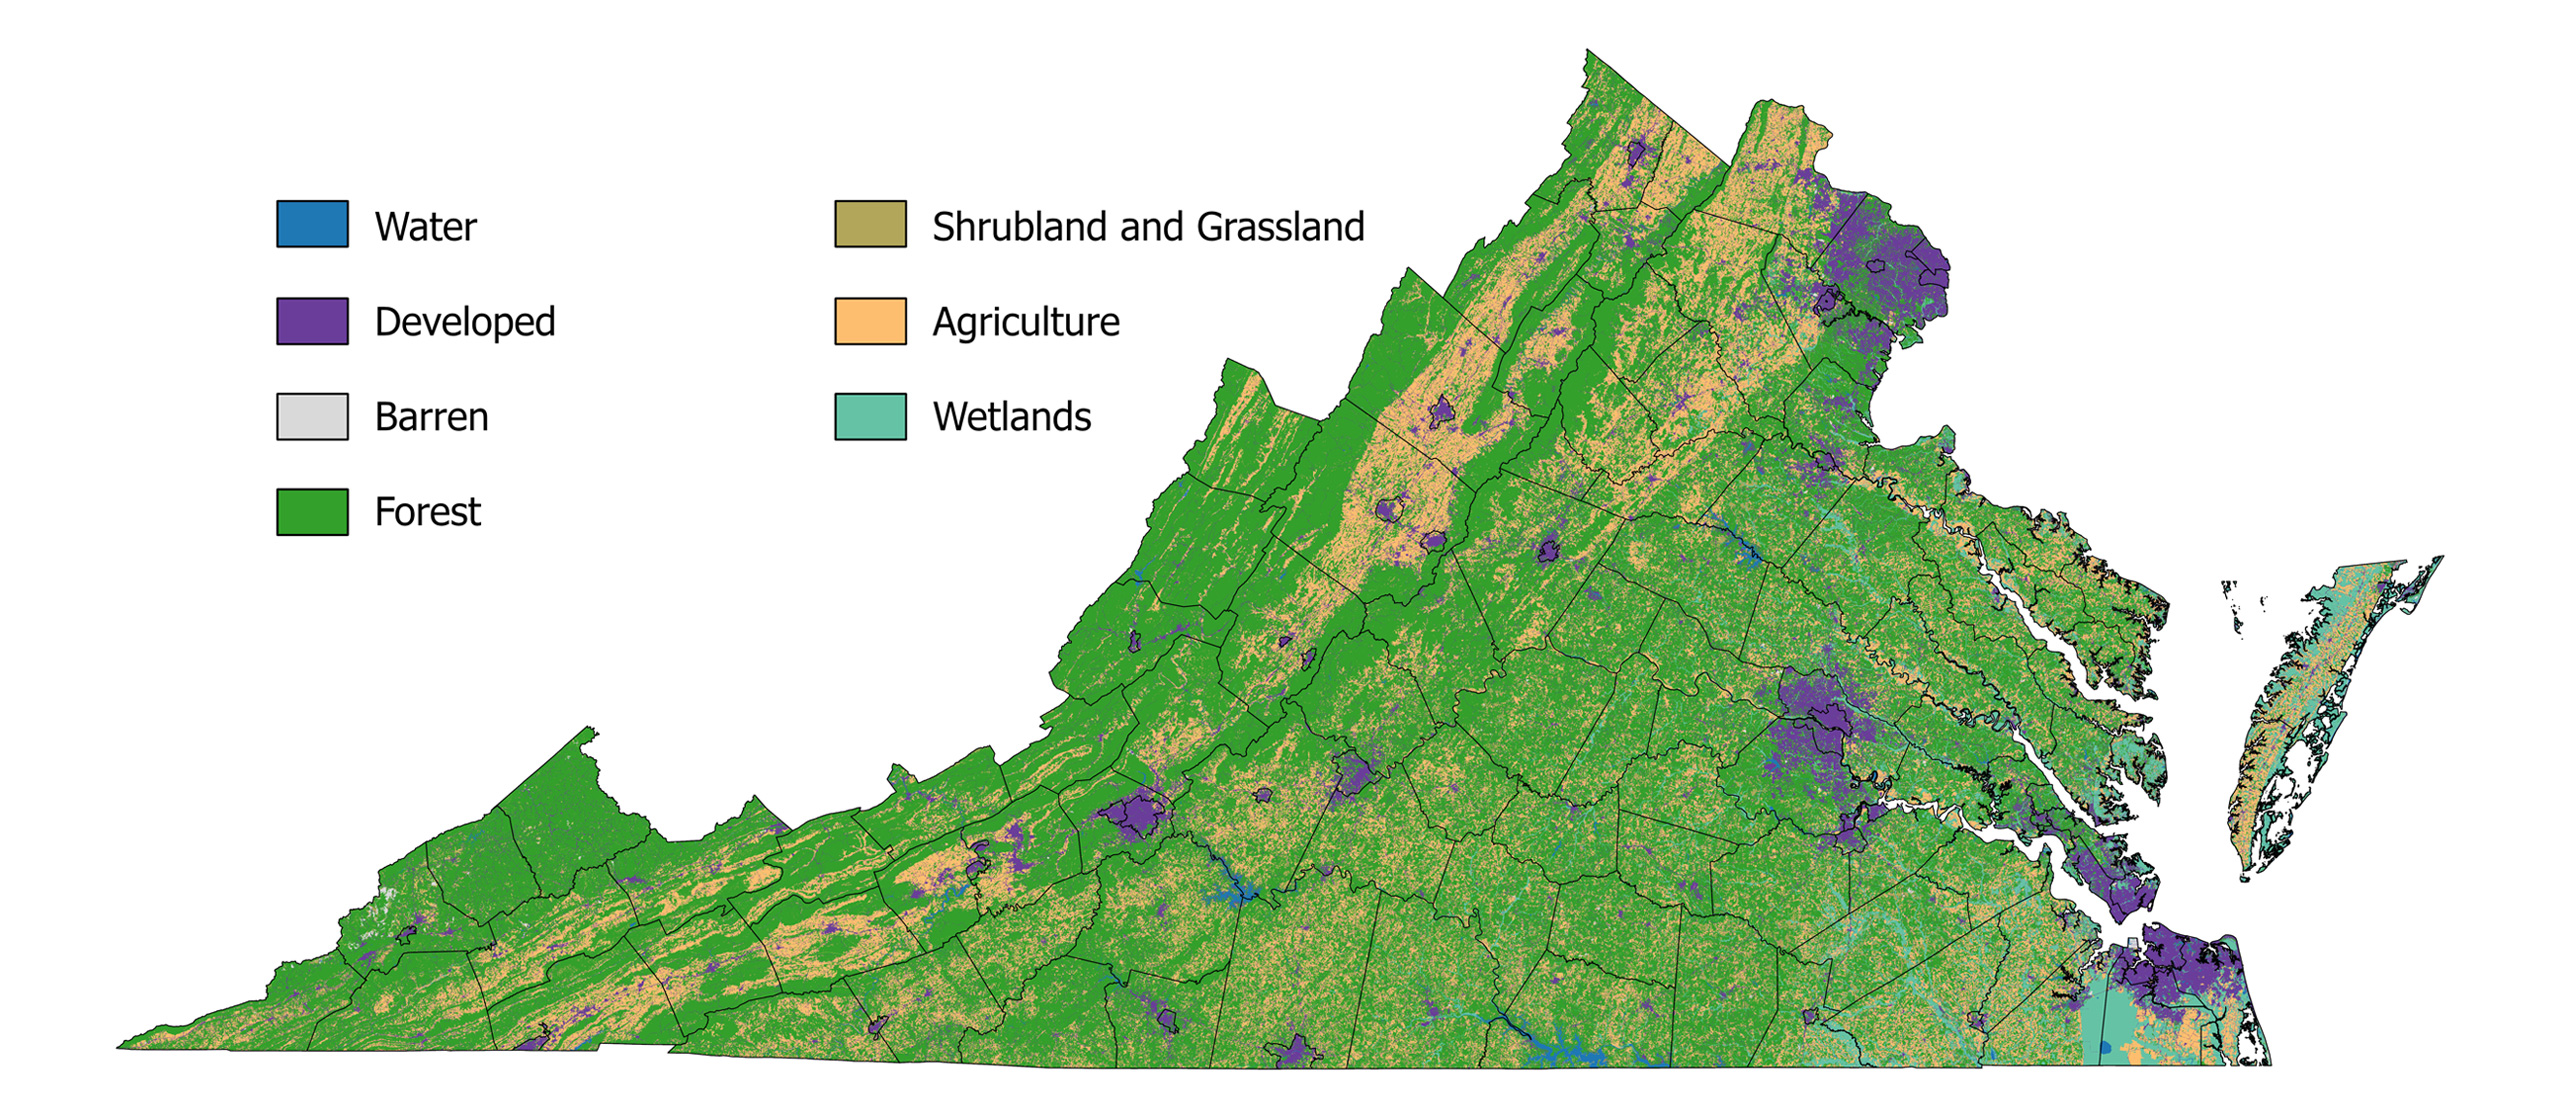
Figure 1. Distribution of habitat categories in Virginia based on data from the National Land Cover Database (USGS 2024).
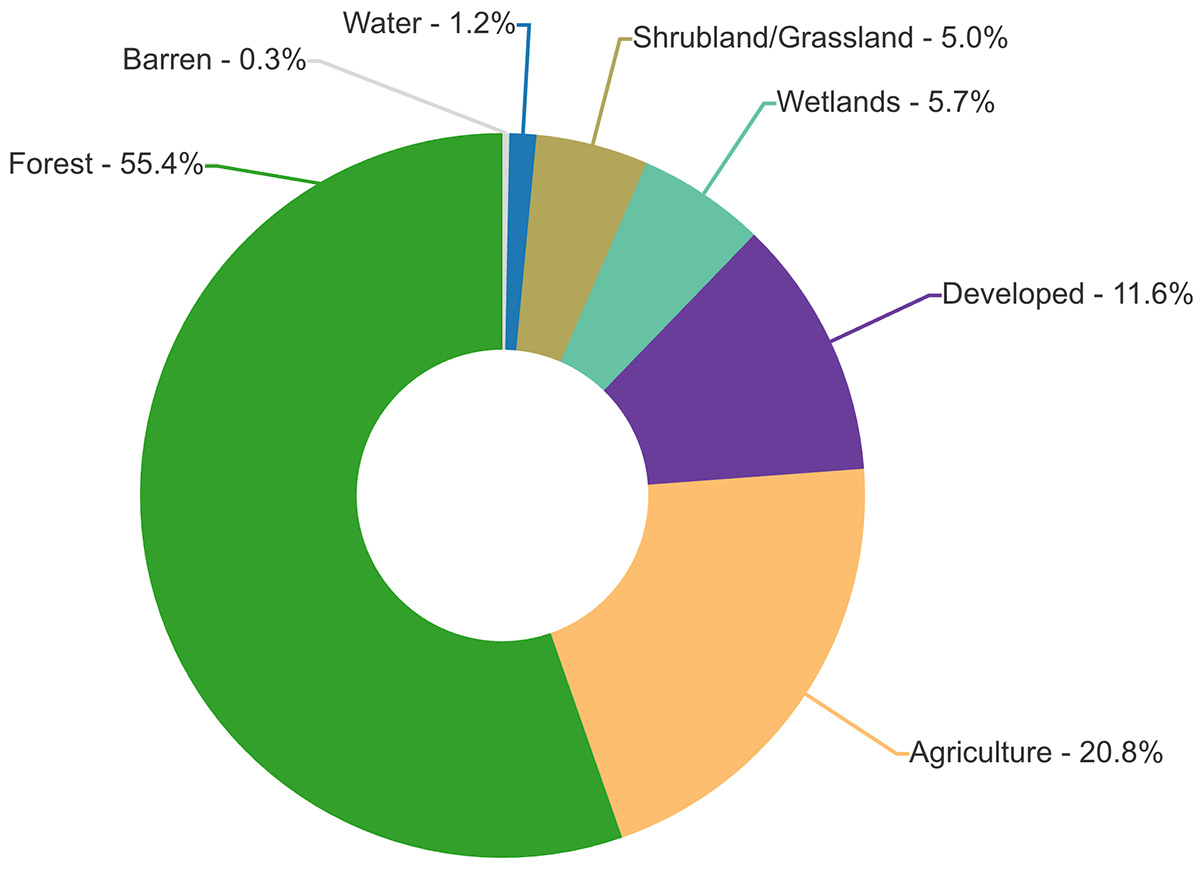
Figure 2. Proportion of the state of Virginia by habitat category based on the National Land Cover Database (USGS 2024). Water represents areas of open water.
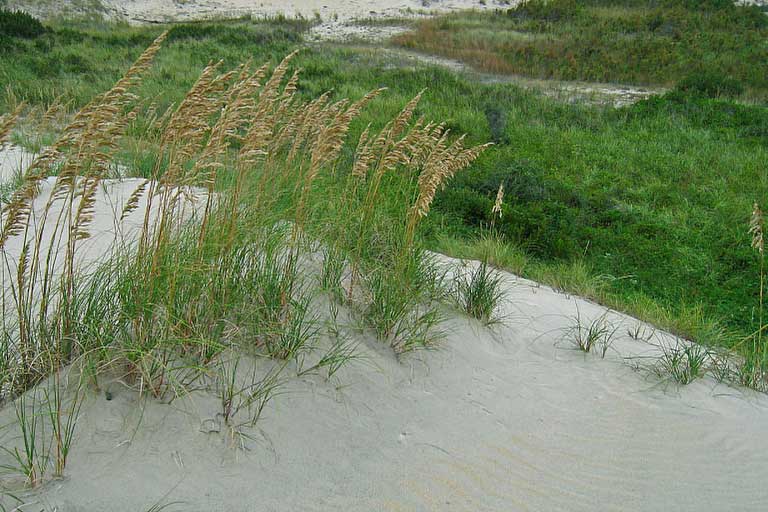
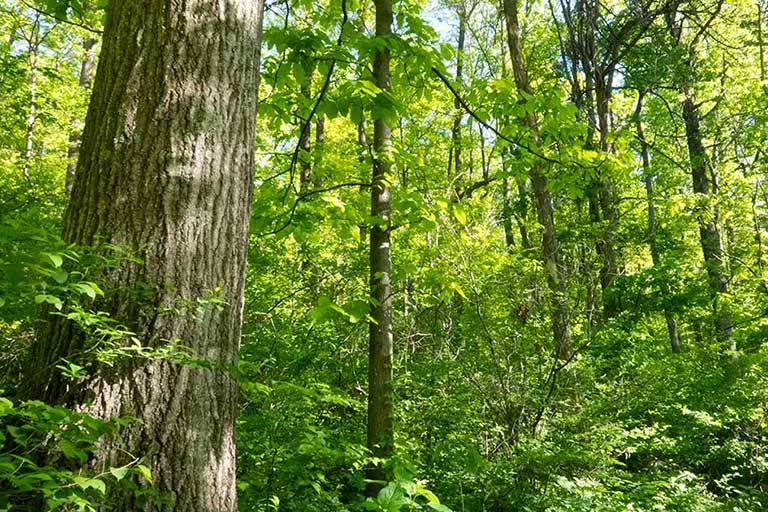
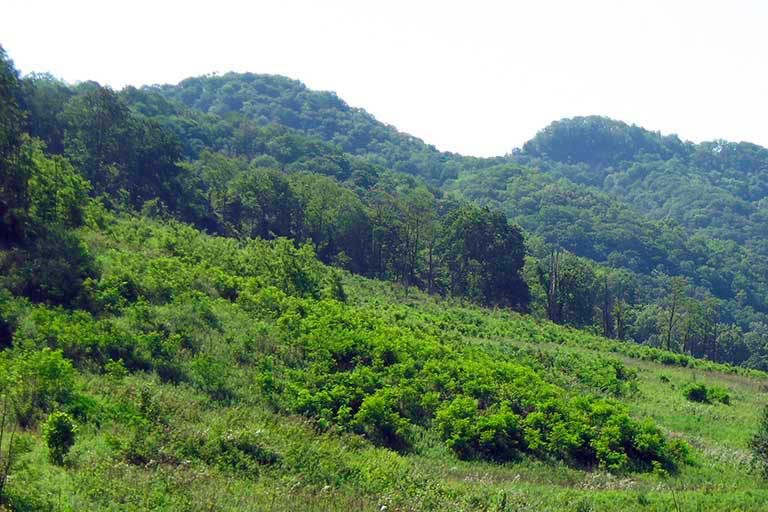
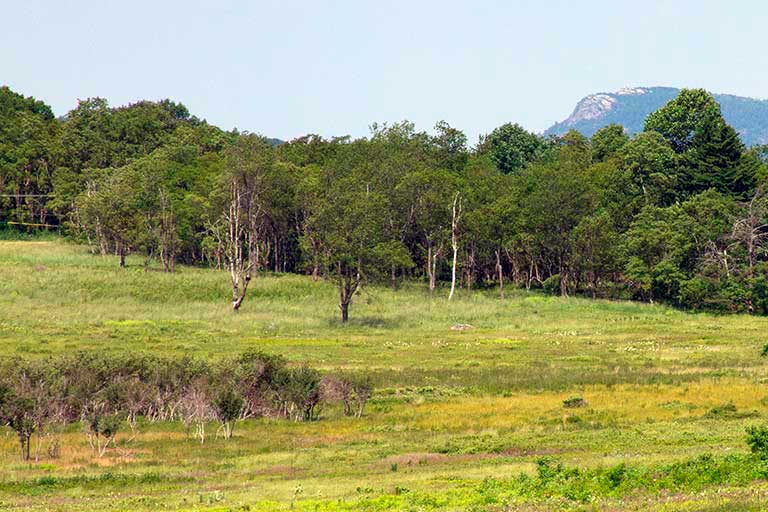
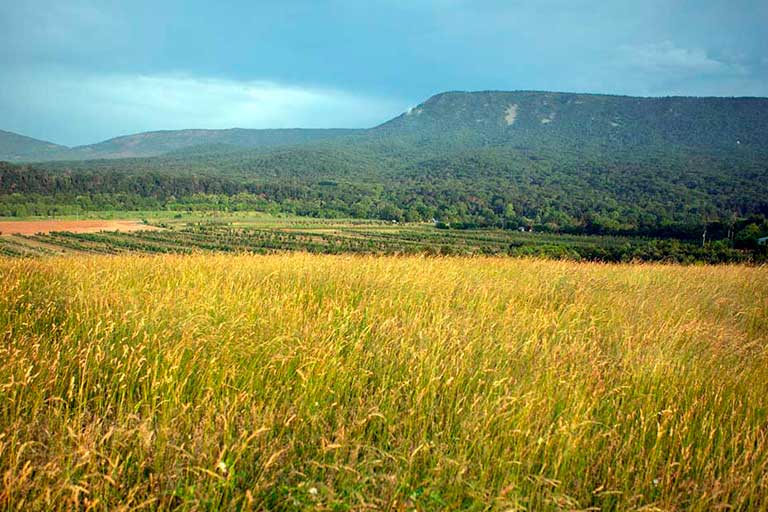
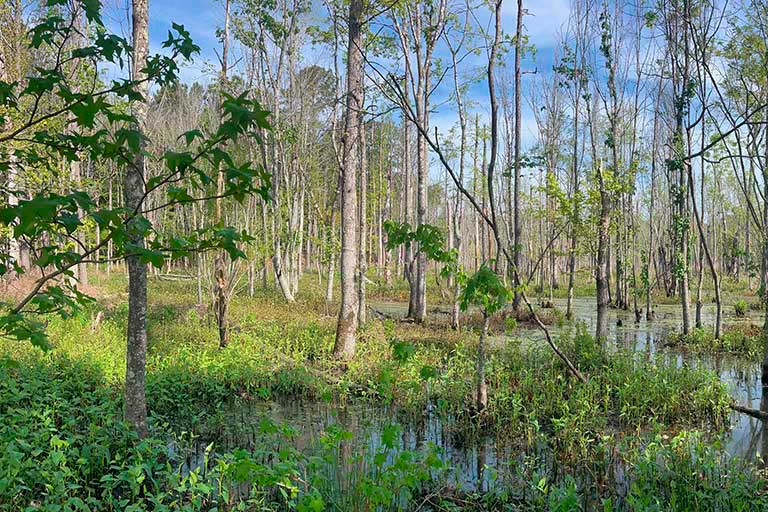
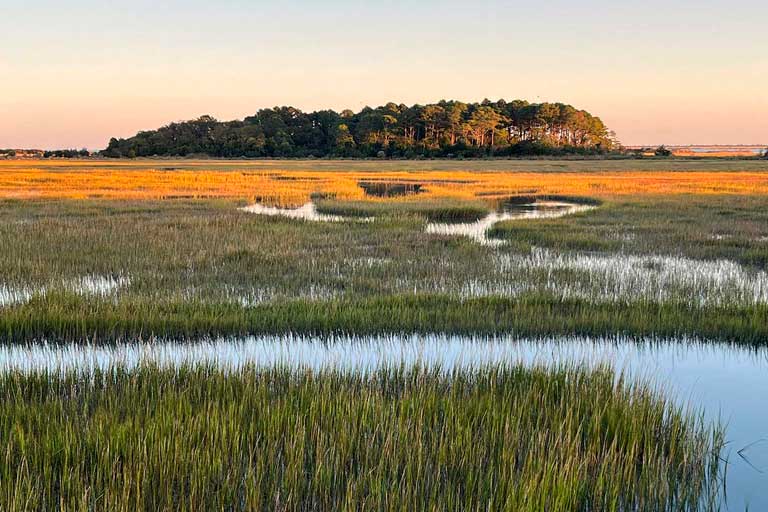
NLCD data allows comparison of change in habitats over time. Here we compare these data for the years in which bird data collection ended for each Atlas (1989 and 2020). Forest cover showed the greatest decrease between the two Atlas periods, declining by 1.1 million acres (461,000 hectares), a 7.5% loss. In contrast, the area of developed lands increased by 27% or approximately 630,000 acres (256,000 hectares). Much of this increase was around the larger urban areas in the state, such as Northern Virginia, Richmond, and the Hampton Roads-Virginia Beach area. Barren lands also expanded their footprint in the Commonwealth; between Atlases they increased by 60%, equivalent to 30,000 acres (12,000 hectares). In addition to beaches, they include quarries and strip mines. Shrubland and grassland habitat nearly doubled between Atlases, an increase of approximately 640,000 acres (259,000 hectares). Based on NLCD data, the major driver of this increase was conversion of forest to shrubland and grassland, likely through vegetation growth following forest clearing. Agricultural lands, including row crops, pasture and hayfields, declined by 3% between Atlases, equivalent to almost 140,000 acres (57,000 hectares). While woody wetlands decreased by 1.1% (14,000 acres [5,600 hectares), herbaceous wetlands (mostly marshes) saw a modest increase of 0.4% (820 acres [330 hectares).
The links below present a brief overview of each habitat category. For more detailed information on habitats, please visit the Virginia Department of Conservation and Recreation’s (VDCR) The Natural Communities of Virginia, VDCR’s Overview of the Physiography and Vegetation of Virginia, and the Virginia Department of Wildlife Resource’s 2025 Wildlife Action Plan.
Habitats
Literature Cited
U.S. Geological Survey (USGS) (2024). Annual NLCD collection 1 science products (ver. 1.1, June 2025): U.S. Geological Survey data release. Reston, VA, USA. https://doi.org/10.5066/P94UXNTS.