Introduction
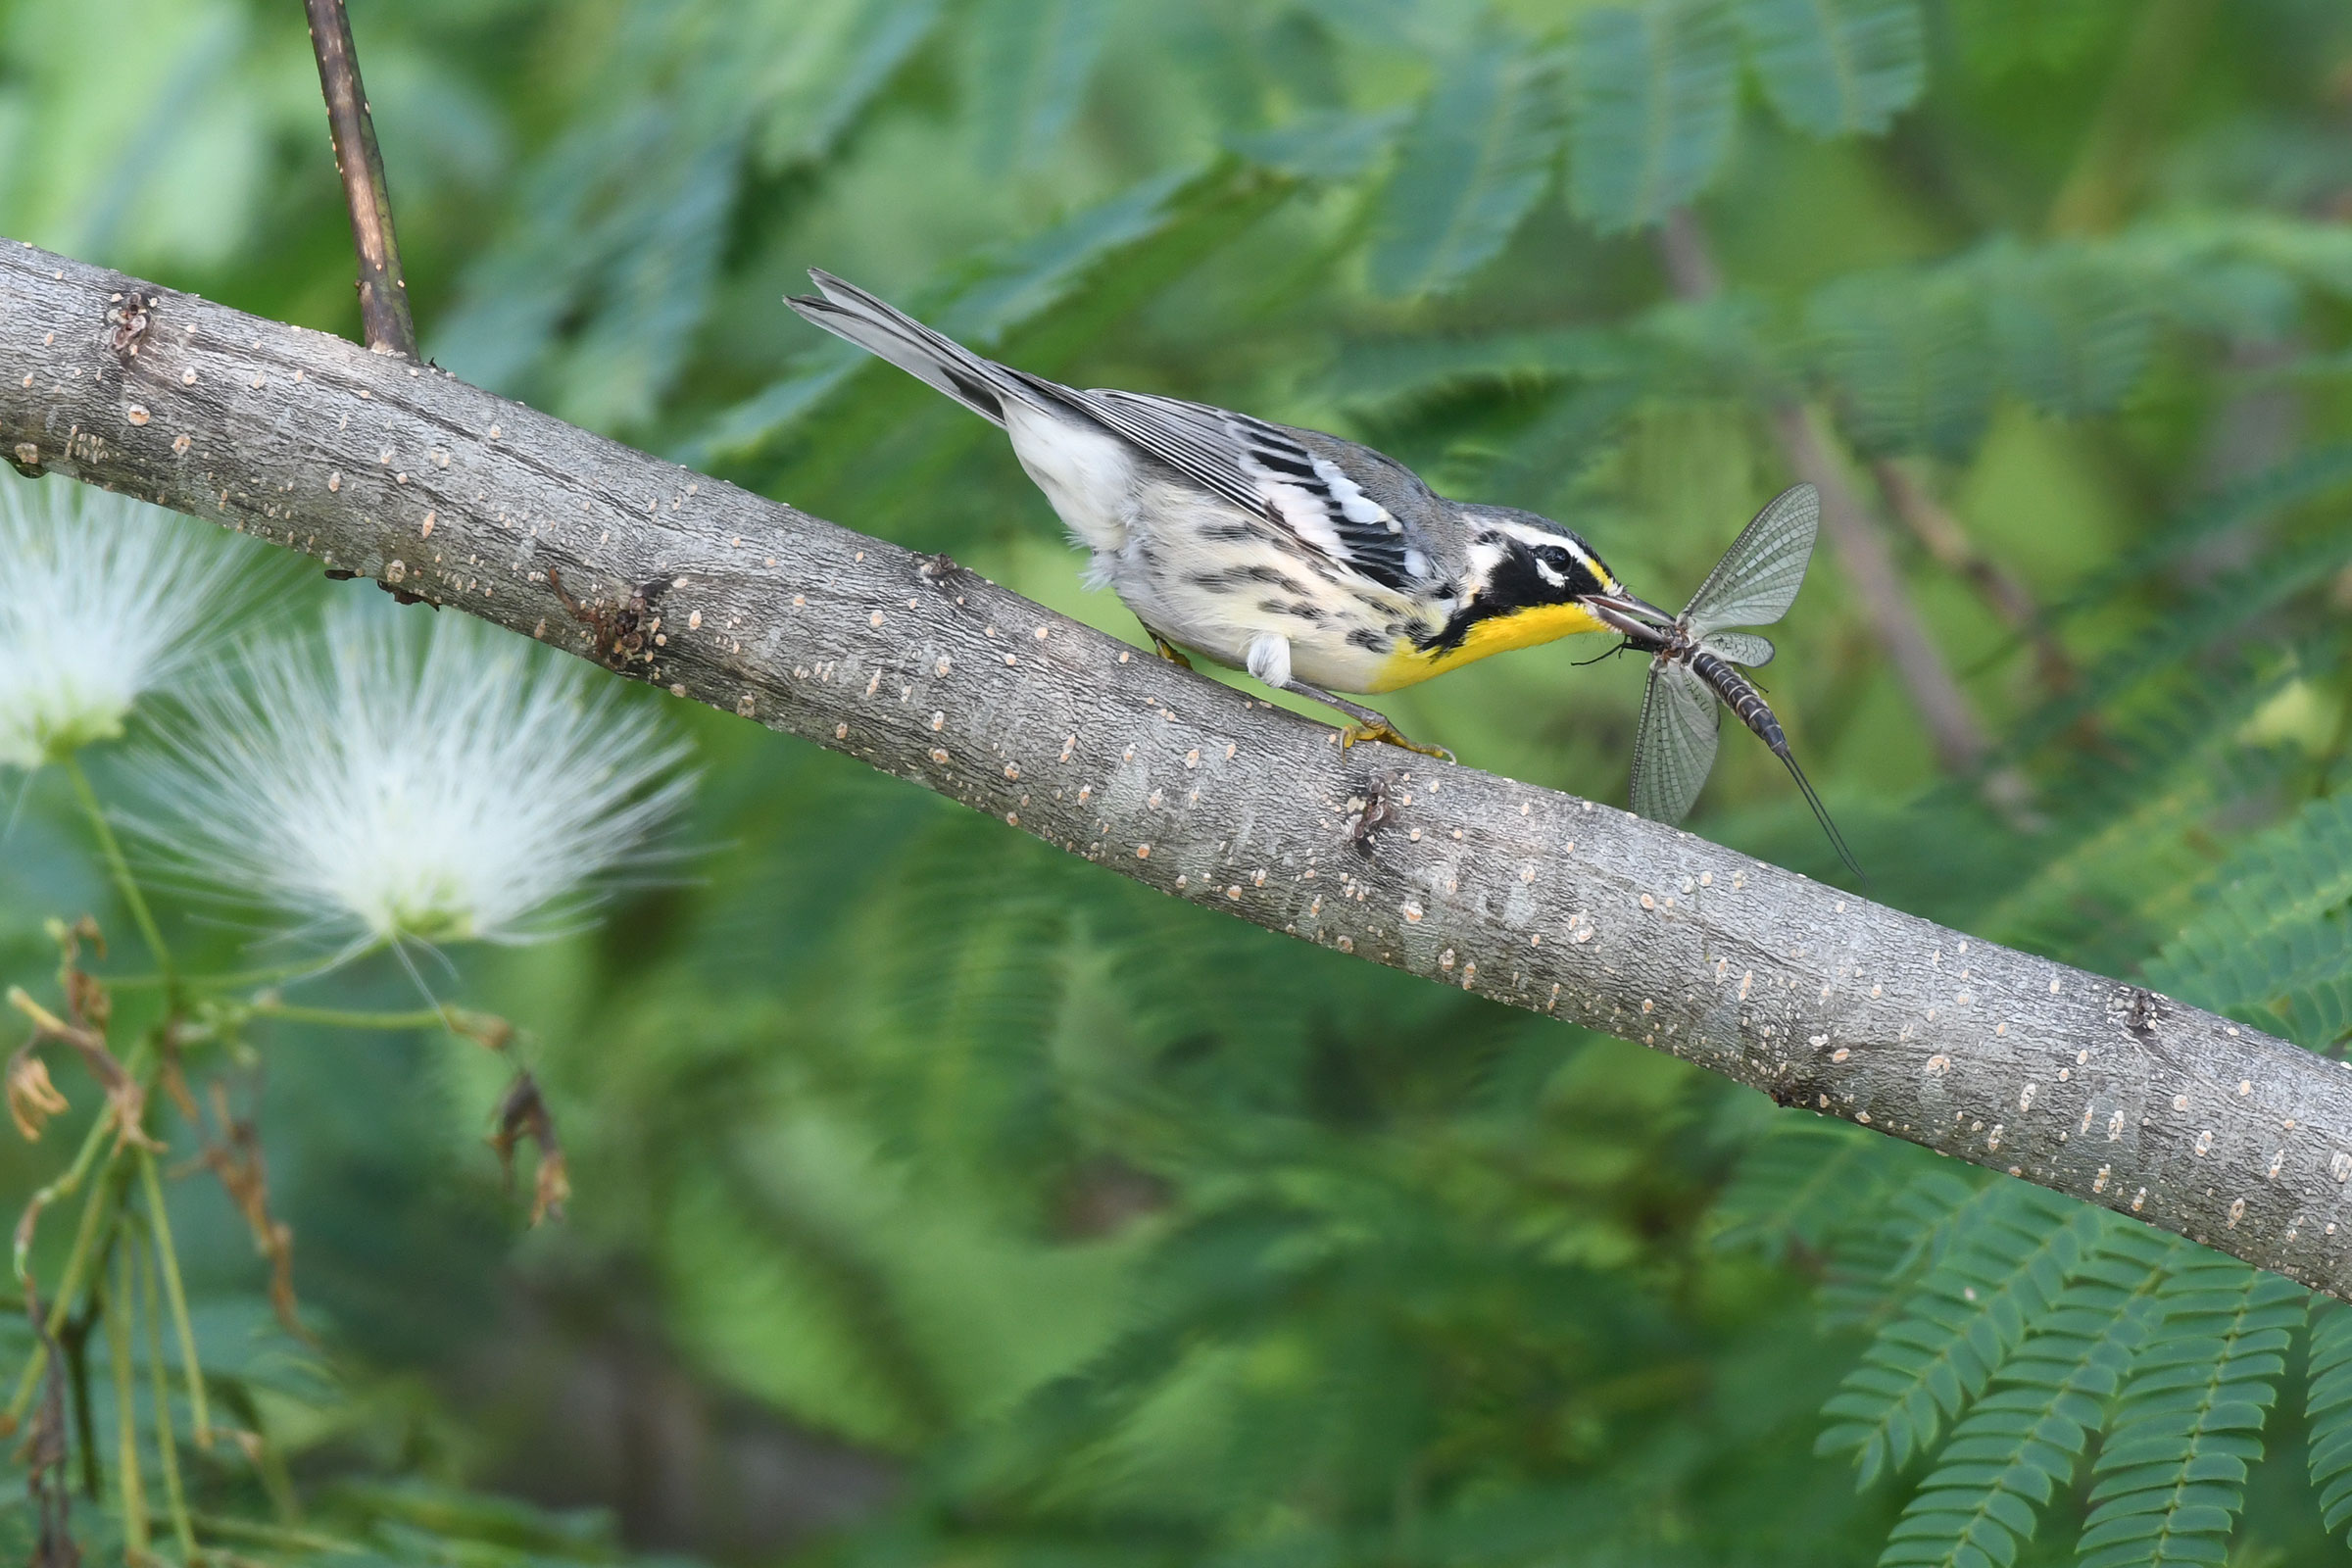
The Yellow-throated Warbler is aptly named, its lemon-yellow throat handsomely framed by the black triangles of its mask and pale chest. It is a creature of the canopy and midstory, where it forages by hopping from branch to branch in search of insects. Males singing their slurring, descending songs from sunrise to sunset. It prefers forests with conifers and has a more southern breeding distribution than most warblers. In fact, it is one of only a few warblers that can found in the United States year-round (McKay and Hall 2020).
Breeding Distribution
Yellow-throated Warblers are found throughout the state but are most likely to occur in the central and southern Piedmont region and the Coastal Plain region (Figure 1). They are less likely to occur in the Mountains and Valley region, except in the southwestern corner where lower elevation pine forests are available. The likelihood this species occurs in a block increases as the number of forest patches and habitat types increase, and its probable occurrence decreases in blocks with more agricultural and developed lands, such as around Richmond and Virginia Beach.
Between the First and Second Atlases (Figures 1 and 2), the change in the Yellow-throated Warbler’s likelihood of occurrence was minimal across much of the state (Figure 3). A few notable exceptions include decreases in probable occurrence in urban areas, including Hampton Roads, Northern Virginia, and Richmond, and an increase in the Cumberland Mountains in the Mountains and Valleys region.
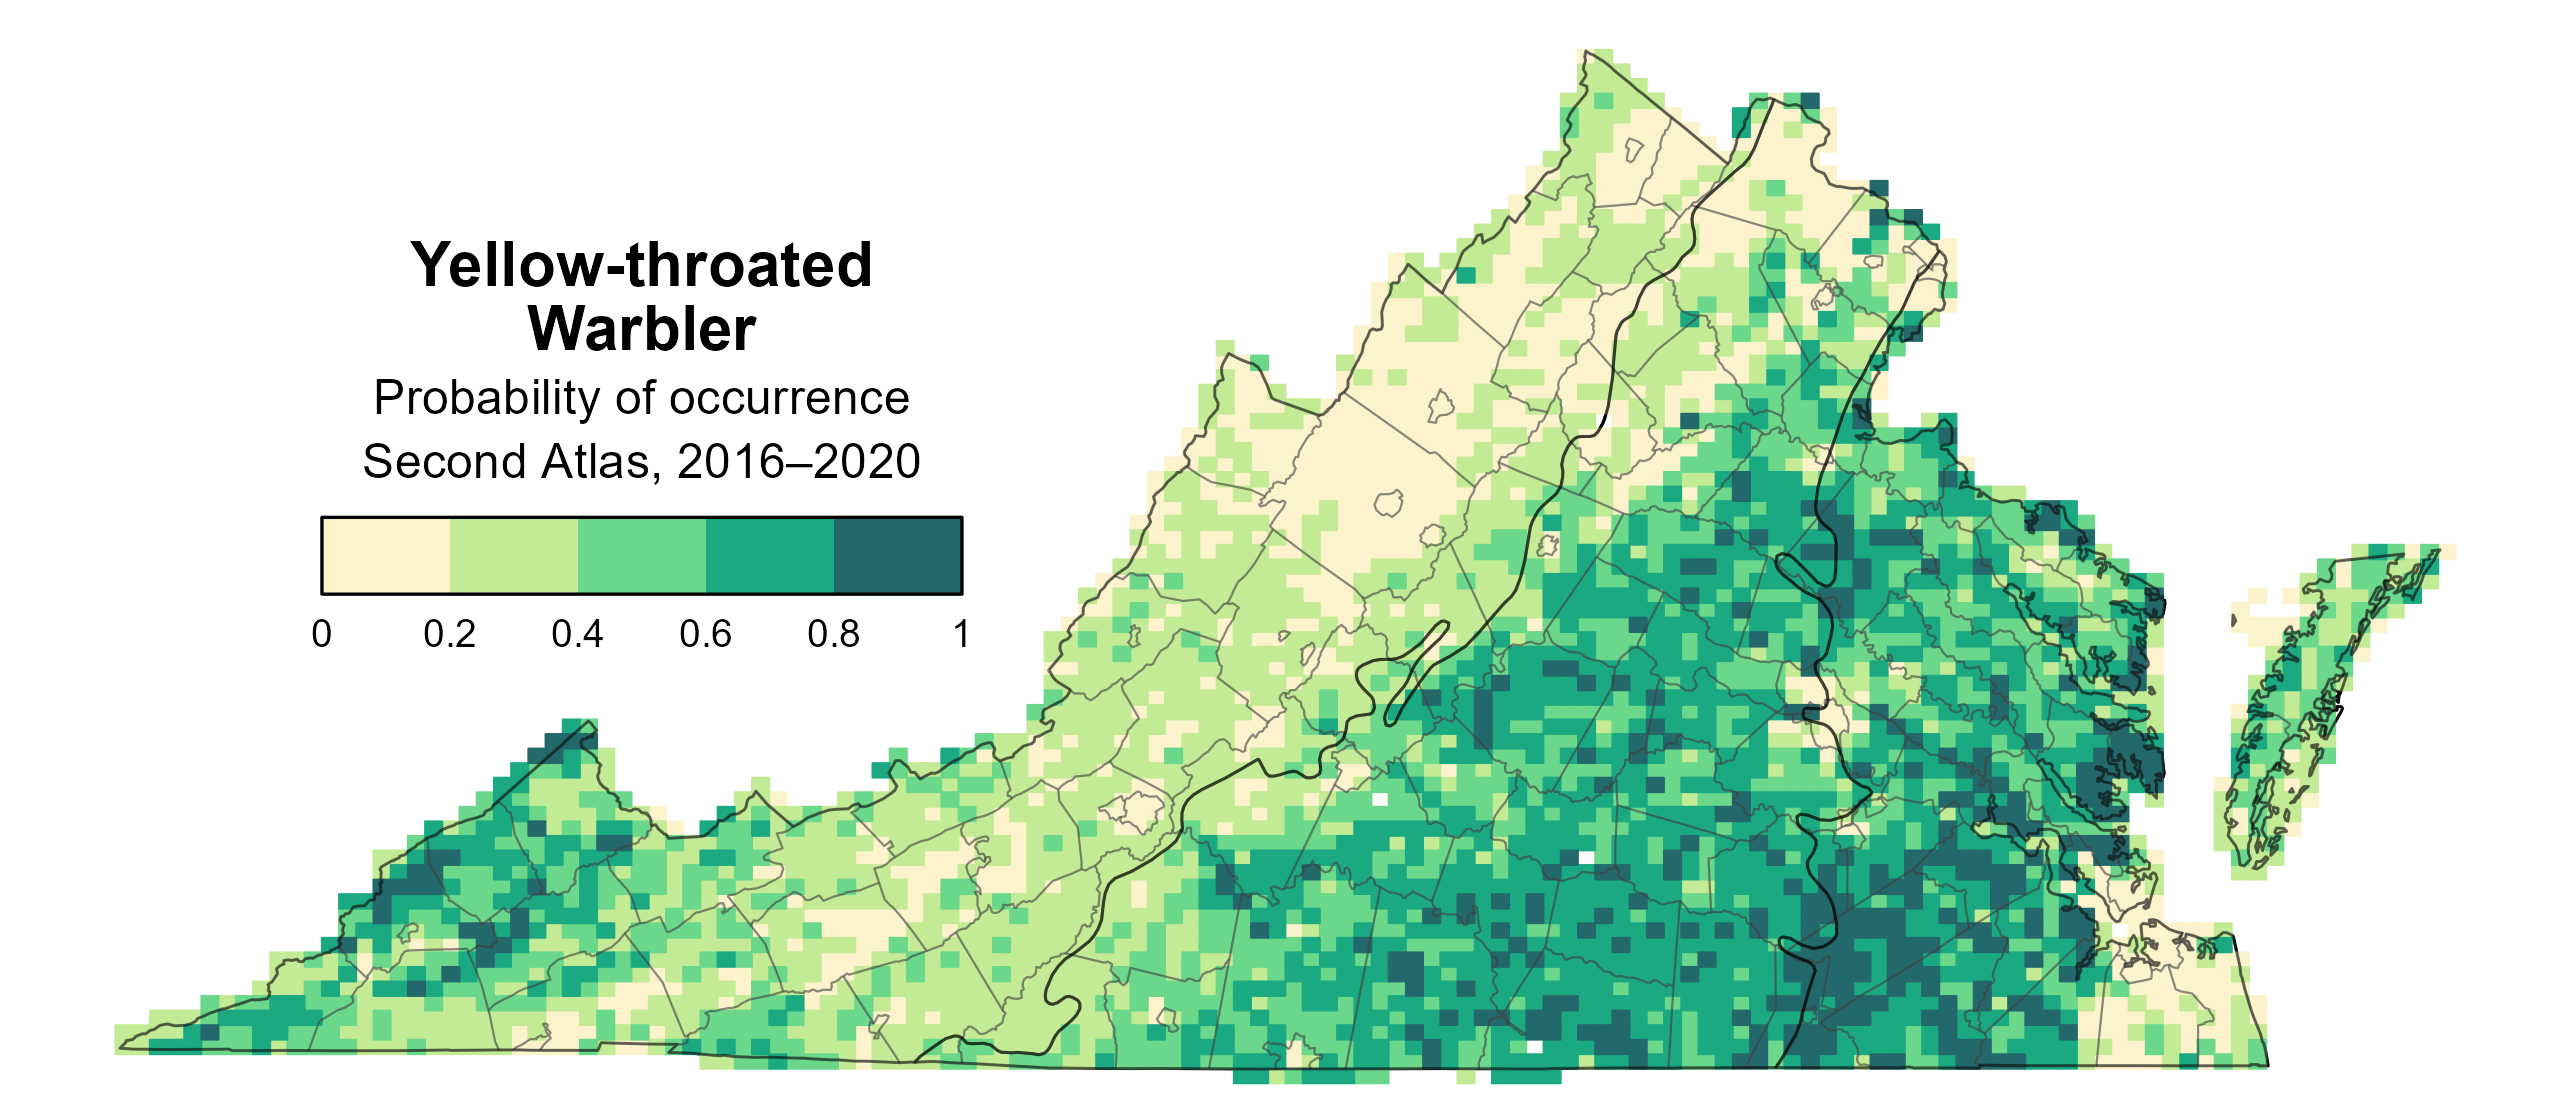
Figure 1: Yellow-throated Warbler breeding distribution based on probability of occurrence (Second Atlas, 2016–2020). This map indicates the probability that this species will occur in an Atlas block (an approximately 10 mi2 [26 km2] survey unit) based on environmental (including habitat) factors and after adjusting for the probability of detection (variation in survey effort among blocks).
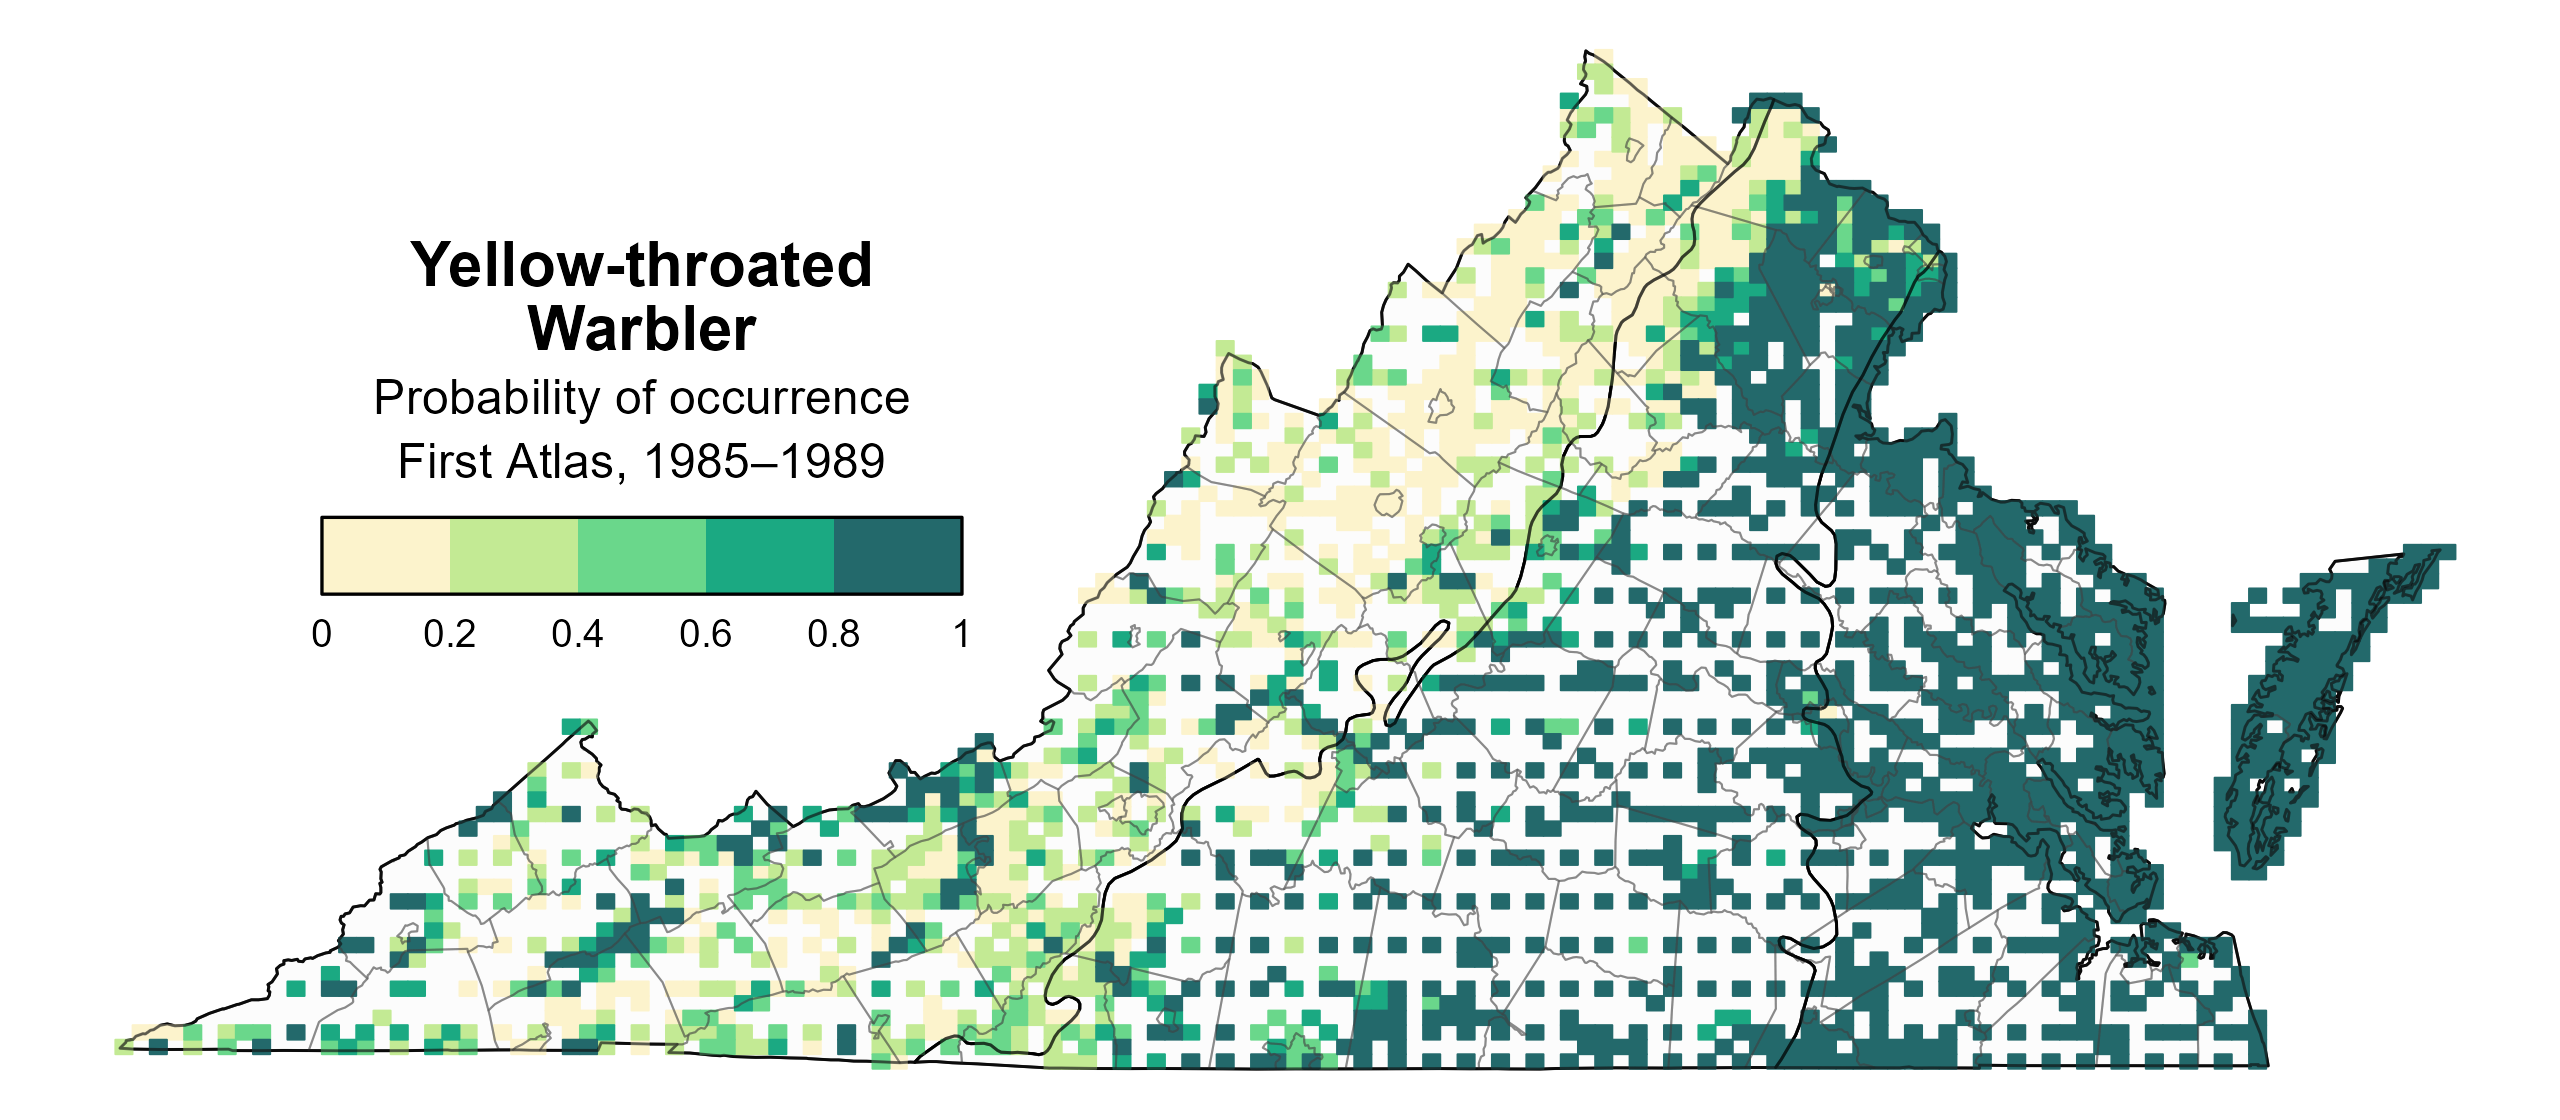
Figure 2: Yellow-throated Warbler breeding distribution based on probability of occurrence (First Atlas, 1985–1989). This map indicates the probability that this species will occur in an Atlas block (an approximately 10 mi2 [26 km2] survey unit) based on environmental (including habitat) factors and after adjusting for the probability of detection (variation in survey effort among blocks). Blocks in white were not surveyed during the First Atlas and were not modeled.
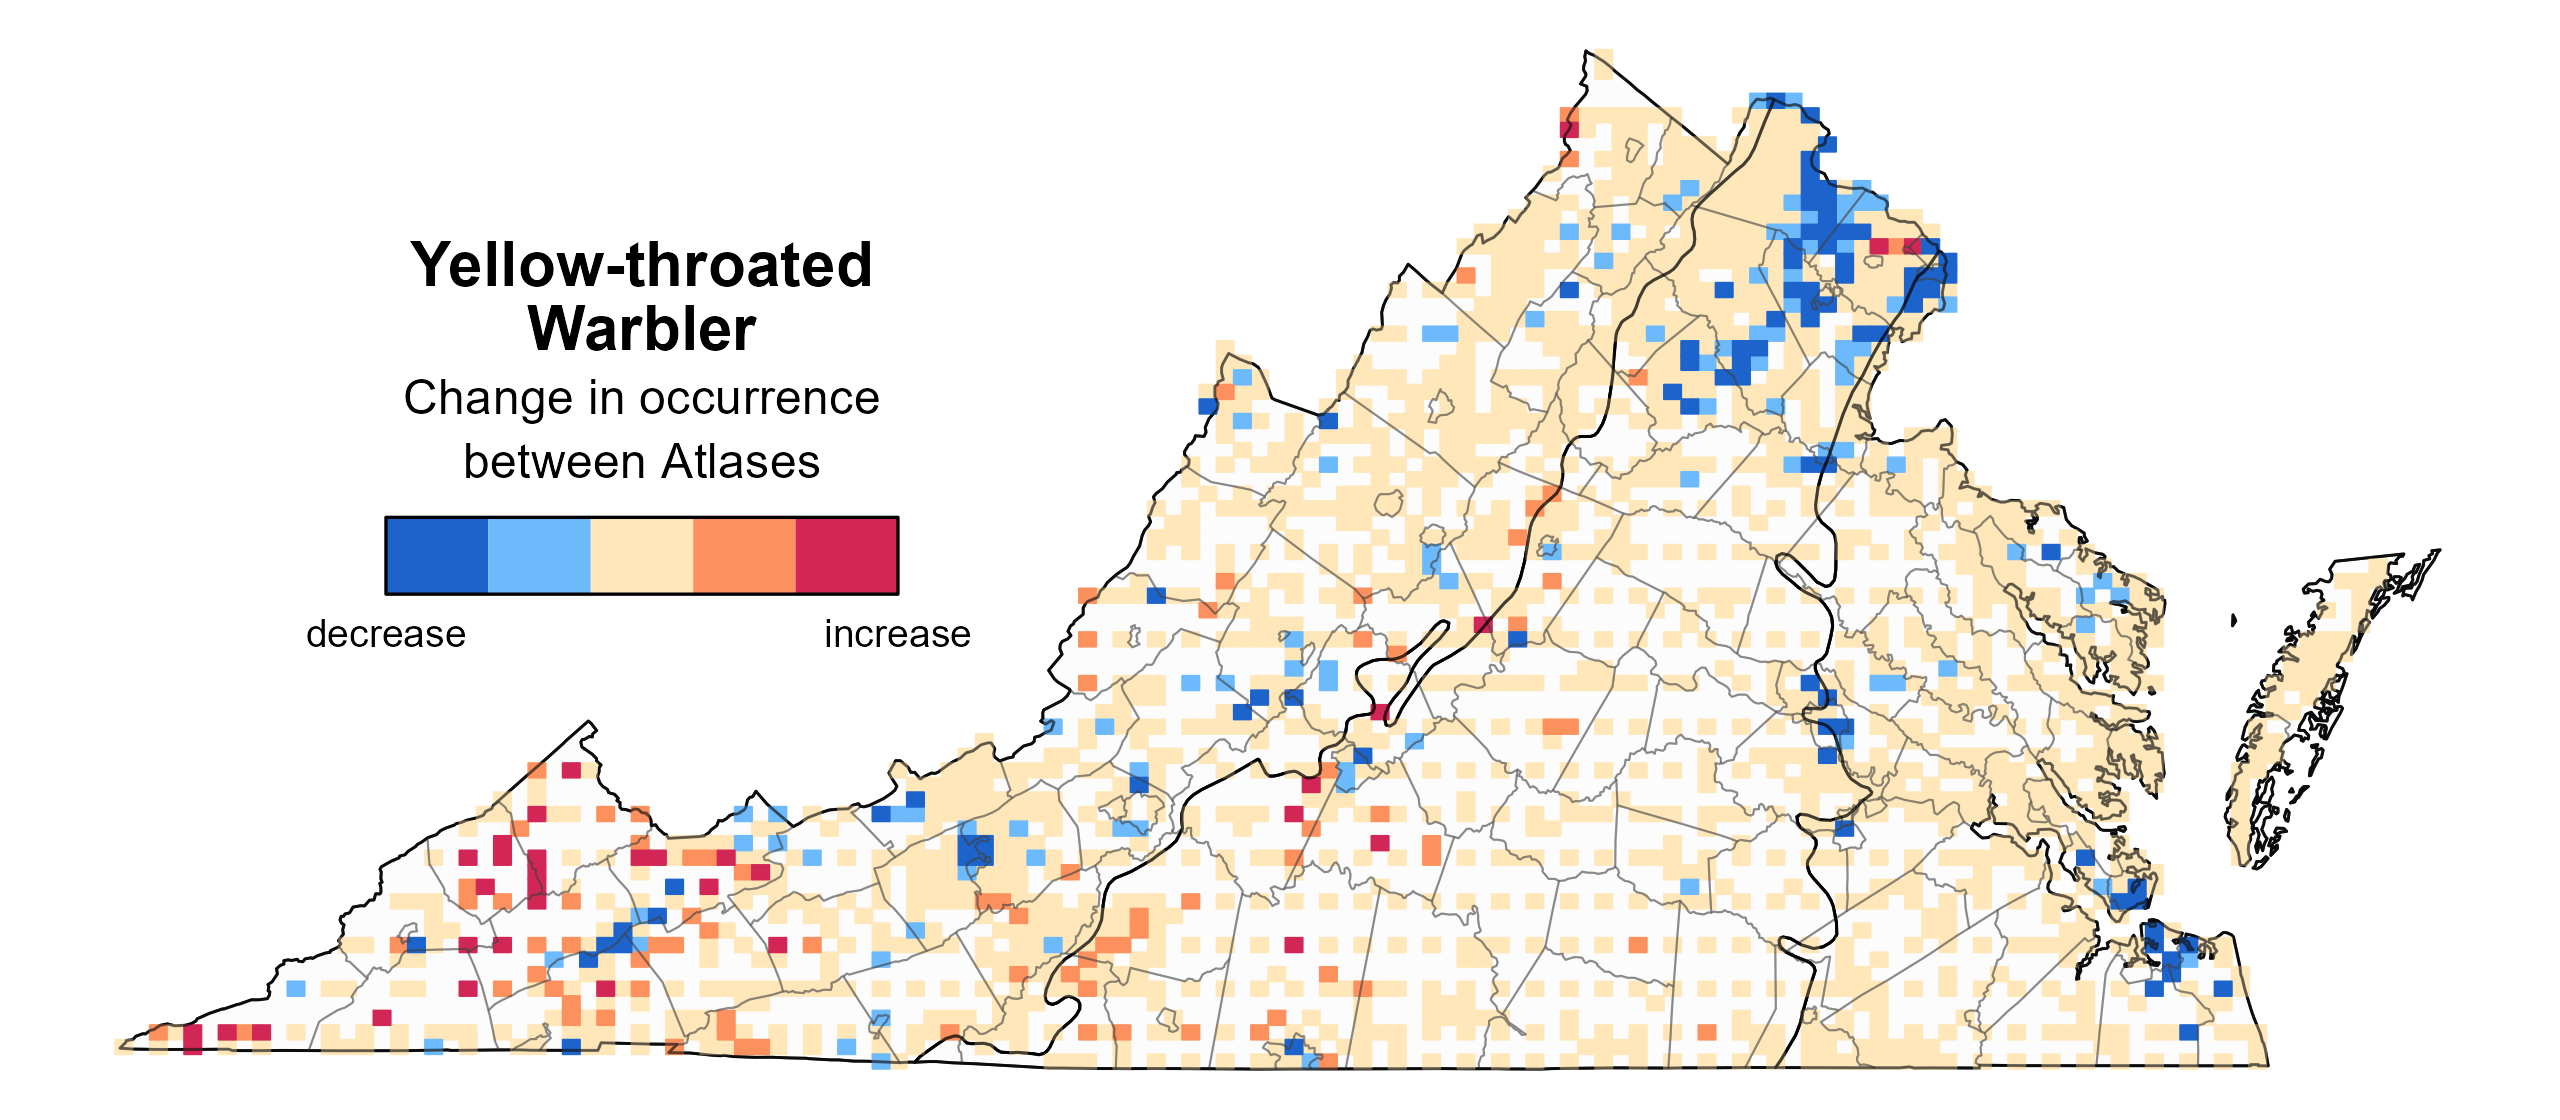
Figure 3: Yellow-throated Warbler change in breeding distribution between Atlases (1985–1989 and 2016–2020) based on probability of occurrence. This map indicates the change in the probability that this species will occur in a block (an approximately 10 mi2 [26 km2] survey unit) between Atlas periods. Blocks with no change (tan) may have constant presence or constant absence. Blocks in white were not surveyed during the First Atlas and were not modeled.
Breeding Evidence
Yellow-throated Warblers were confirmed breeders in 60 blocks and 38 counties and found to be probable breeders in 45 additional counties (Figure 4). Although breeding observations were recorded in similar locations between the two Atlases, there were substantially more observations during the Second Atlas (Figures 4 and 5). This increase in breeding observations is consistent with its increasing population trend in the region (see Population Status section); however, it is important to note that survey effort was also greater during the Second Atlas.
The earliest confirmed breeding behavior was recorded on April 1 when an occupied nest was observed, and this was closely followed by observations of adults carrying nesting material. However, breeding was confirmed primarily through observations of adults carrying food (May 28 – July 4), recently fledged young (June 4 – July 10), and adults feeding young (June 10 – July 22) (Figure 6).
For more general information on the breeding habits of this species, please refer to All About Birds.
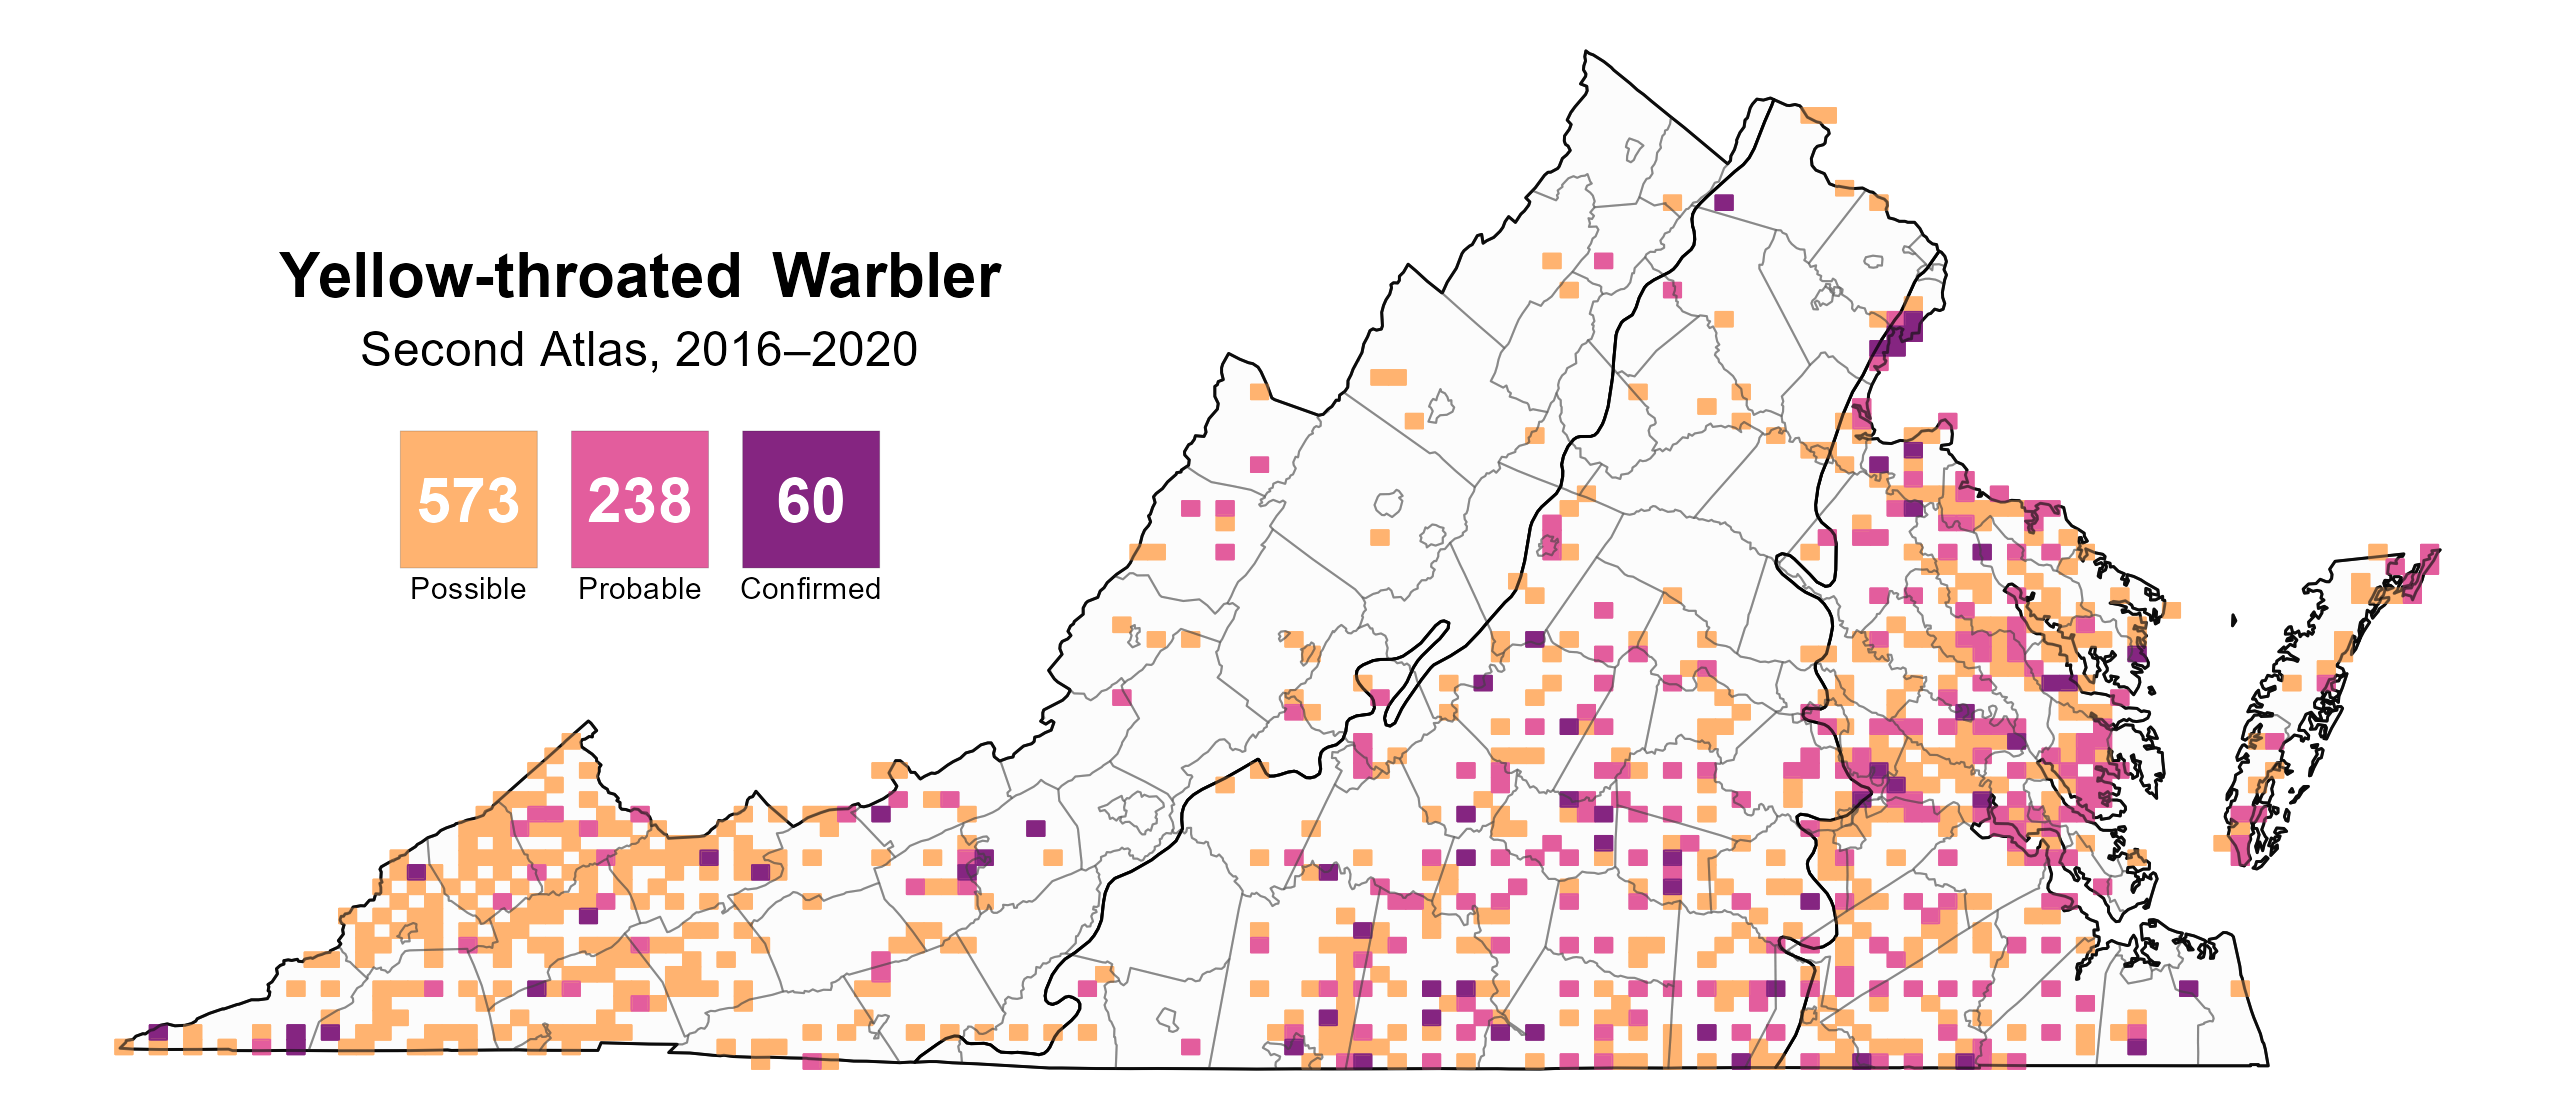
Figure 4: Yellow-throated Warbler breeding observations from the Second Atlas (2016–2020). The colored boxes illustrate Atlas blocks (approximately 10 mi2 [26 km2] survey units) where the species was detected. The colors show the highest breeding category recorded in a block. The numbers within the colors in the legend correspond to the number of blocks with that breeding evidence category.

Figure 5: Yellow-throated Warbler breeding observations from the First Atlas (1985–1989). The colored boxes illustrate Atlas blocks (approximately 10 mi2 [26 km2] survey units) where the species was detected. The colors show the highest breeding category recorded in a block. The numbers within the colors in the legend correspond to the number of blocks with that breeding evidence category.
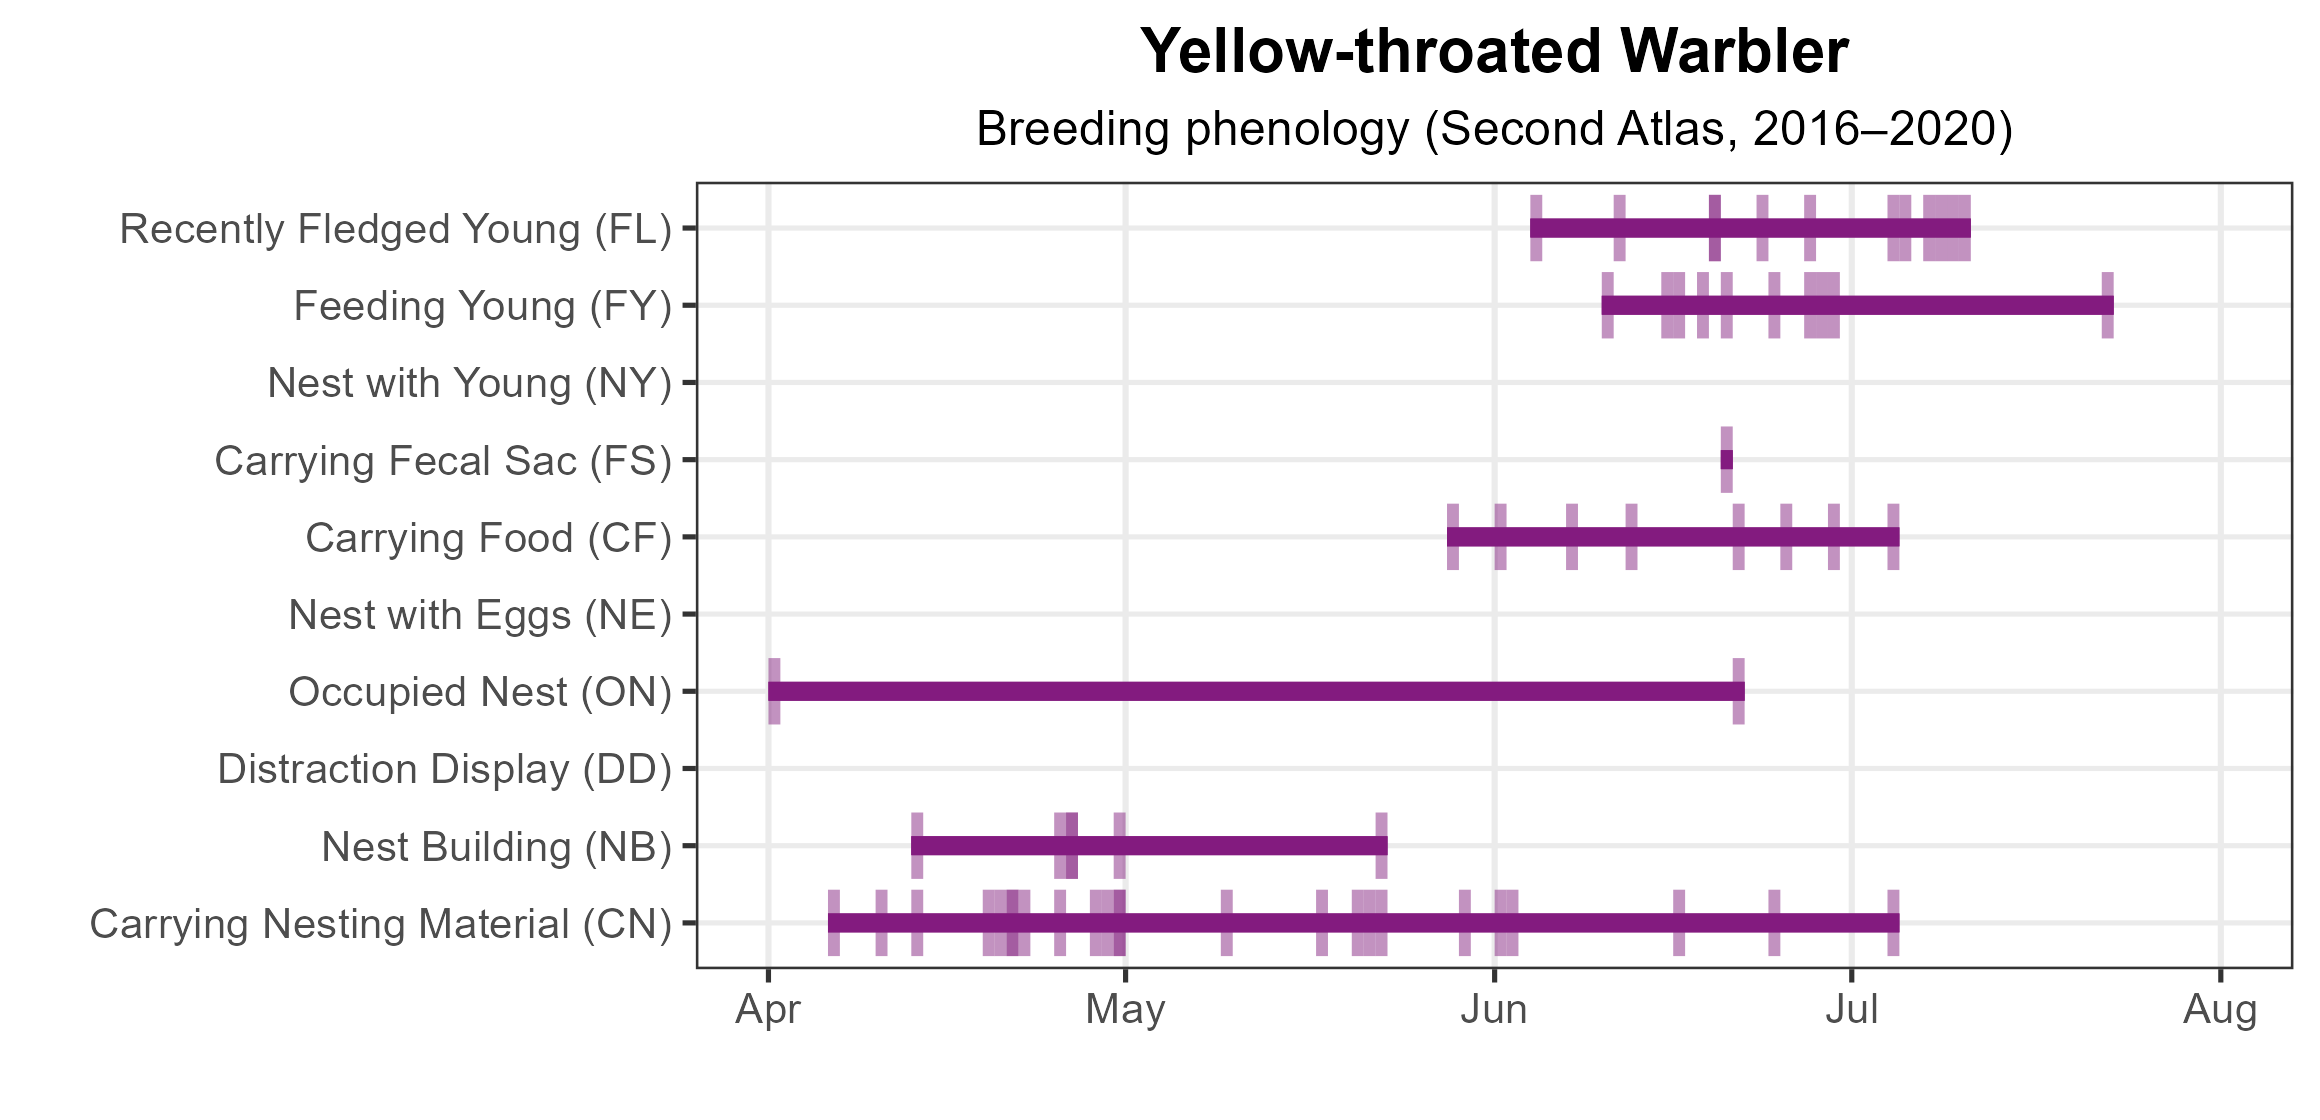
Figure 6: Yellow-throated Warbler phenology: confirmed breeding codes. This graph shows a timeline of confirmed breeding behaviors. Tick marks represent individual observations of the behavior.
Population Status
Yellow-throated Warbler relative abundance was estimated to be highest in the southwestern and southeastern corners of the state, especially the southeastern portion of the Piedmont region and the southern three-fourths of the Coastal Plain region. Predicted abundance was low and variable across the remainder of the state (Figure 7).
The total estimated Yellow-throated Warbler population in the state is 201,000 individuals (with a range between 130,000 and 317,000). Based on the North American Breeding Bird Survey (BBS) data for the Atlantic Flyway region (data for Virginia did not produce a credible trend), the Yellow-throated Warbler’s population increased by a significant 1.36% annually from 1966–2022 in the region, and between Atlas periods, it showed a similar significant increase of 1.41% per year from 1987–2018 (Hostetler et al. 2023; Figure 8).

Figure 7: Yellow-throated Warbler relative abundance (Second Atlas, 2016–2020). This map indicates the predicted abundance of this species at a 0.4 mi2 (1 km2) scale based on environmental (including habitat) factors. Abundance values are presented on a relative scale of low to high.

Figure 8: Yellow-throated Warbler population trend for the Atlantic Flyway as estimated by the North American Breeding Bird Survey. The vertical axis shows species abundance; the horizontal axis shows the year. The solid line indicates the estimated population trend; there is a 97.5% probability that the true population trend falls between the dashed lines. The shaded bars indicate the First and Second Atlas periods.
Conservation
Yellow-throated Warblers are common and widespread in Virginia and throughout their range (McKay and Hall 2020). Given their increasing population trend in the region, the species is not considered a species of special concern in the Commonwealth, and no specific conservation projects are underway in Virginia.
Interactive Map
The interactive map contains up to six Atlas layers (probability of occurrence for the First and Second Atlases, change in probability of occurrence between Atlases, breeding evidence for the First and Second Atlases, and abundance for the Second Atlas) that can be viewed one at a time. To view an Atlas map layer, mouse over the layer box in the upper left. County lines and physiographic regional boundaries (Mountains and Valleys, Piedmont, and Coastal Plain) can be turned on and off by checking or unchecking the box below the layer box. Within the map window, users can hover on a block to see its value for each layer and pan and zoom to see roads, towns, and other features of interest that are visible beneath a selected layer.
View Interactive Map in Full Screen
References
Hostetler, J. A., J. R. Sauer, J. E. Hines, D. Ziolkowski, and M. Lutmerding (2023). The North American breeding bird survey, analysis results 1966–2022. U.S. Geological Survey, Laurel, MD, USA. https://doi.org/10.5066/P9SC7T11.
McKay, B. and G. A. Hall (2020). Yellow-throated Warbler (Setophaga dominica), version 1.0. In Birds of the World (A. F. Poole, Editor). Cornell Lab of Ornithology, Ithaca, NY, USA. https://doi.org/10.2173/bow.yetwar.01.