Introduction
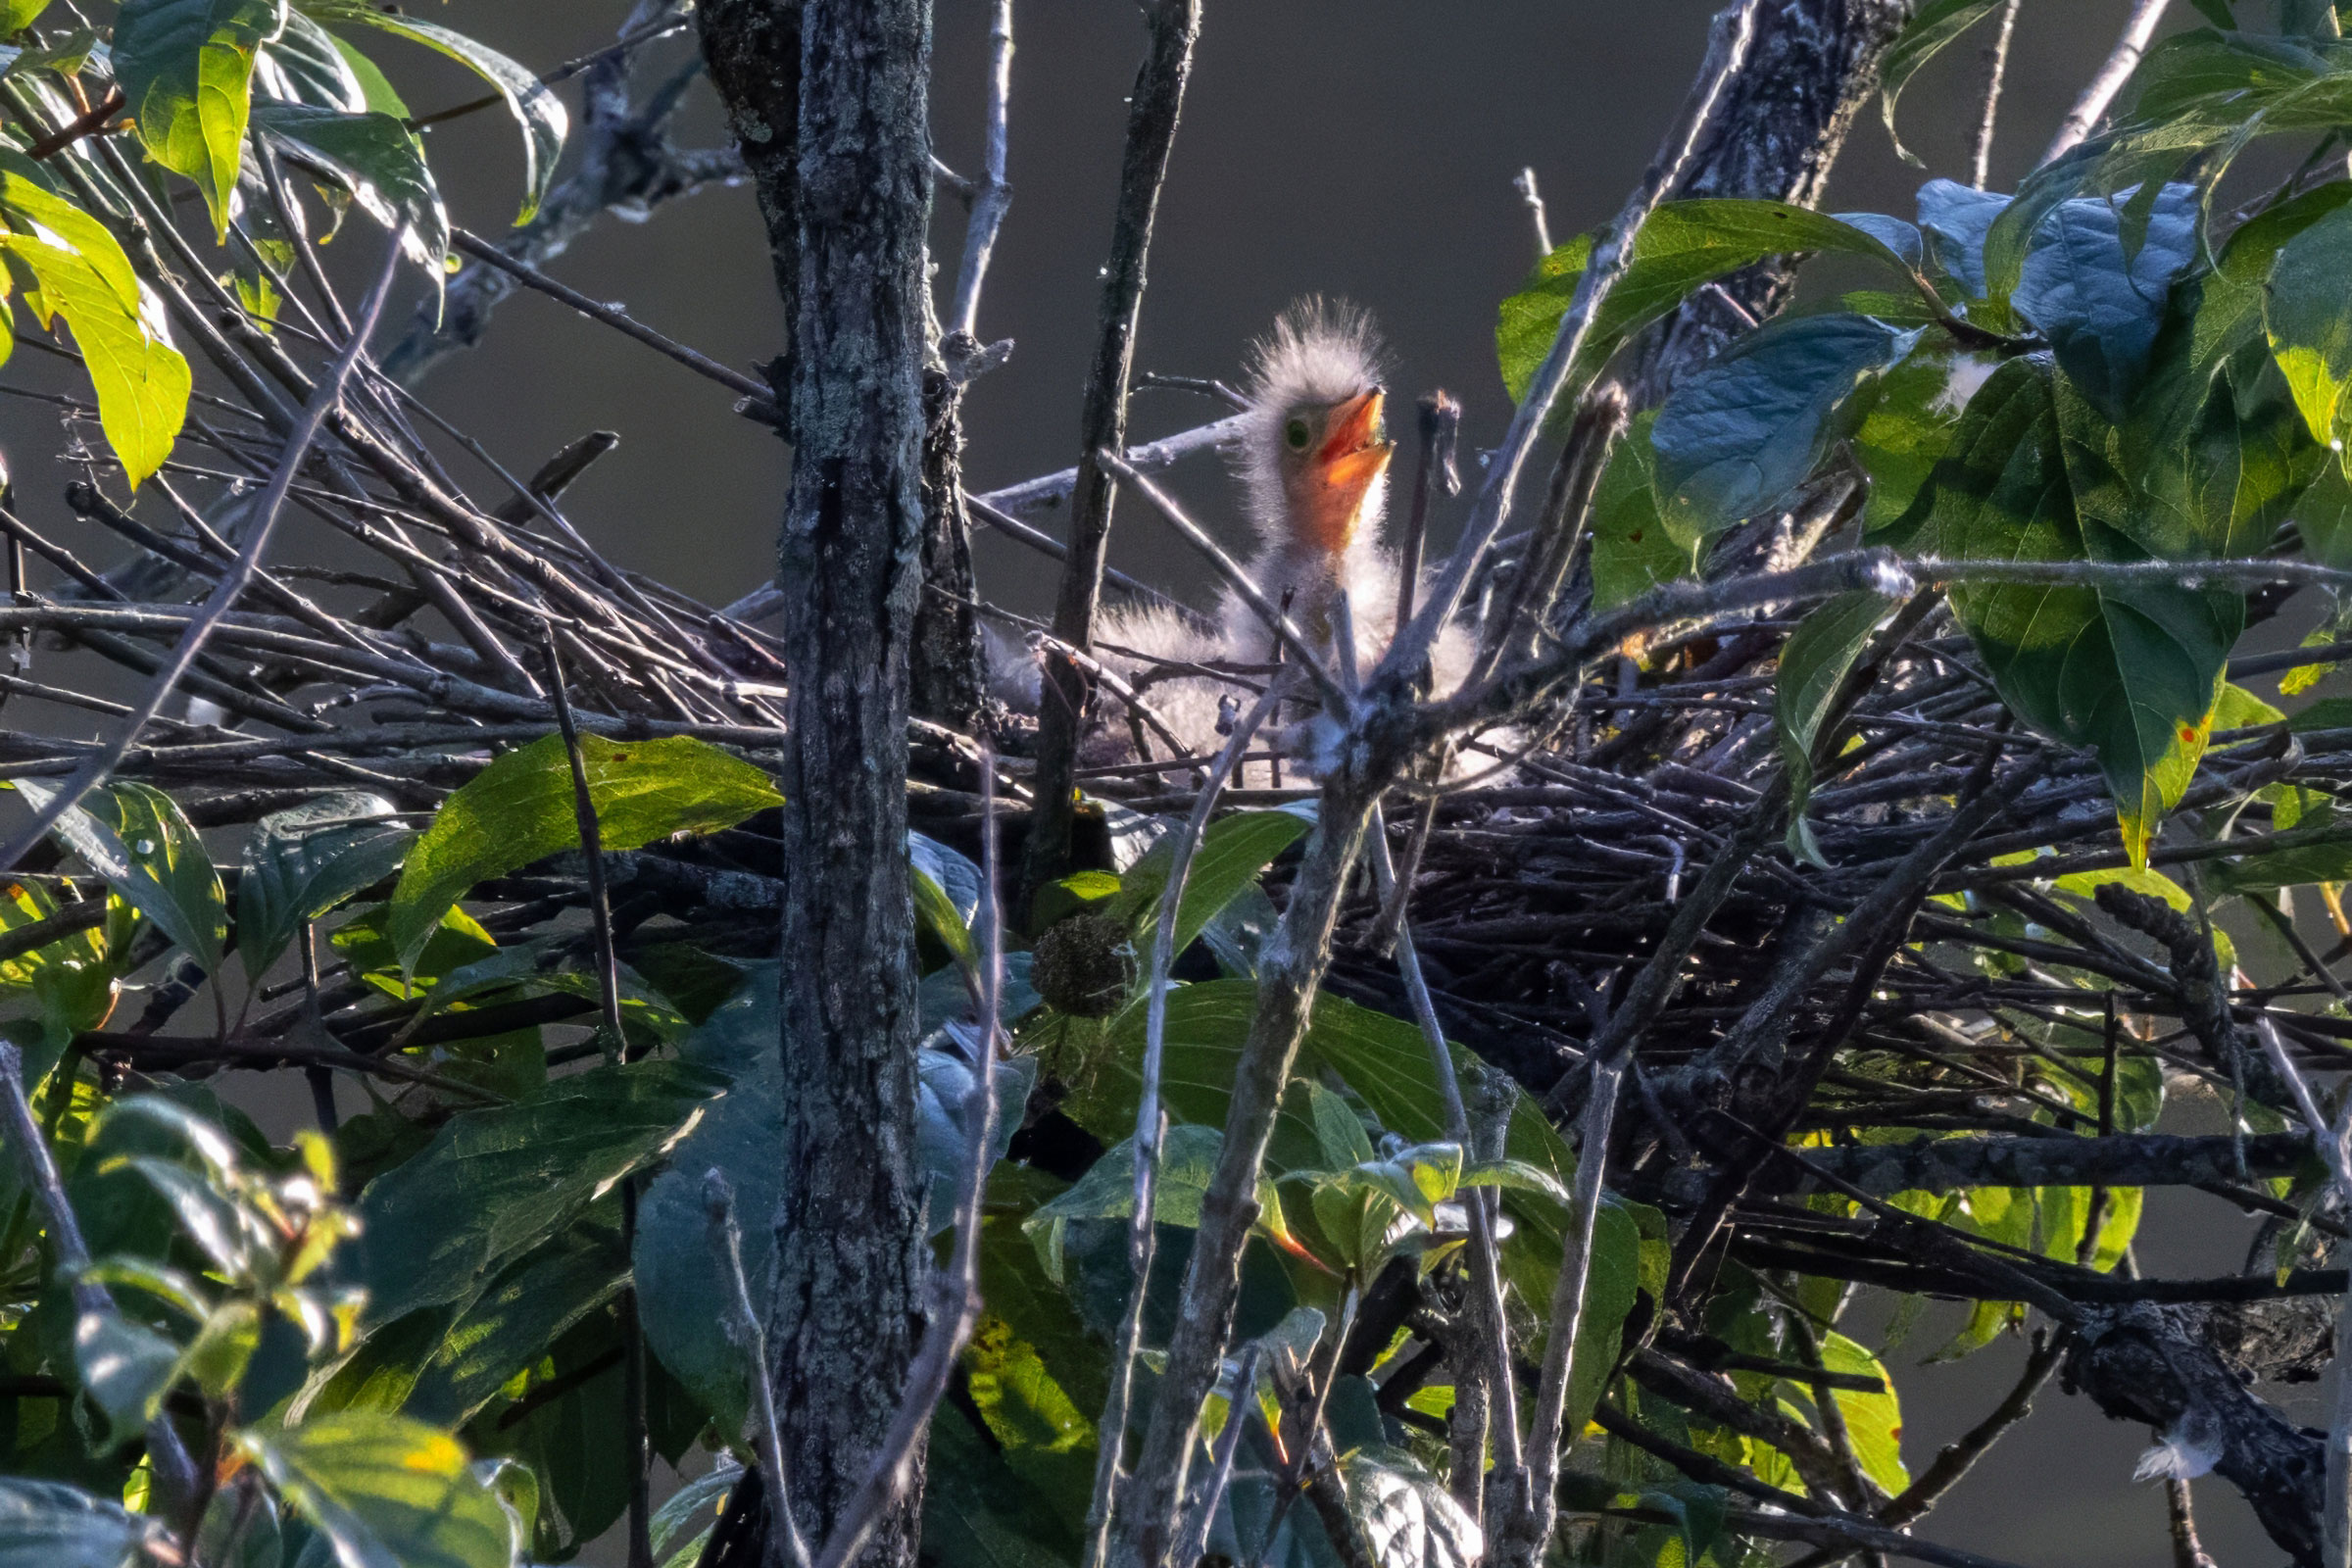
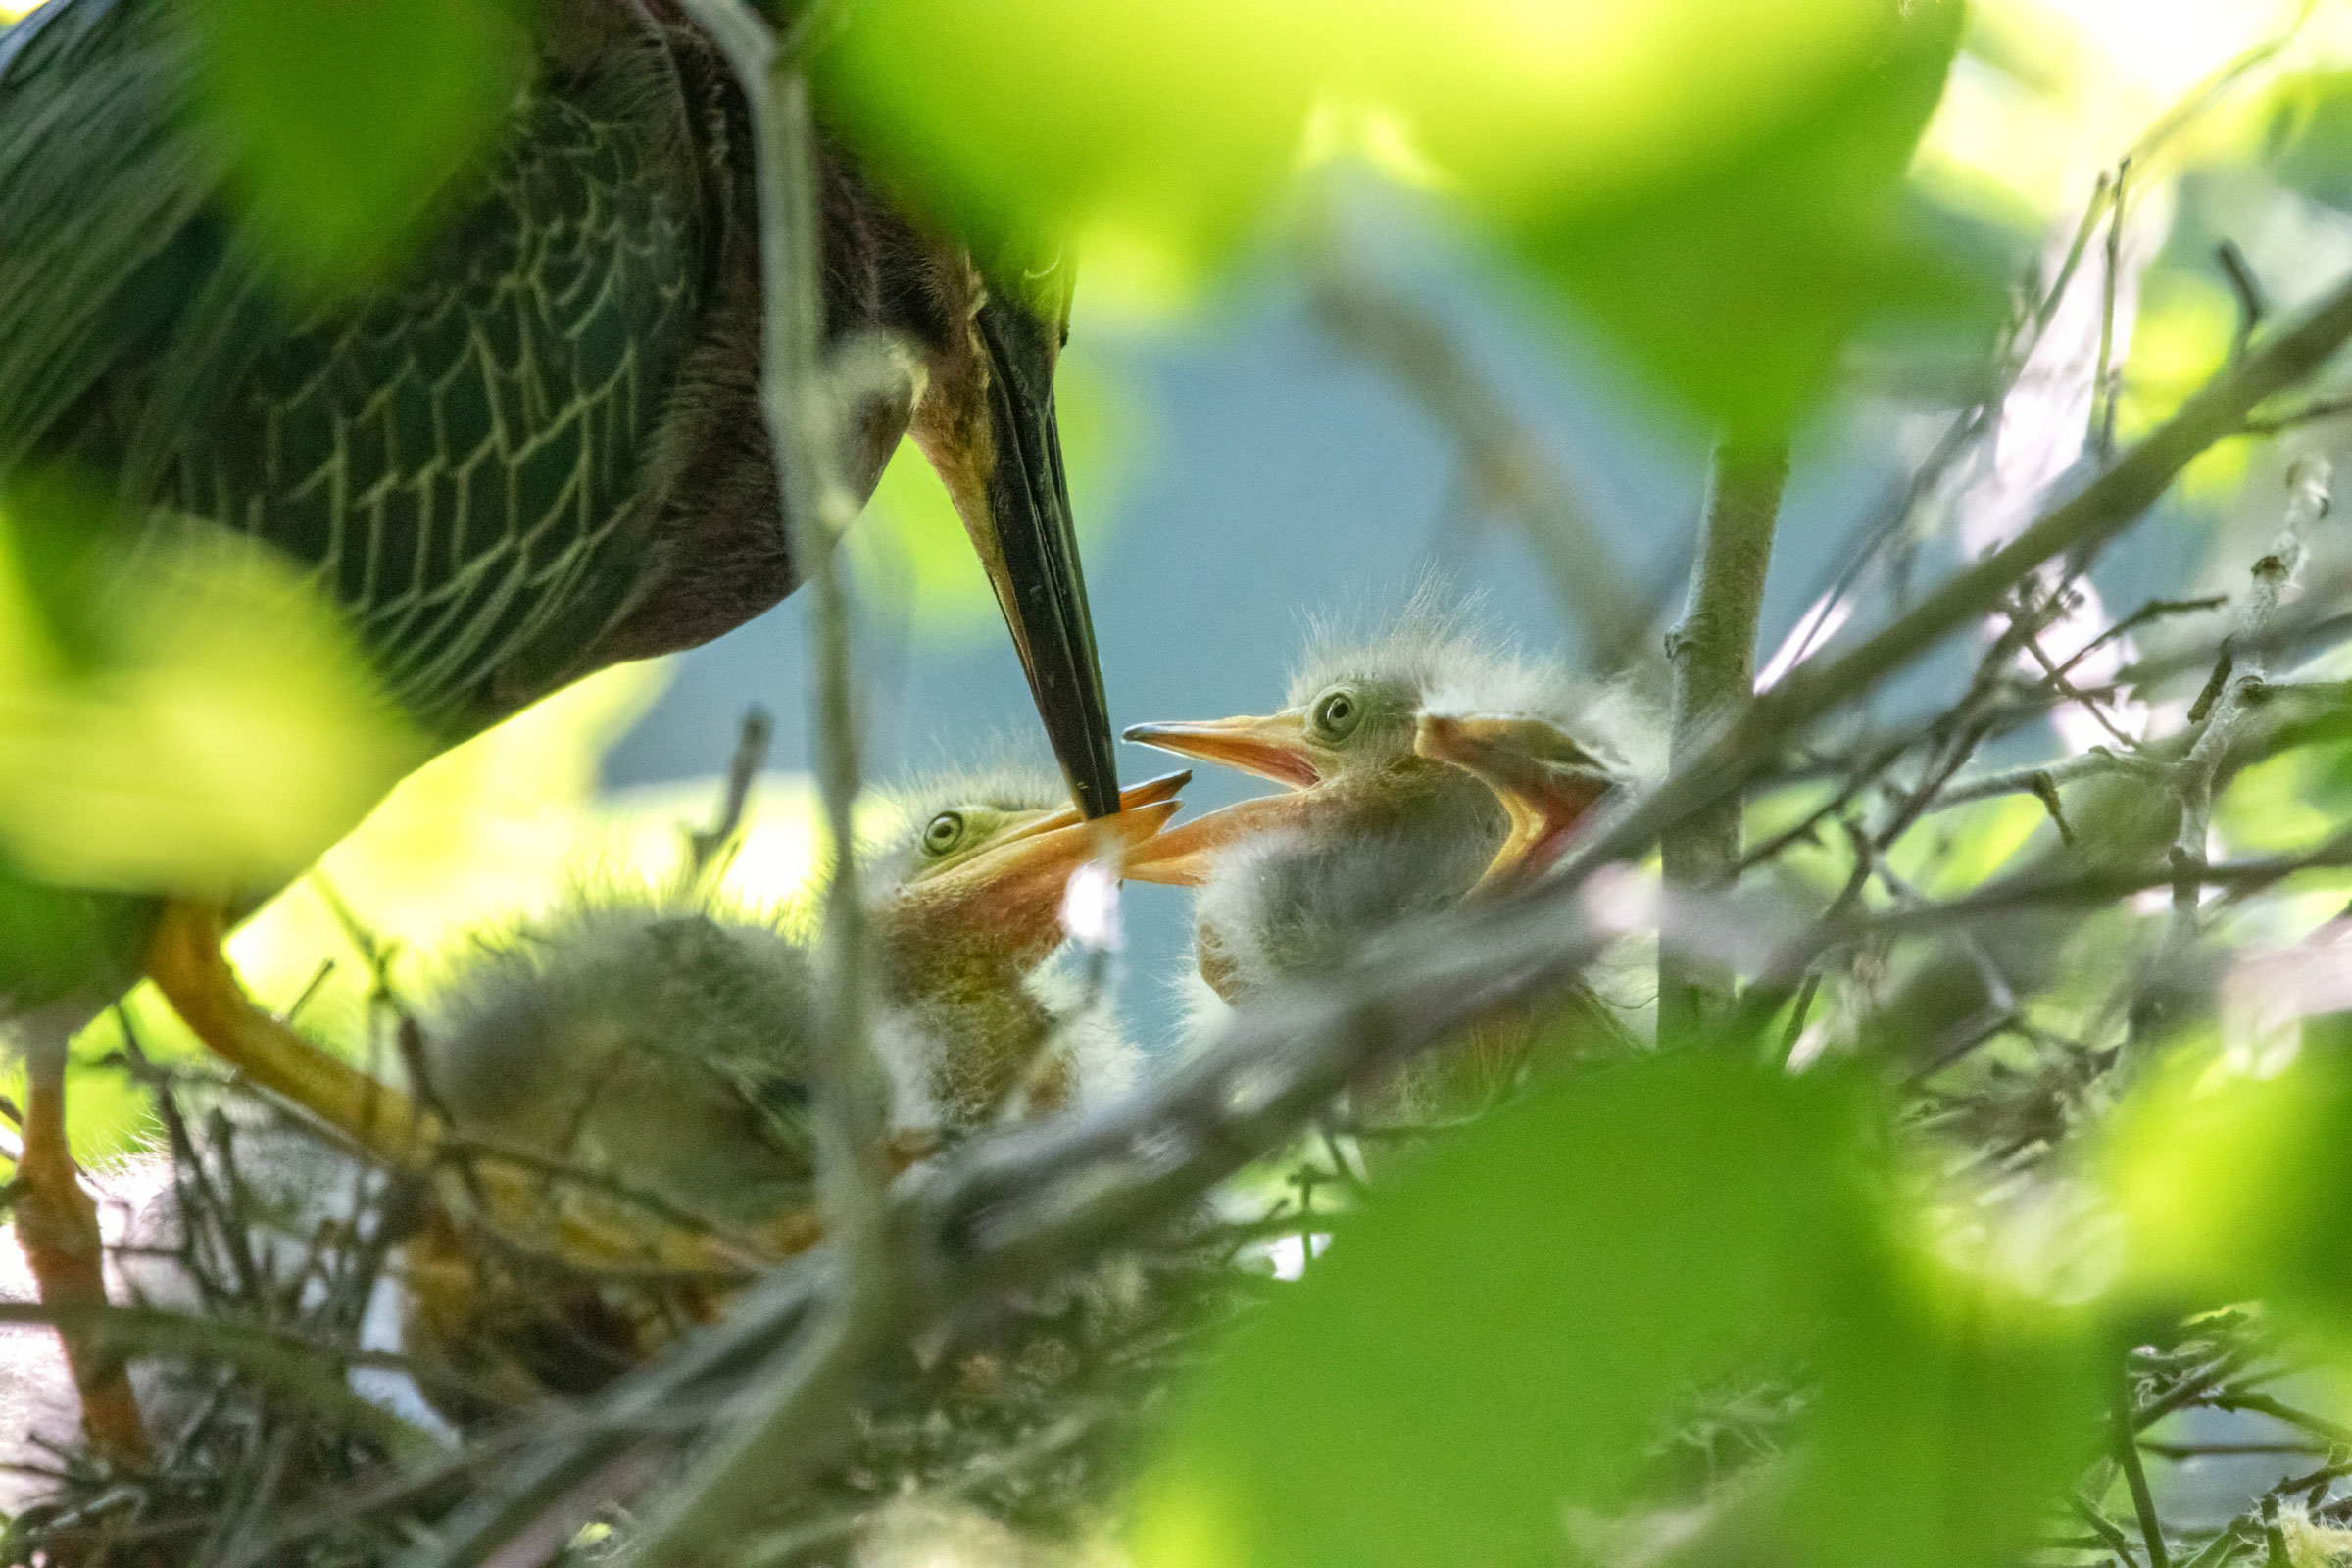
The Green Heron is a squat little heron that can be found searching for minnows along quiet waterways, wooded wetlands, and vegetated retention ponds. It is often seen only in retreat, giving a squawk and flying away from the observer when startled. If left undisturbed, lucky observers may get to see their compact neck turn into a living harpoon as they hunt. Remarkably, Green Herons are one of the few bird species known to use tools. They have been observed using bait such as bread crusts and live insects to lure fish within striking distance (Davis and Kushlan 2020).
Although technically colonial waterbirds, Green Herons often nest solitarily or in loose clusters rather than joining large, mixed-species rookeries. After fledging, young birds can wander widely in a phenomenon called post-breeding dispersal; birds banded in the nest in Maryland and Virginia have gone as far as Wisconsin and Puerto Rico by October (Davis and Kushlan 2020).
Breeding Distribution
Green Herons are likely to be encountered in all regions of the state but are most likely to occur in three main regions: the outer Coastal Plain, urban areas of the Piedmont, and lowlands of the Mountains and Valleys region (Figure 1). They are more likely to be found in blocks with more forest edge habitat and lower overall forest cover, indicating a preference for a varied landscape with many openings.
Breeding distribution during the First Atlas and the change between Atlases could not be modeled due to model limitations (see Interpreting Species Accounts). For more information on its distribution during the First Atlas, please see the Breeding Evidence section.
View Environmental Associations

Figure 1: Green Heron breeding distribution based on probability of occurrence (Second Atlas, 2016–2020). This map indicates the probability that this species will occur in an Atlas block (an approximately 10 mi2 [26 km2] survey unit) based on environmental (including habitat) factors and after adjusting for the probability of detection (variation in survey effort among blocks).
Breeding Evidence
Evidence of Green Heron breeding was found in all regions of the state. Green Herons were confirmed breeders in 164 blocks in 71 counties and probable breeders in an additional 11 counties (Figure 2). During the First Atlas, they were confirmed in 89 blocks, also scattered across the state (Figure 3).
Despite being a colonial nester, Green Herons are much less obvious than their larger cousins like Great Blue Herons (Ardea herodias) and much less gregarious than night herons. Nonetheless, a clear picture of their breeding phenology emerges from observations during the Second Atlas. Work on nests began on April 9 and continued through late July (Figure 4). Eggs were observed from May 10 to June 20, and dependent young were seen from May 20 to late August.
For more general information on the breeding habits of this species, please refer to All About Birds.
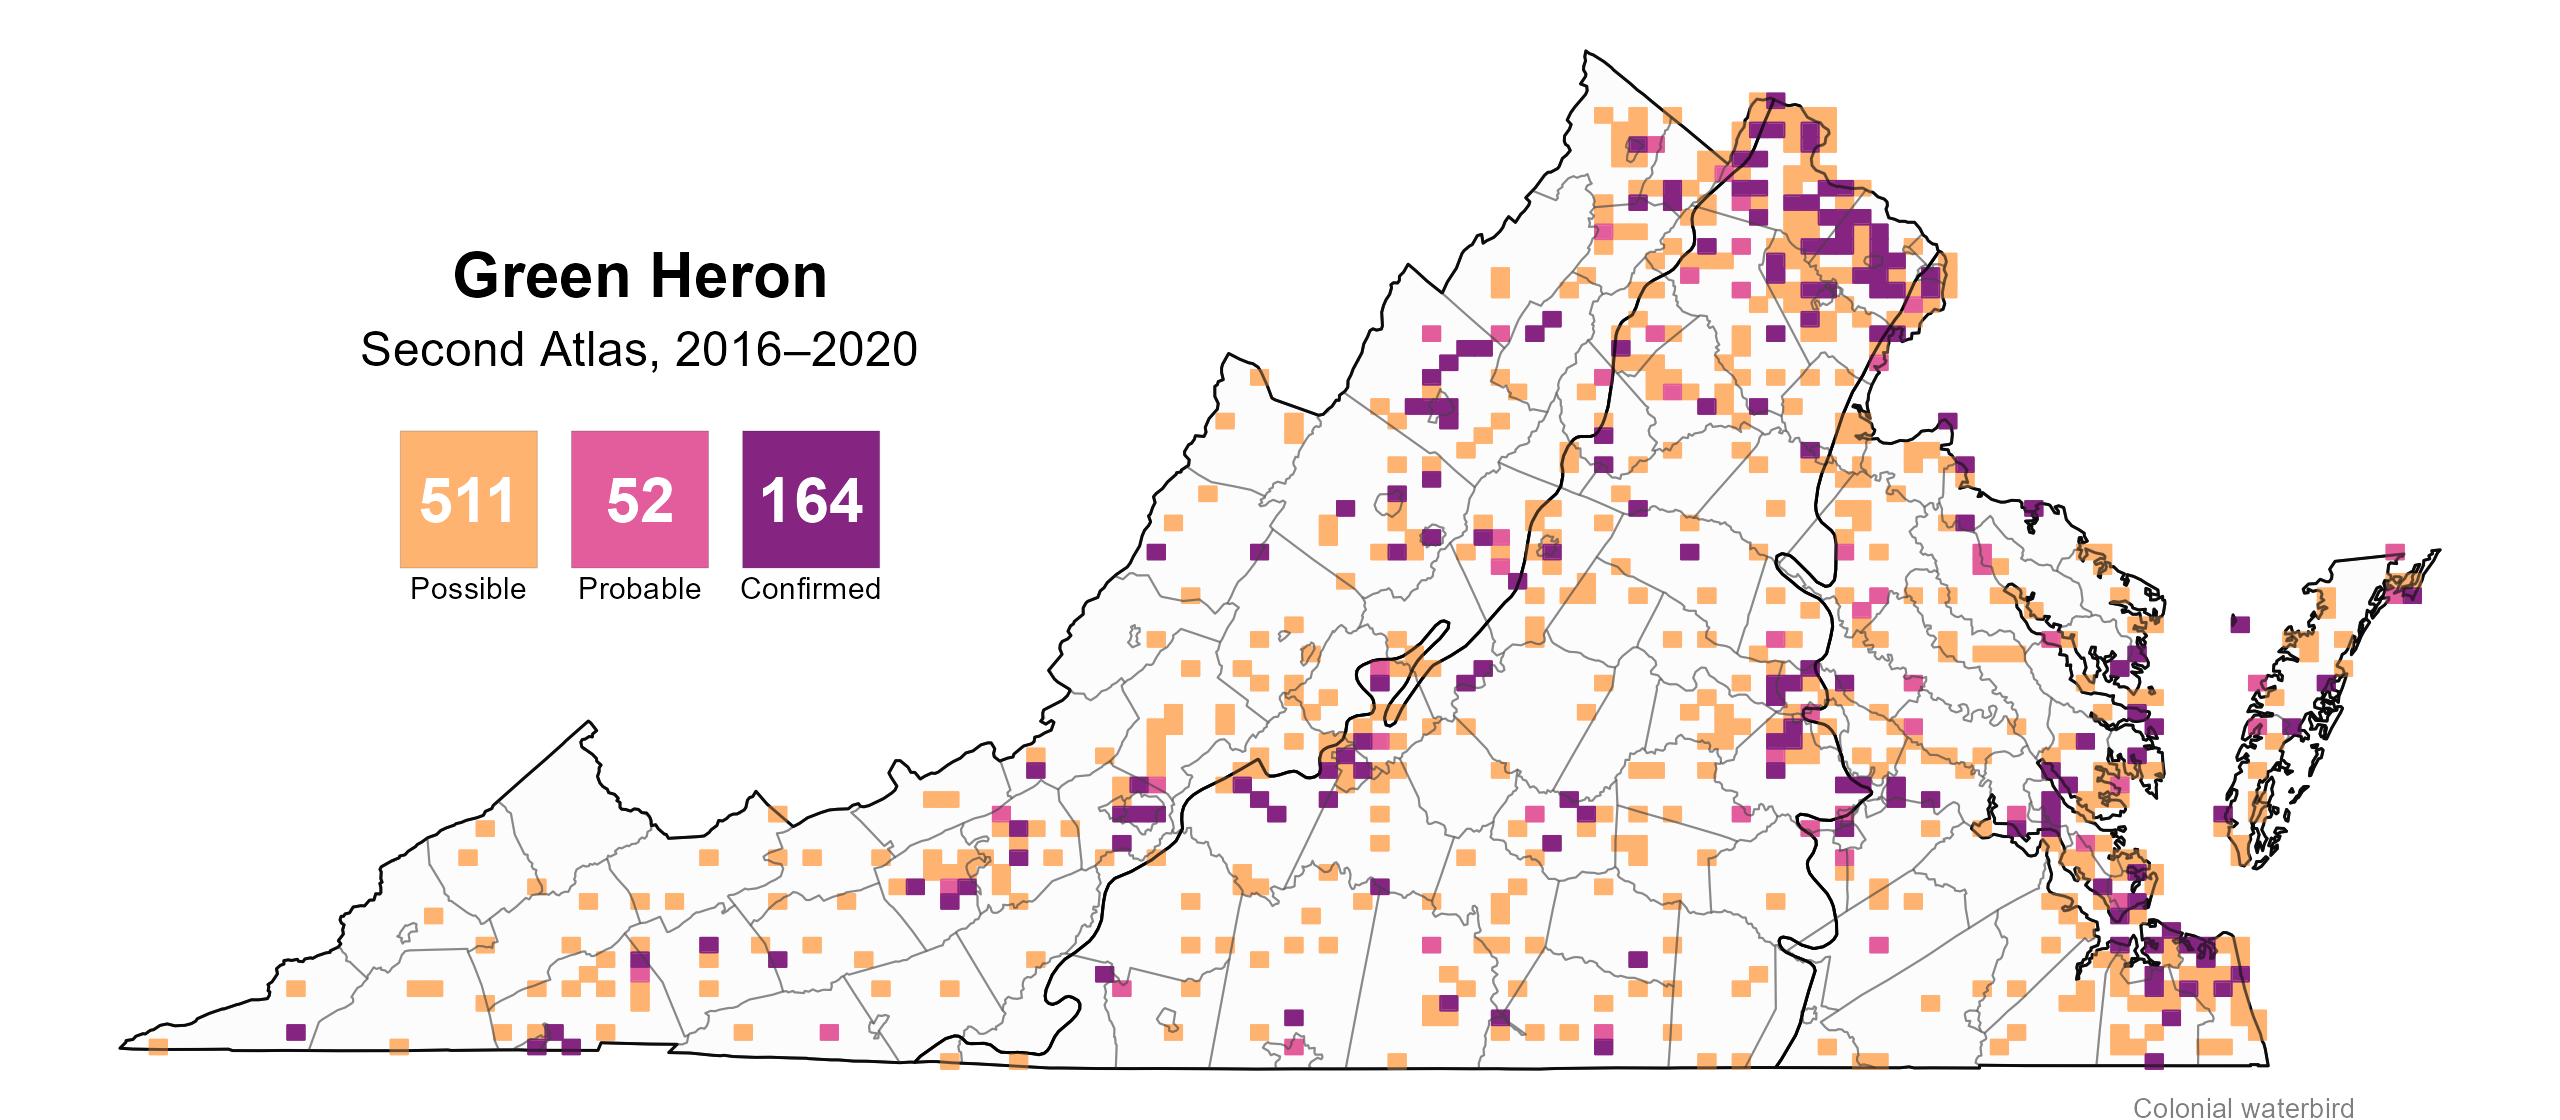
Figure 2: Green Heron breeding observations from the Second Atlas (2016–2020). The colored boxes illustrate Atlas blocks (approximately 10 mi2 [26 km2] survey units) where the species was detected. The colors show the highest breeding category recorded in a block. The numbers within the colors in the legend correspond to the number of blocks with that breeding evidence category.
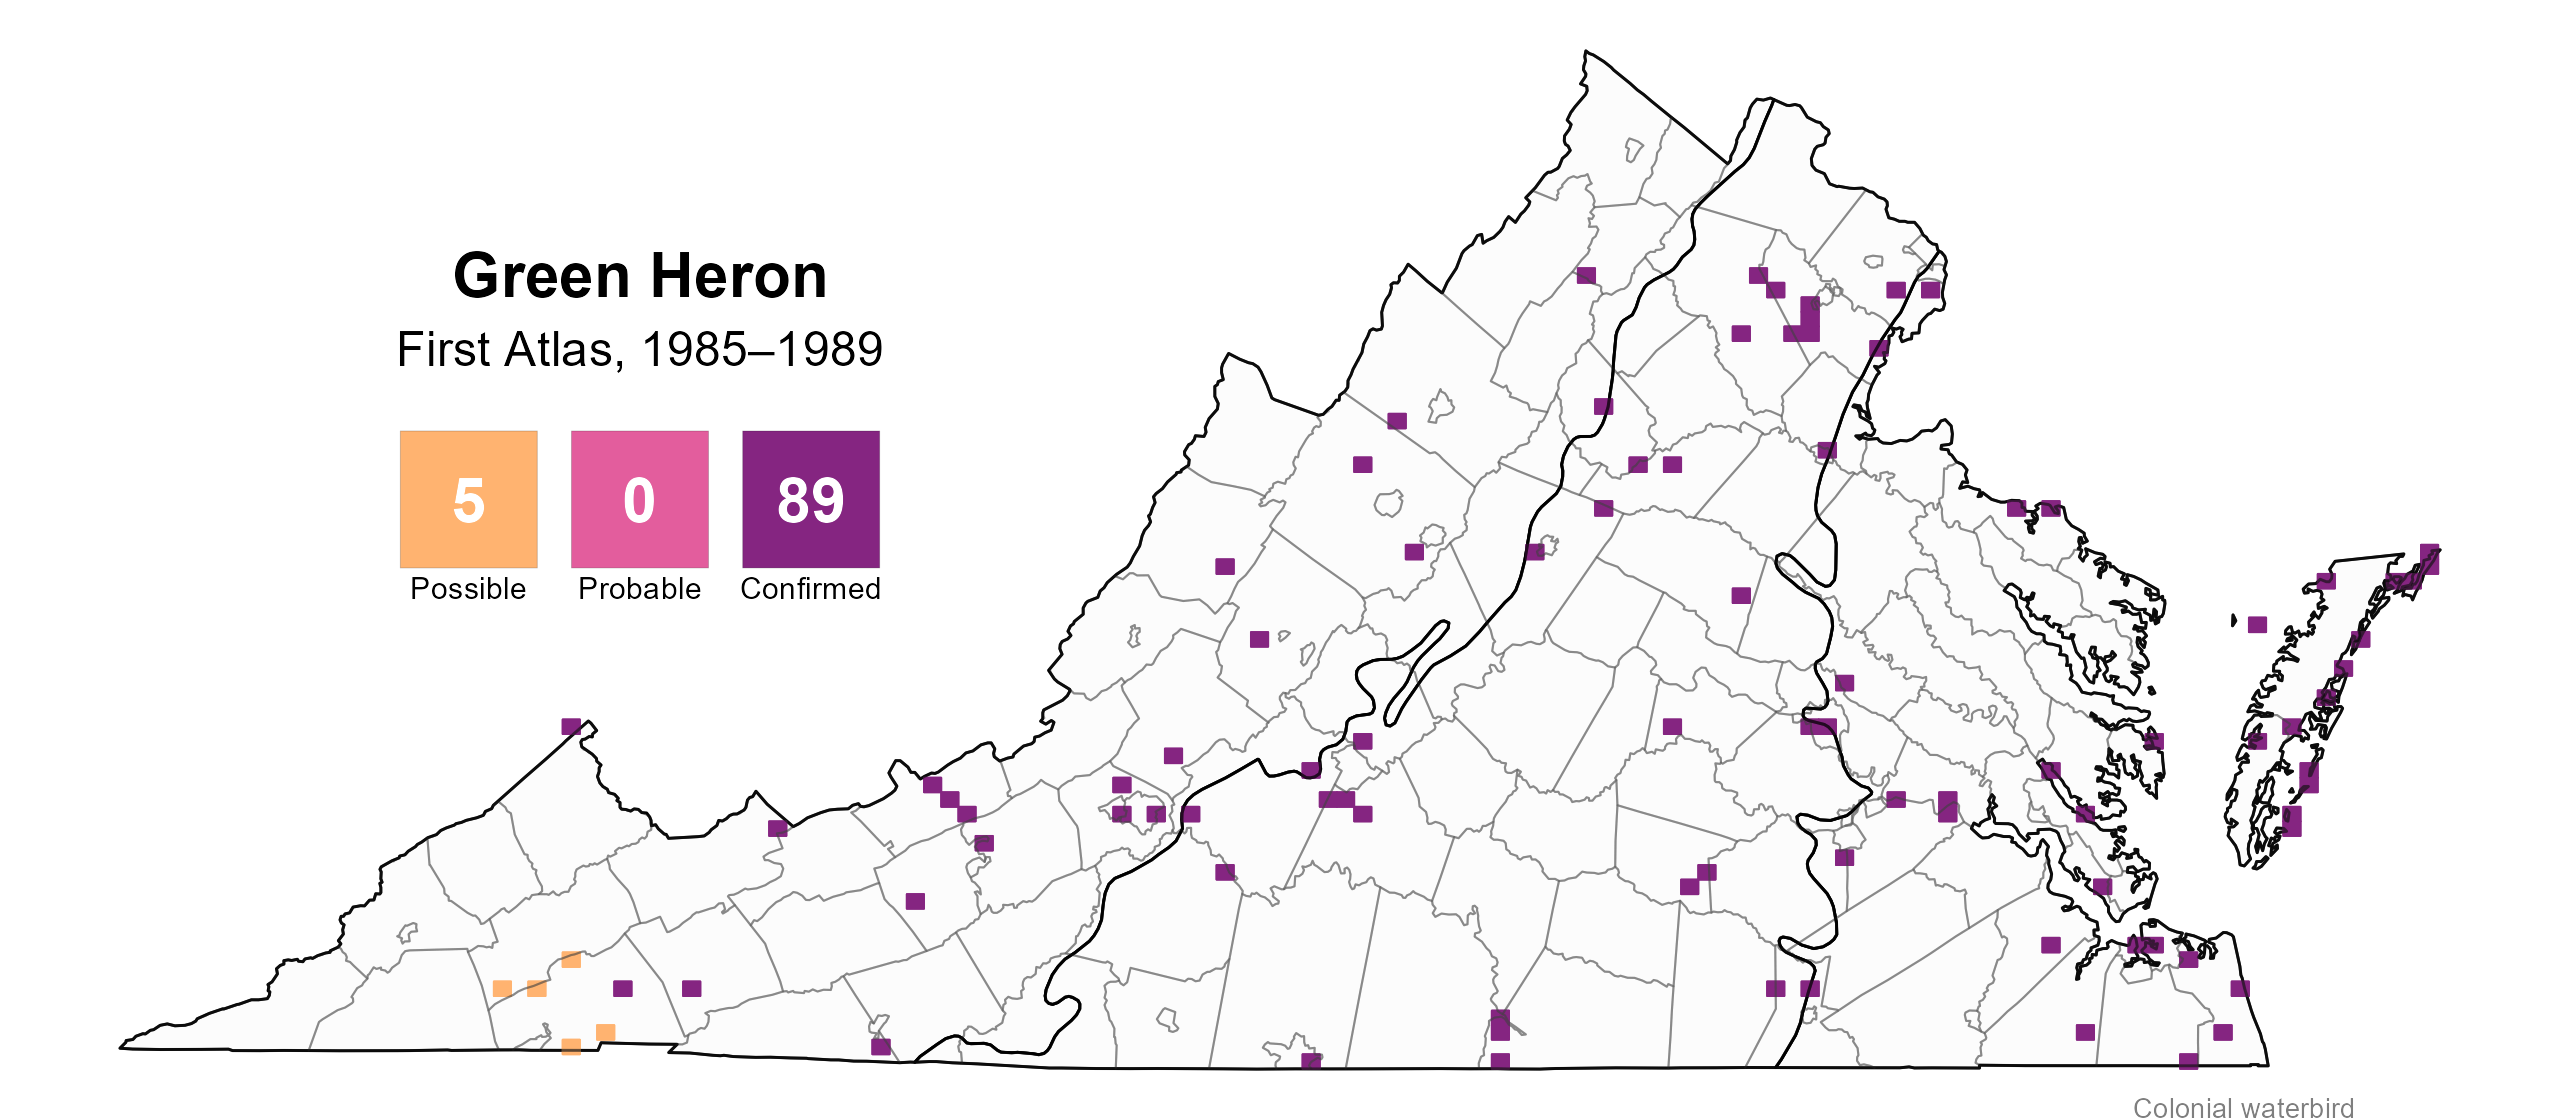
Figure 3: Green Heron breeding observations from the First Atlas (1985–1989). The colored boxes illustrate Atlas blocks (approximately 10 mi2 [26 km2] survey units) where the species was detected. The colors show the highest breeding category recorded in a block. The numbers within the colors in the legend correspond to the number of blocks with that breeding evidence category.
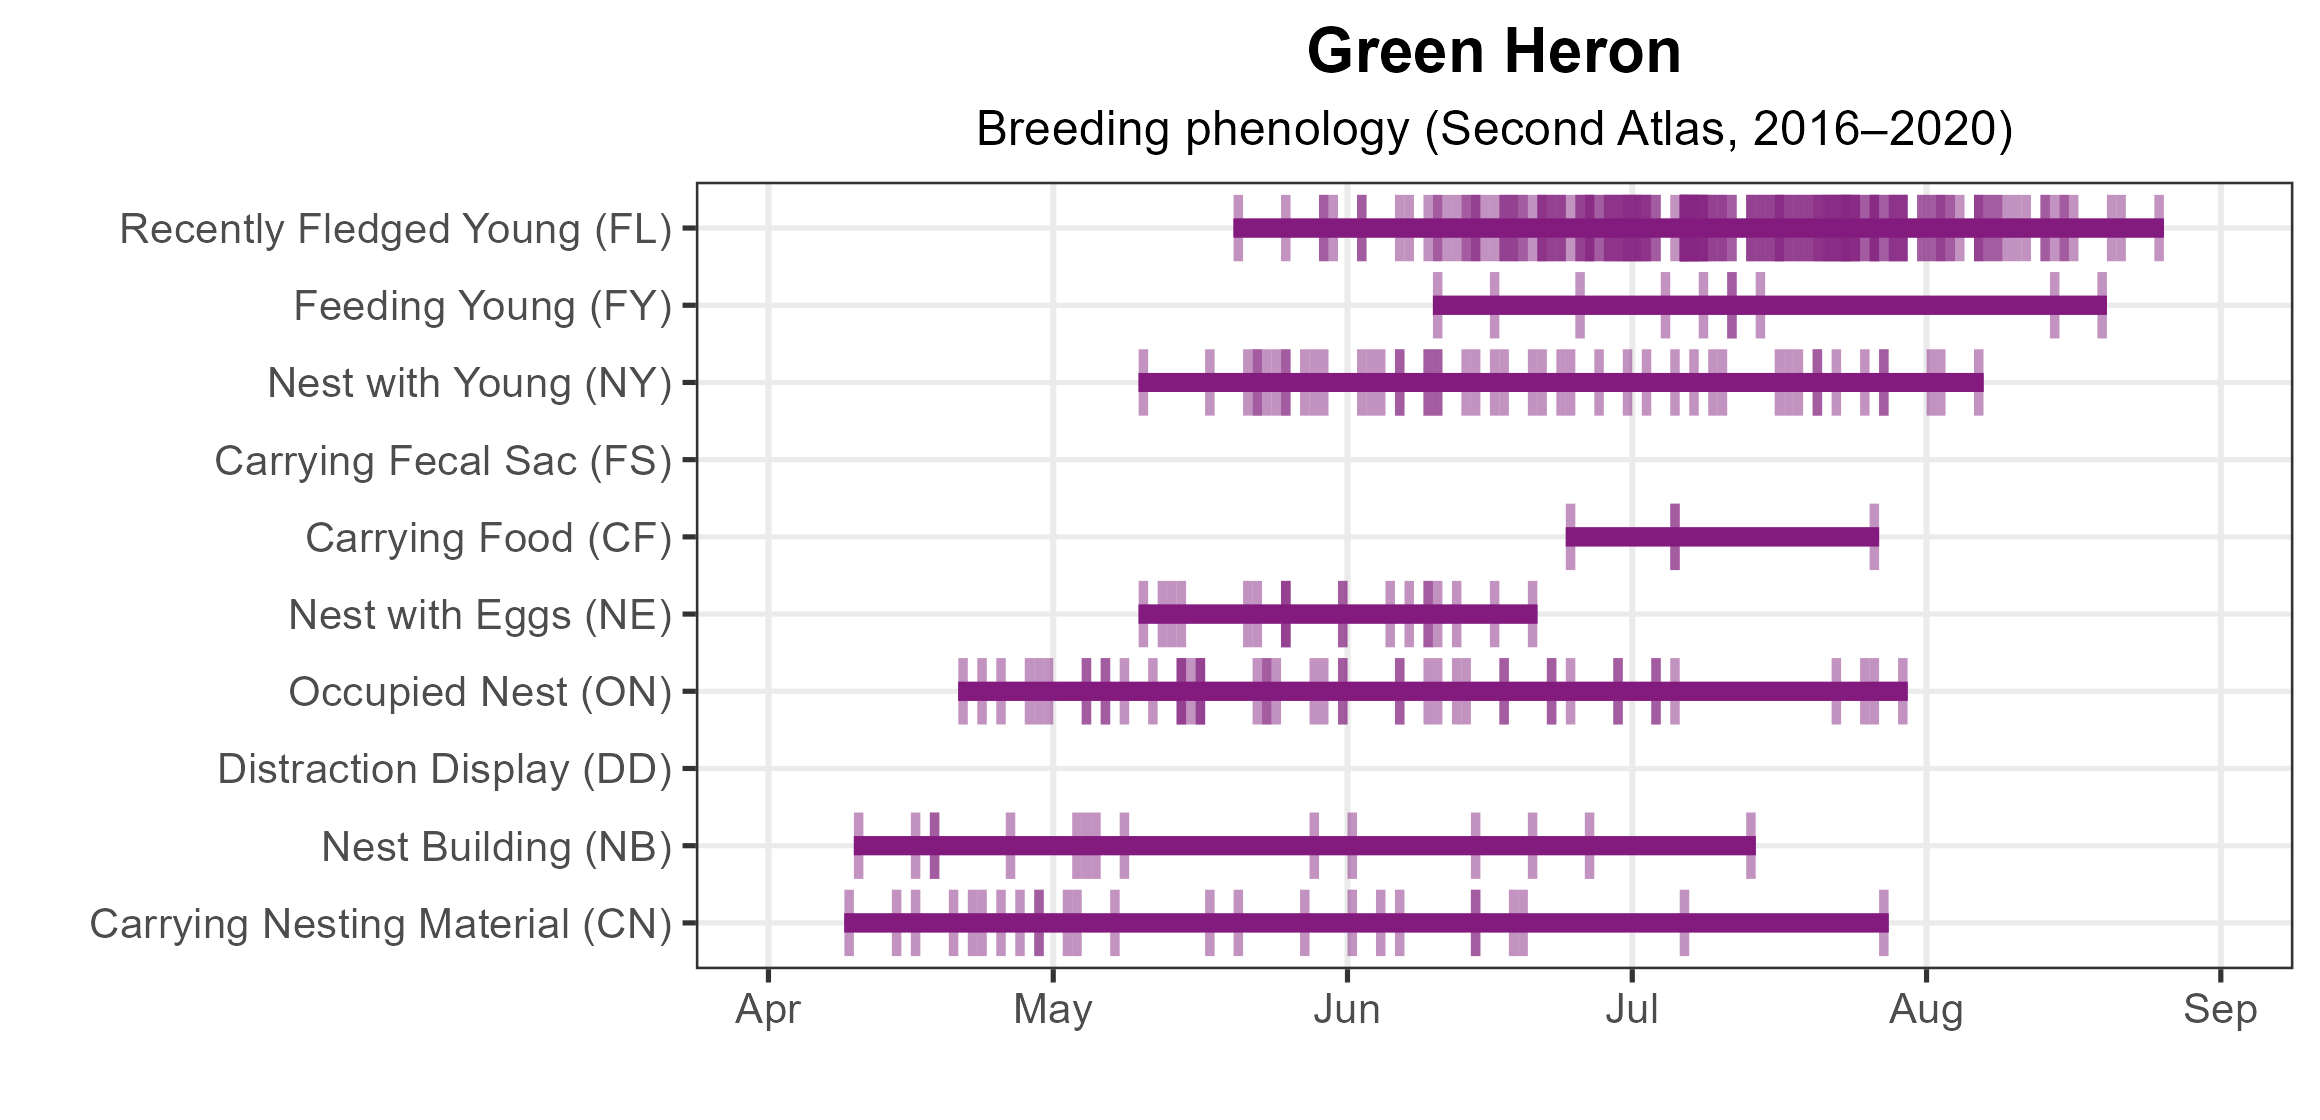
Figure 4: Green Heron phenology: confirmed breeding codes. This graph shows a timeline of confirmed breeding behaviors. Tick marks represent individual observations of the behavior.
Population Status
Green Herons have a wide distribution but occur at relatively low abundance levels. Their relative abundance was estimated to be high in the outer Coastal Plain but also locally high along inland rivers and in the Shenandoah Valley (Figure 5). They reached their highest predicted abundance in the Great Dismal Swamp and along waterways in the Hampton Roads region.
The total estimated Green Heron population in the state is approximately 20,000 individuals (with a range between 3,000 and 115,000). Multiple sources corroborate an ongoing, slow population decline in Virginia’s Green Herons. The North American Breeding Bird Survey (BBS) showed a significant annual population decrease of 1.54% per year from 1966–2022 in Virginia (Hostetler et al. 2023). Between the First and Second Atlas, BBS data showed a significant annual decline of 2.19% per year from 1987–2018 (Figure 6).
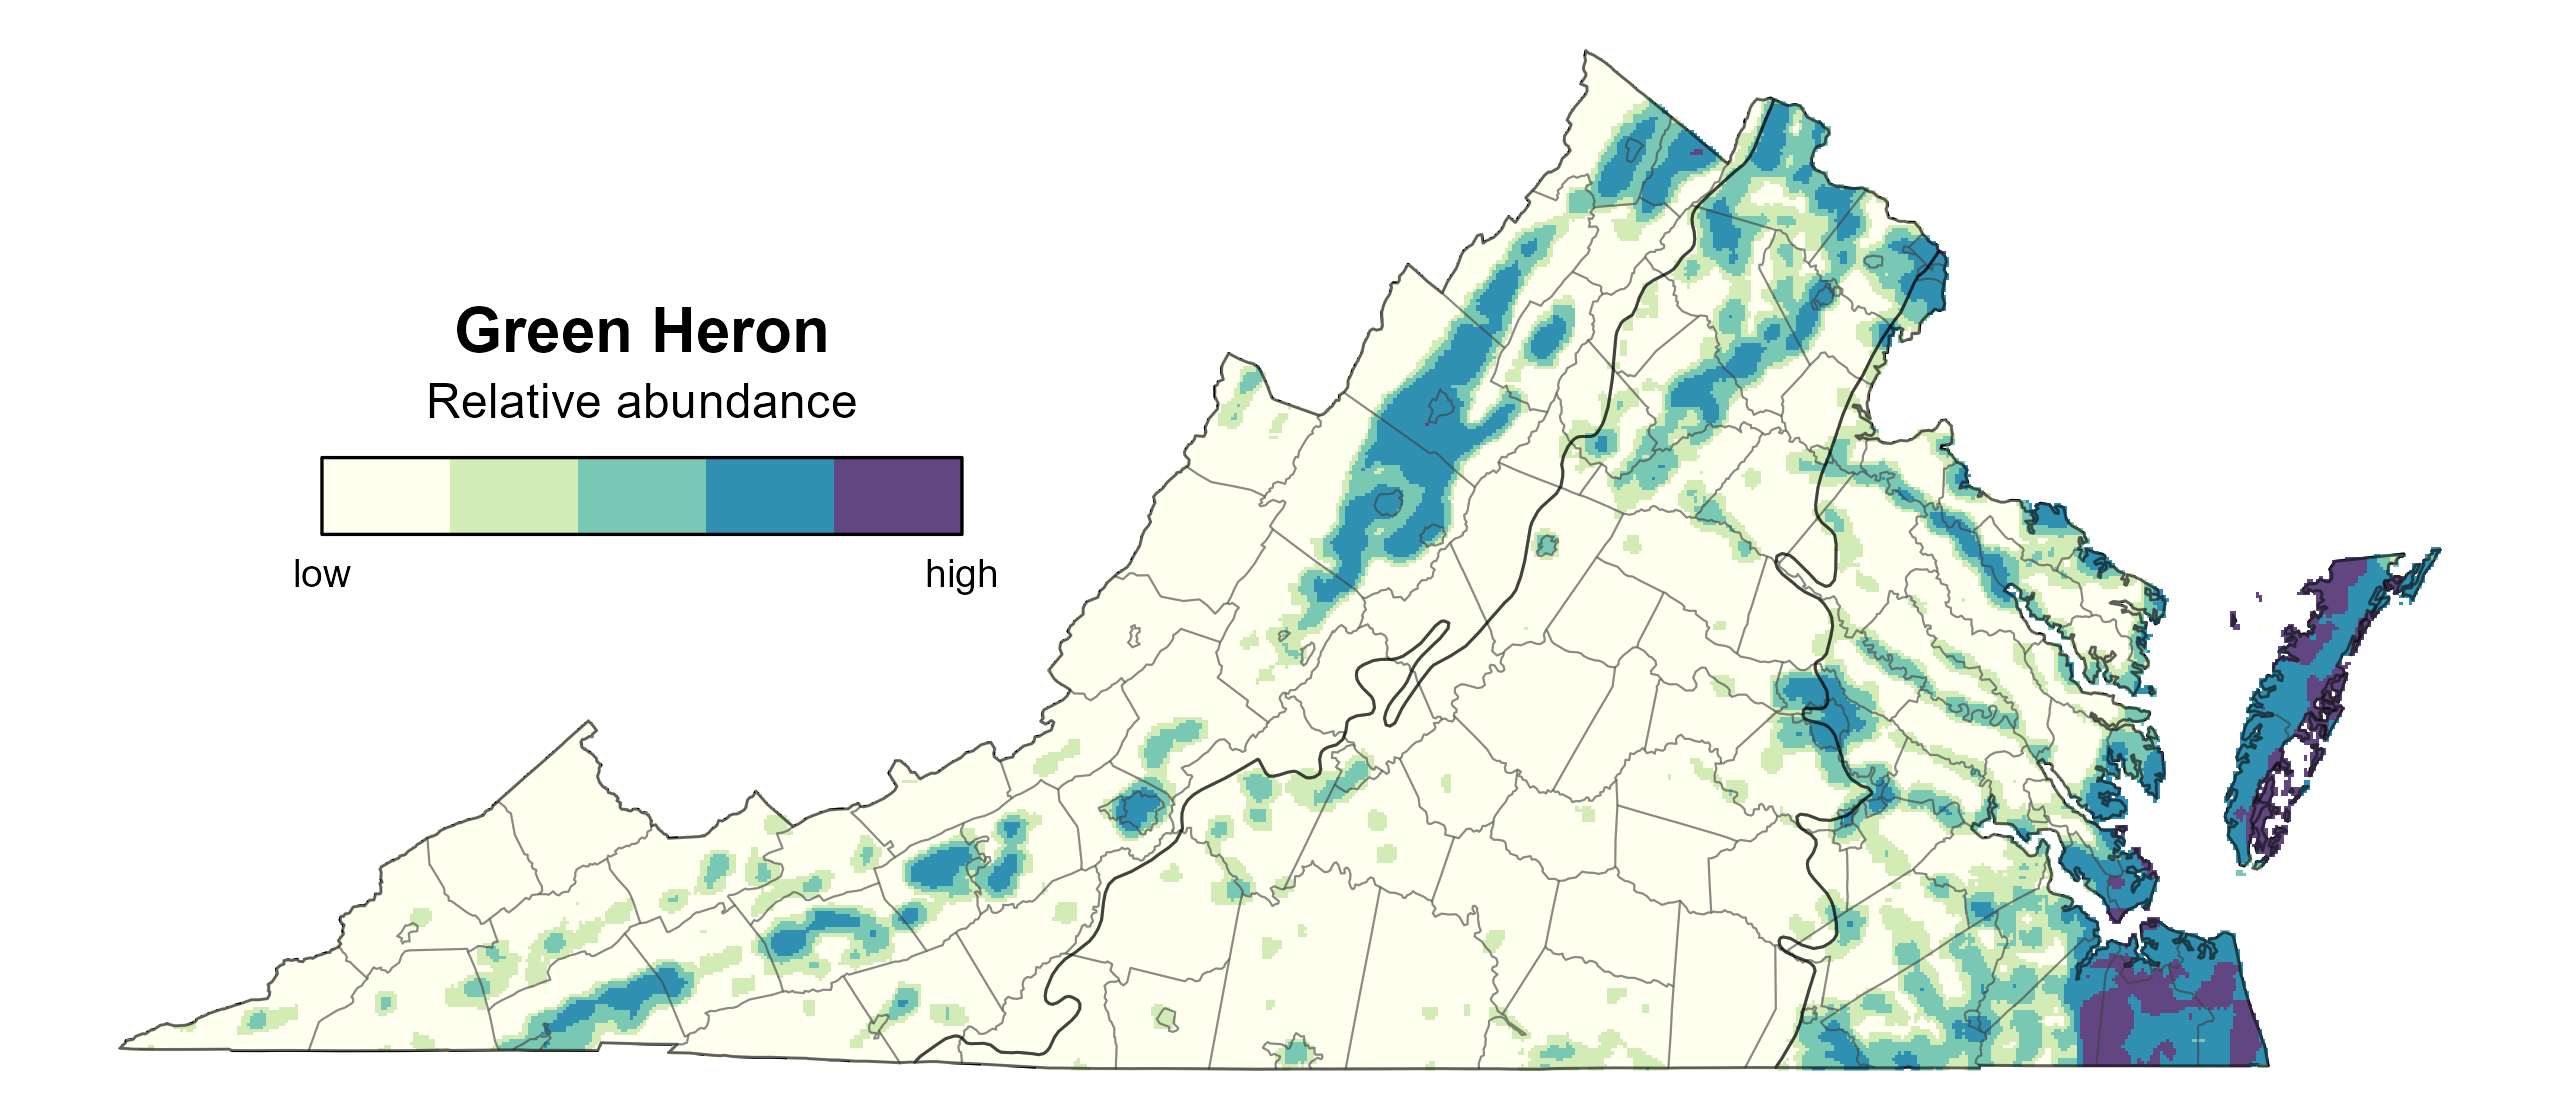
Figure 5: Green Heron relative abundance (Second Atlas, 2016–2020). This map indicates the predicted abundance of this species at a 0.4 mi2 (1 km2) scale based on environmental (including habitat) factors. Abundance values are presented on a relative scale of low to high.
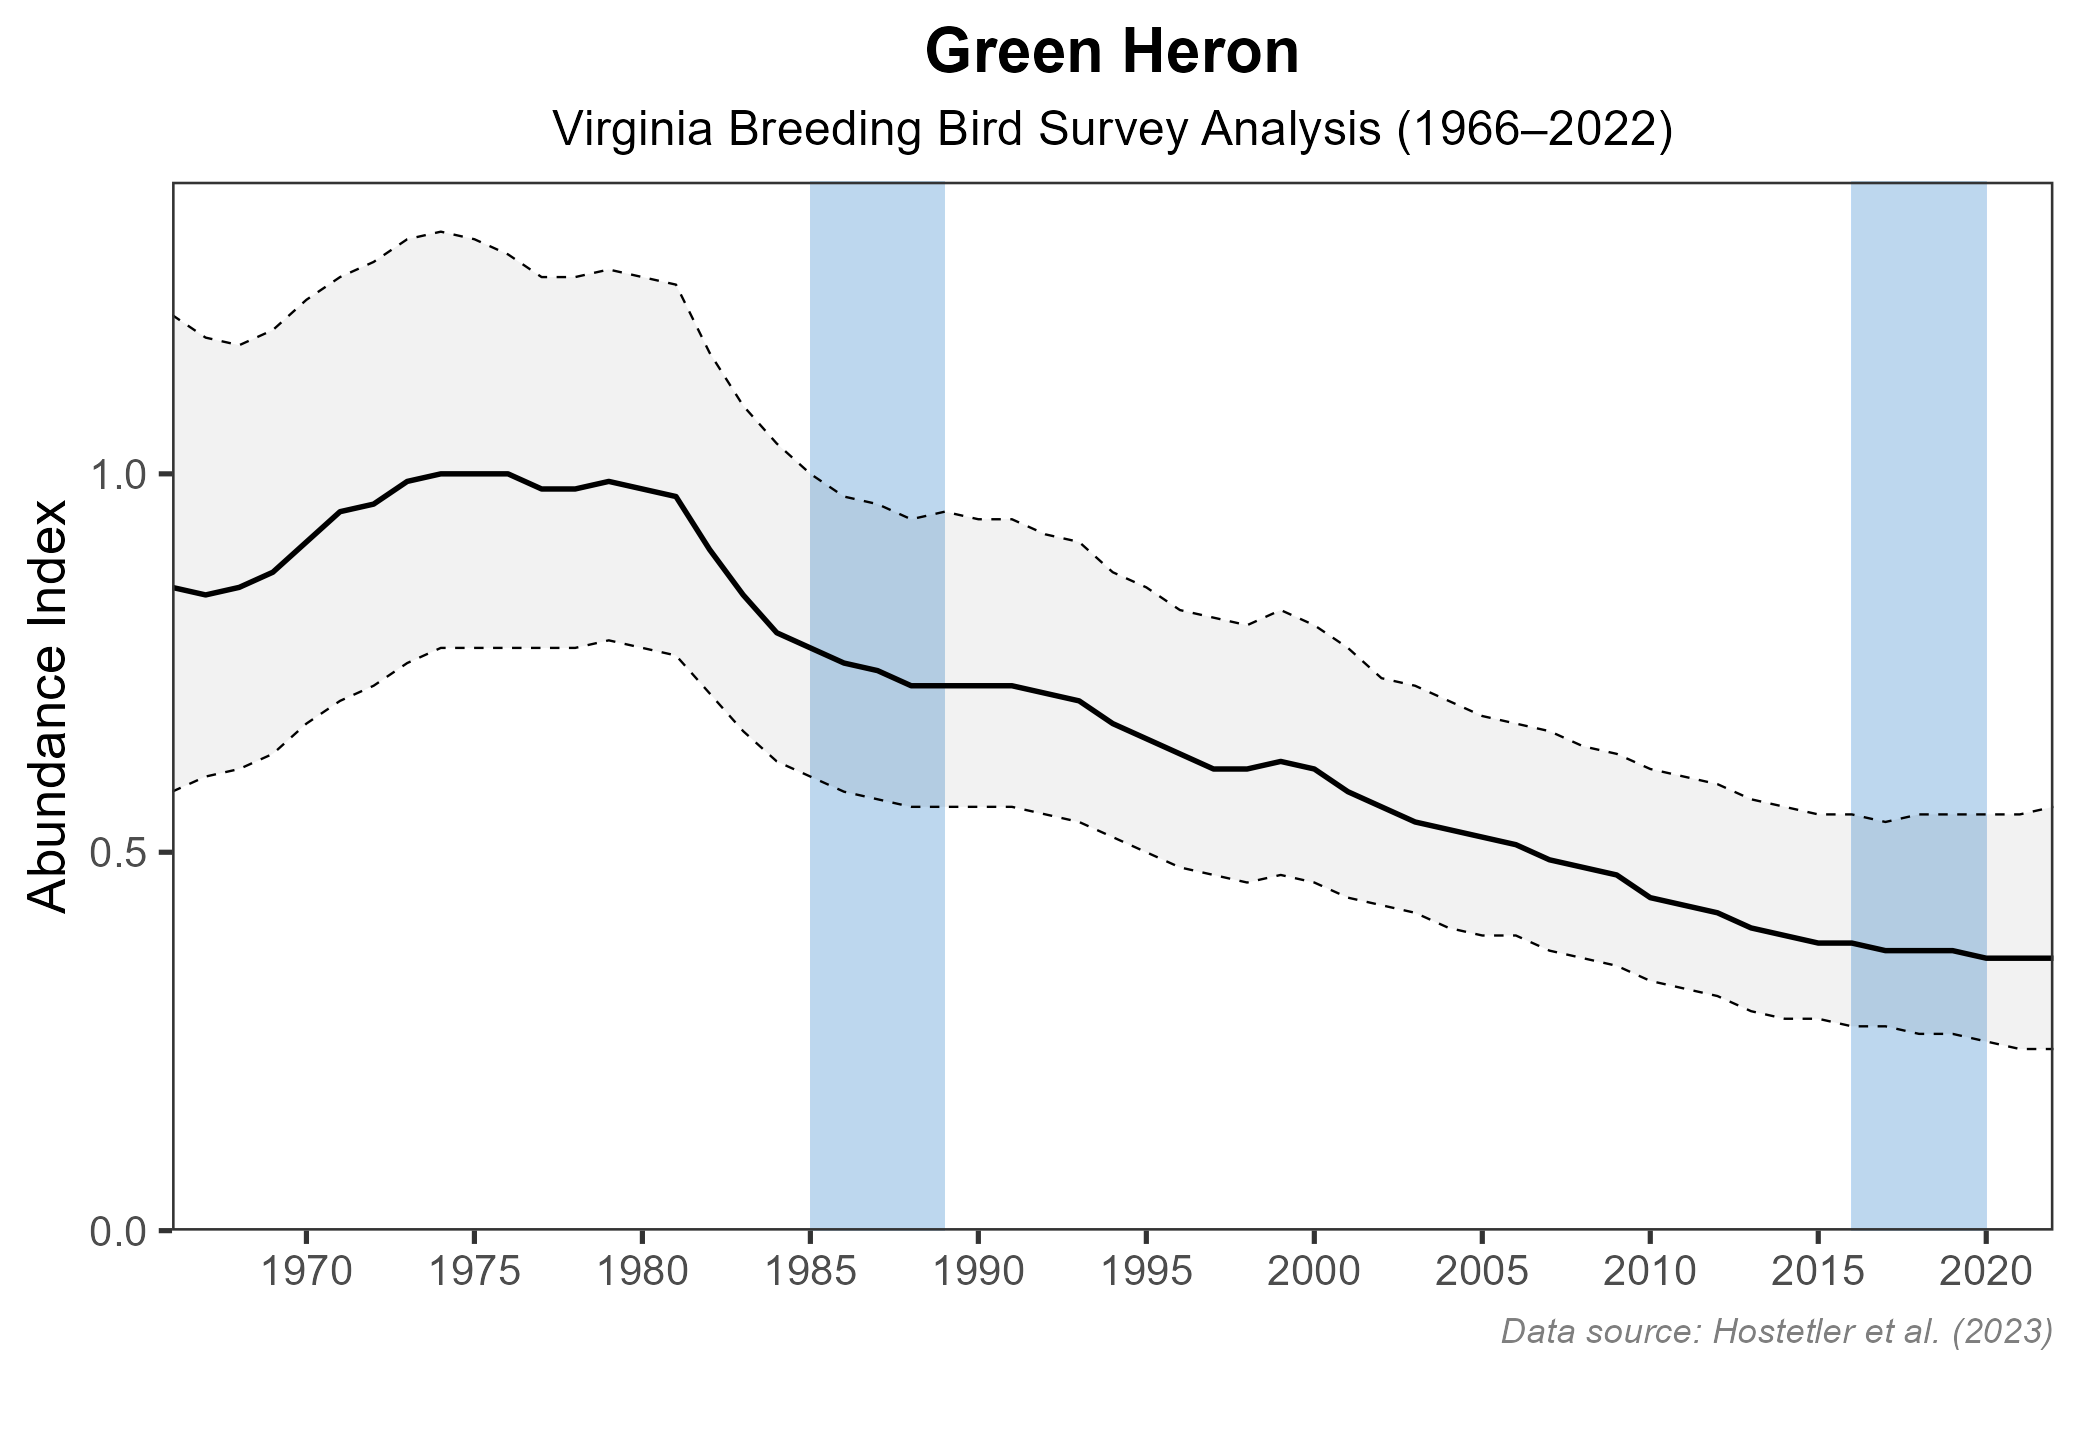
Figure 6: Green Heron population trend for Virginia as estimated by the North American Breeding Bird Survey. The vertical axis shows species abundance; the horizontal axis shows the year. The solid line indicates the estimated population trend; there is a 97.5% probability that the true population trend falls between the dashed lines. The shaded bars indicate the First and Second Atlas periods.
Conservation
Green Herons have experienced substantial declines in parts of Virginia, especially in the Coastal Plain region. Nearly half of the known coastal population nests in urban areas, and they can occur in wetlands of all kinds and sizes, from golf courses to wildlife refuges to reservoirs. Identifying and protecting these habitats are important to their conservation. Protection and management of coastal rookeries with many species may incidentally have benefits for Green Herons, even when they are only on the outskirts of these colonies. Equally important is the need to improve and expand survey efforts through citizen science and outreach campaigns. Green Herons also are designated a Tier II Species of Greatest Conservation Need (Very High Conservation Need) in the 2025 Virginia Wildlife Action Plan (VDWR 2025).
Interactive Map
The interactive map contains up to six Atlas layers (probability of occurrence for the First and Second Atlases, change in probability of occurrence between Atlases, breeding evidence for the First and Second Atlases, and abundance for the Second Atlas) that can be viewed one at a time. To view an Atlas map layer, mouse over the layer box in the upper left. County lines and physiographic regional boundaries (Mountains and Valleys, Piedmont, and Coastal Plain) can be turned on and off by checking or unchecking the box below the layer box. Within the map window, users can hover on a block to see its value for each layer and pan and zoom to see roads, towns, and other features of interest that are visible beneath a selected layer.
View Interactive Map in Full Screen
References
Davis, W. E., Jr., and J. A. Kushlan (2020). Green Heron (Butorides virescens), version 1.0. In Birds of the World (A. F. Poole and F. B. Gill, Editors). Cornell Lab of Ornithology, Ithaca, NY, USA. https://doi.org/10.2173/bow.grnher.01.
Hostetler, J. A., J. R. Sauer, J. E. Hines, D. Ziolkowski, and M. Lutmerding (2023). The North American breeding bird survey, analysis results 1966–2022. U.S. Geological Survey, Laurel, MD, USA. https://doi.org/10.5066/P9SC7T11.
Monroe, B. L., Jr., R. C. Banks, J. W. Fitzpatrick, T. R. Howell, N. K. Johnson, H. Ouellet, and R. W. Storer (1993). Thirty-ninth supplement to the American Ornithologists’ Union check-list of North American birds. The Auk 110:675–682.
Rottenborn, S. C., and E. S. Brinkley (Editors) (2007). Virginia’s birdlife: An annotated checklist. 4th edition. Virginia Society of Ornithology.
Virginia Department of Wildlife Resources (VDWR). 2025. Virginia wildlife action plan. Virginia Department of Wildlife Resources, Henrico, VA, USA. 506 pp.