Introduction
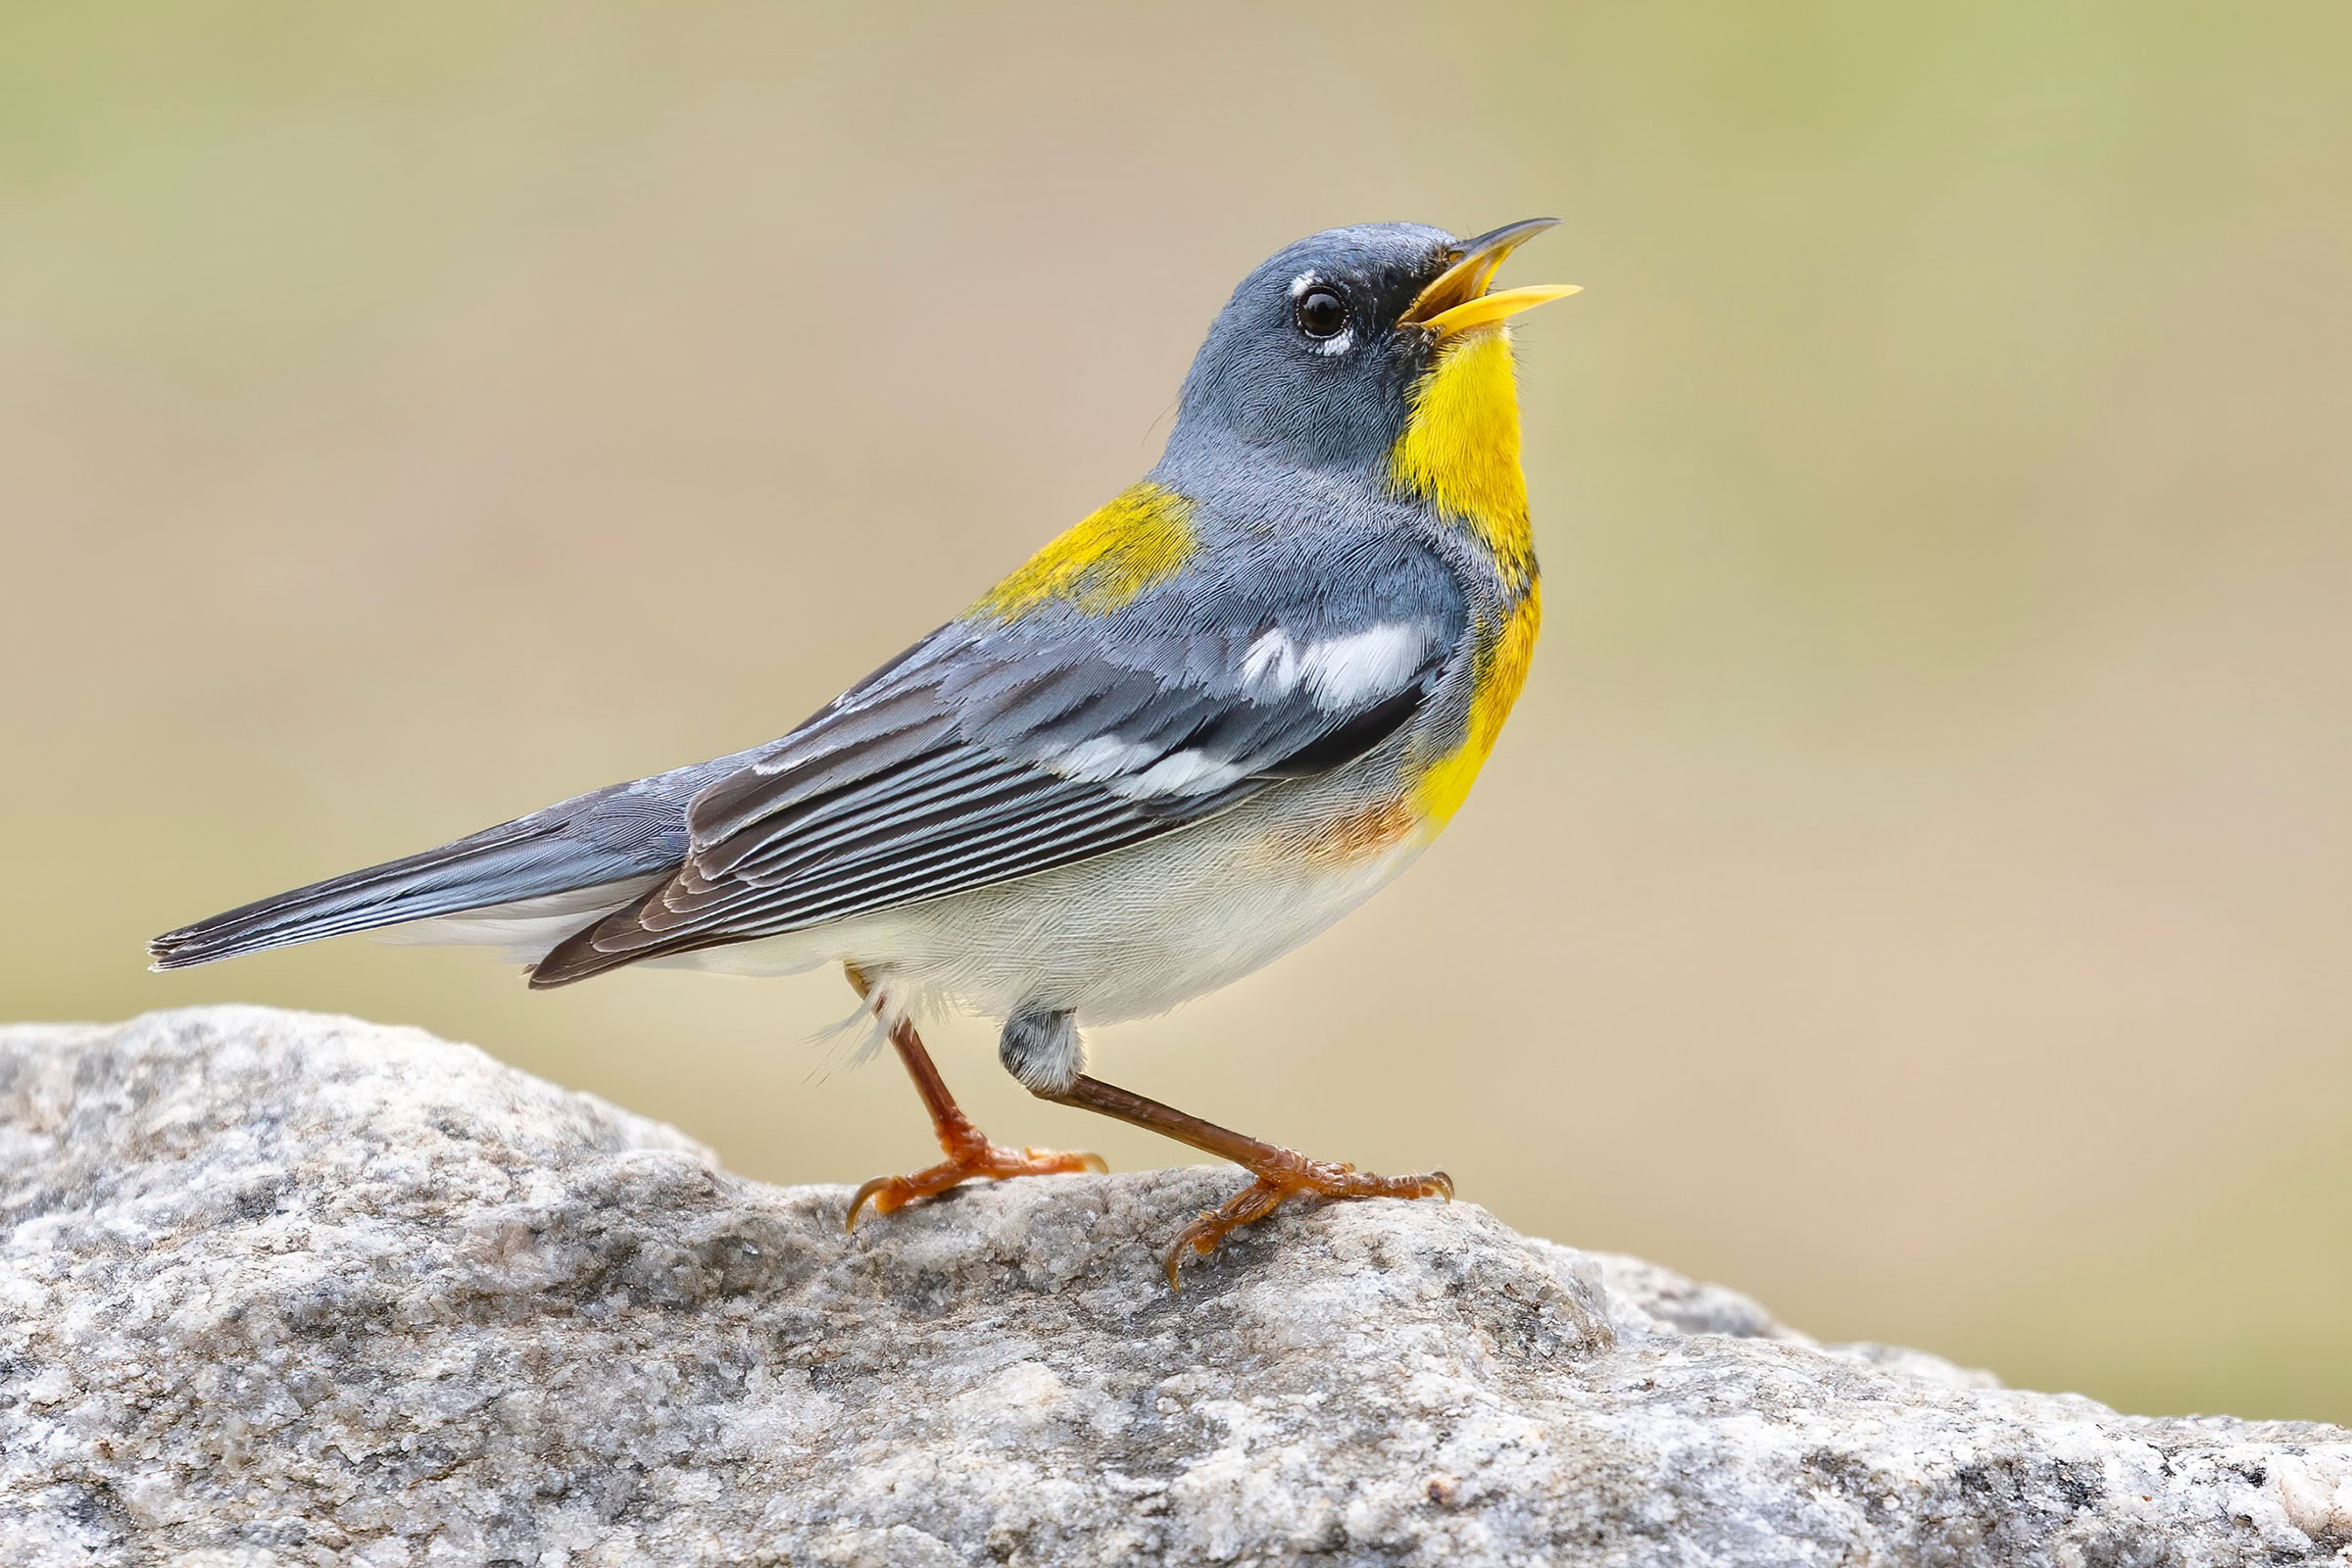
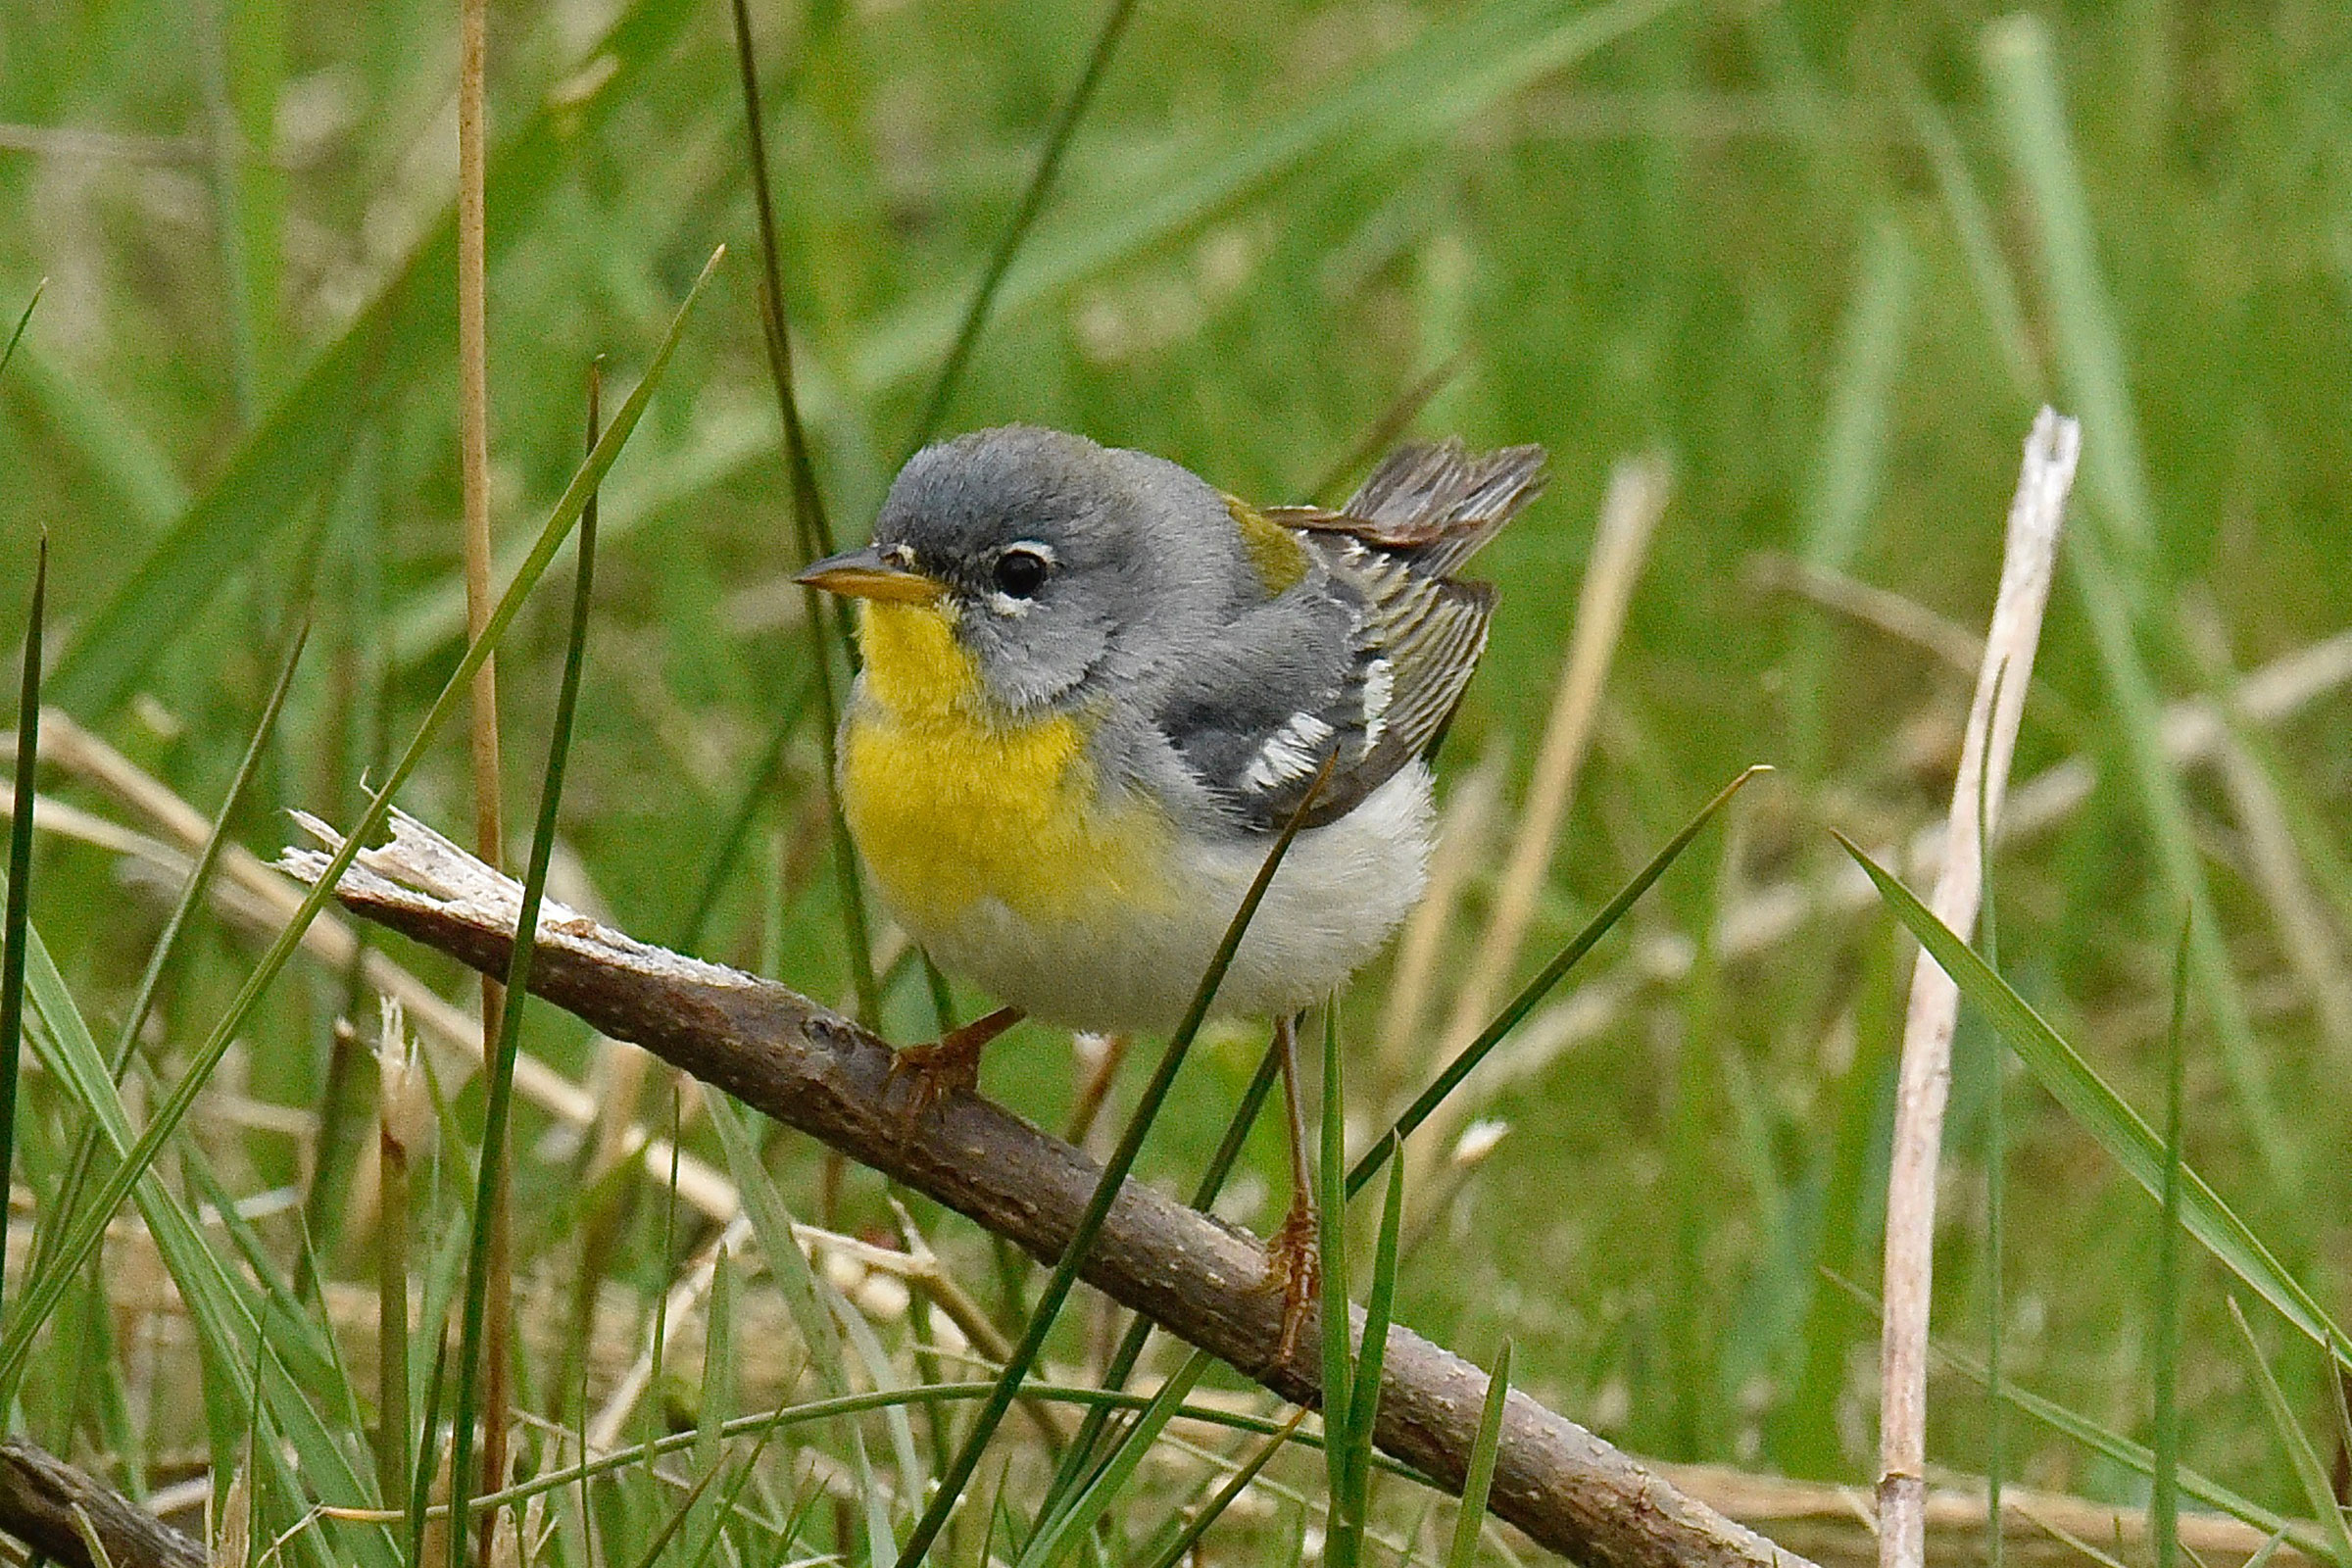
Each April, the Northern Parula’s exuberant song – a buzz rising to a petite explosion – is a sure sign that migration is well under way and that the breeding season has begun. The Northern Parula is one of Virginia’s most common warblers, but its behavior often makes it difficult to see. It nests as high as 100 ft (30 m) in deciduous trees, often tucking their nests into a clump of moss or lichens. Additionally, it typically selects forest patches along streams, swamps, and other bottomlands (Moldenhauer and Regelski 2020).
Breeding Distribution
North Parulas are found throughout Virginia, but they are most likely to occur in the central and southern Piedmont region, inland portions of the Coastal Plain region, and the southwestern corner of the Mountains and Valley region (Figure 1). Their likelihood of occurring is positively associated with forest cover and forest edge habitats, while they are less likely to occur in the agricultural valleys of the Mountains and Valleys region and the more developed areas in Hampton Roads-Virginia Beach, Northern Virginia, and Richmond.
Between the First and Second Atlases (Figures 1 and 2), the change in the likelihood of Northern Parula occurrence remained constant across most of the state (Figure 3). However, there were areas of decrease near highly developed areas, such in Northern Virginia and Richmond, which may have been due to forest loss from increased human development.
View Environmental Associations

Figure 1: Northern Parula breeding distribution based on probability of occurrence (Second Atlas, 2016–2020). This map indicates the probability that this species will occur in an Atlas block (an approximately 10 mi2 [26 km2] survey unit) based on environmental (including habitat) factors and after adjusting for the probability of detection (variation in survey effort among blocks).
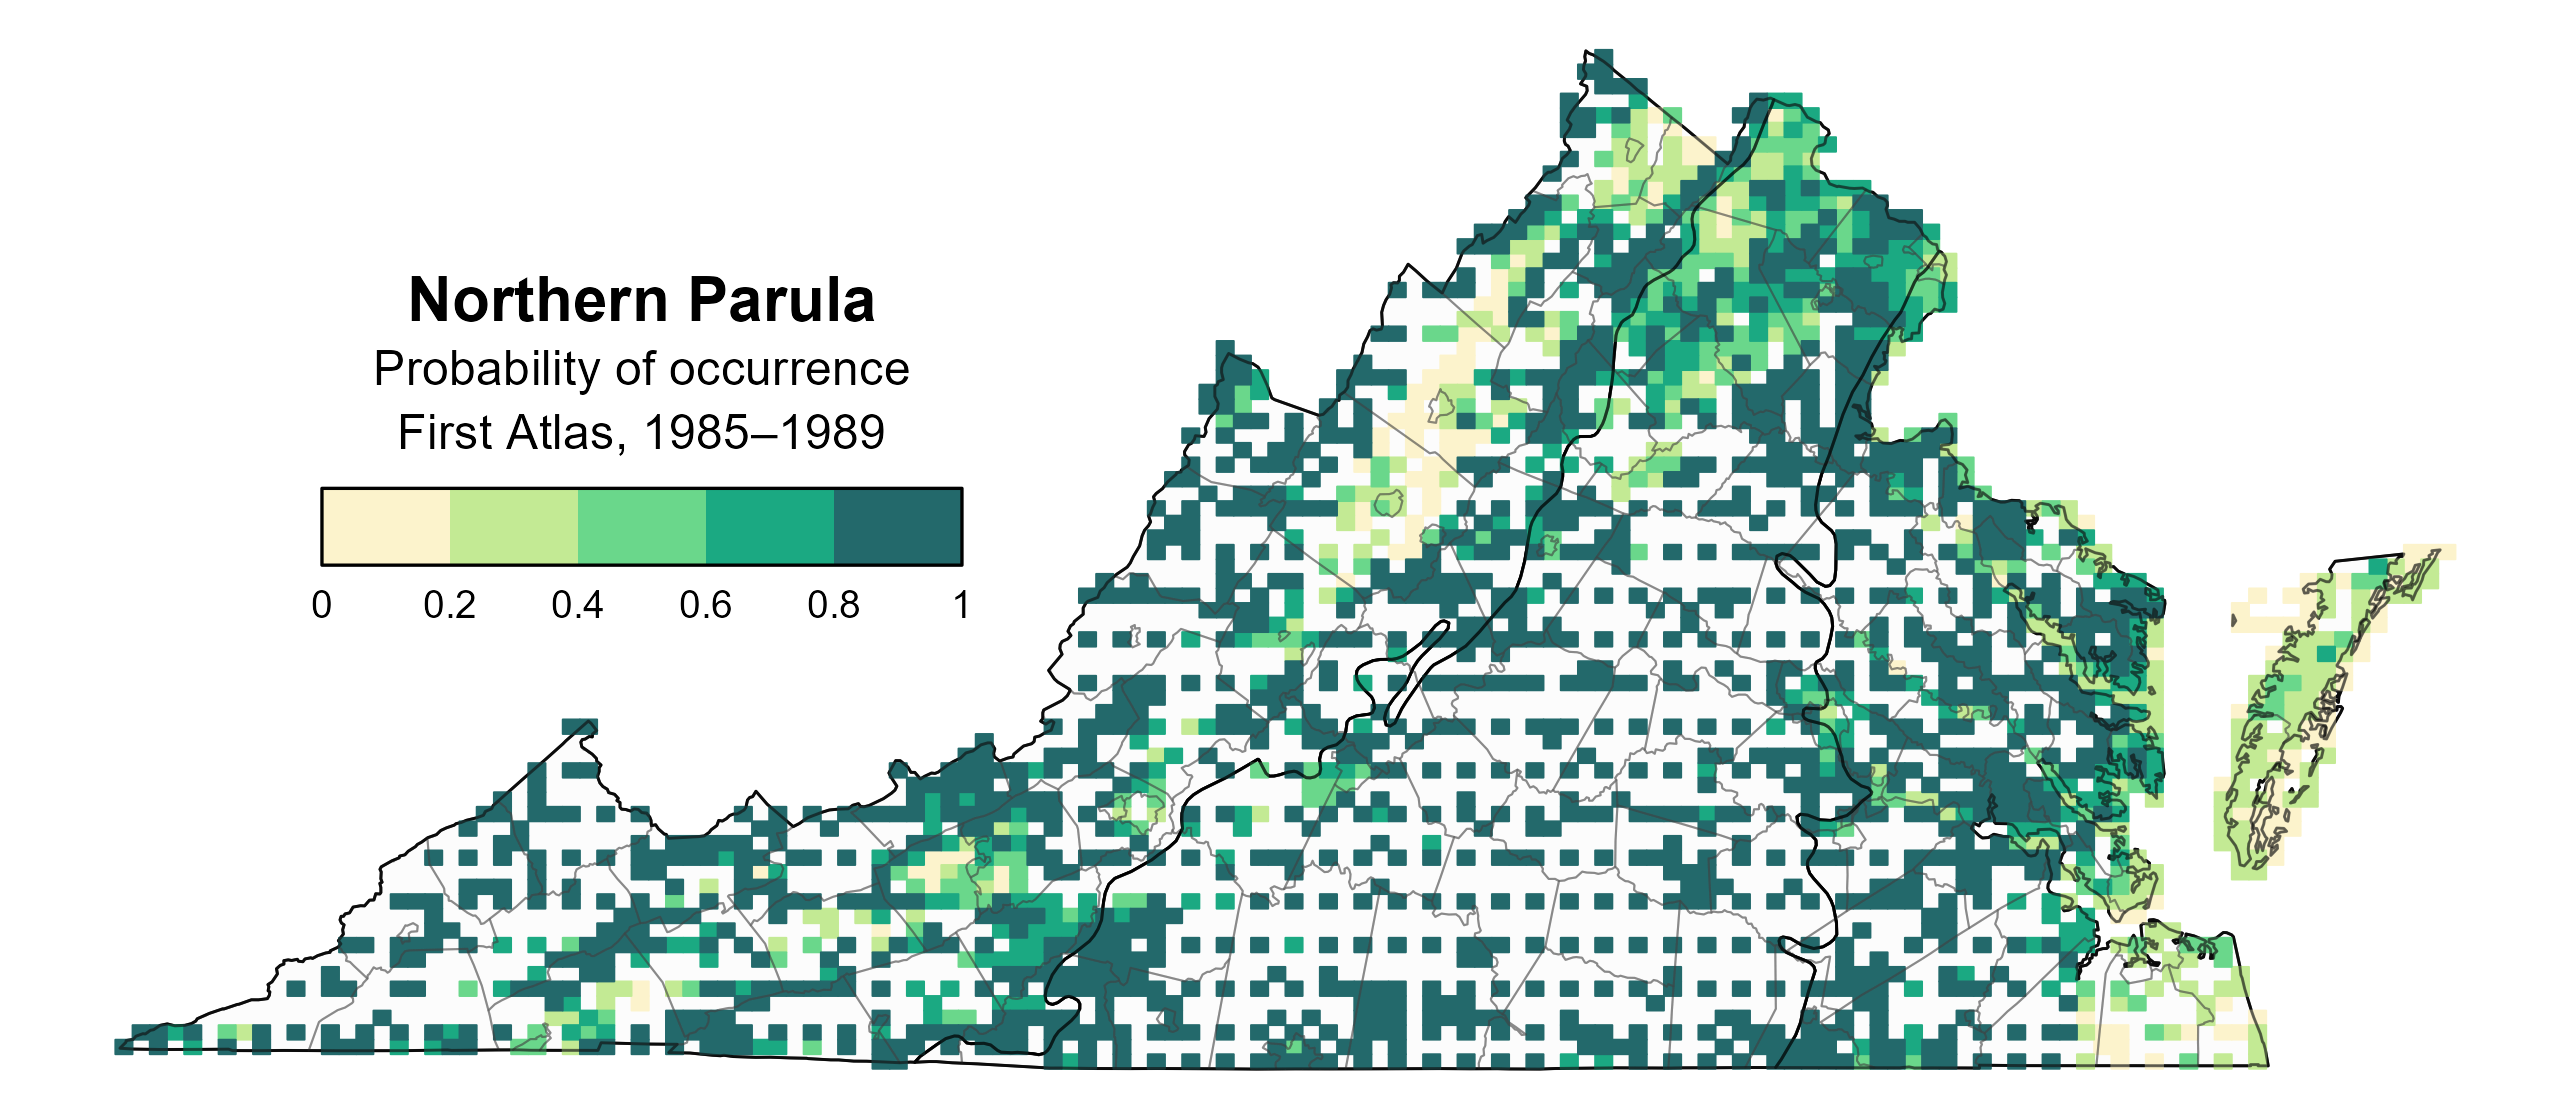
Figure 2: Northern Parula breeding distribution based on probability of occurrence (First Atlas, 1985–1989). This map indicates the probability that this species will occur in an Atlas block (an approximately 10 mi2 [26 km2] survey unit) based on environmental (including habitat) factors and after adjusting for the probability of detection (variation in survey effort among blocks). Blocks in white were not surveyed during the First Atlas and were not modeled.
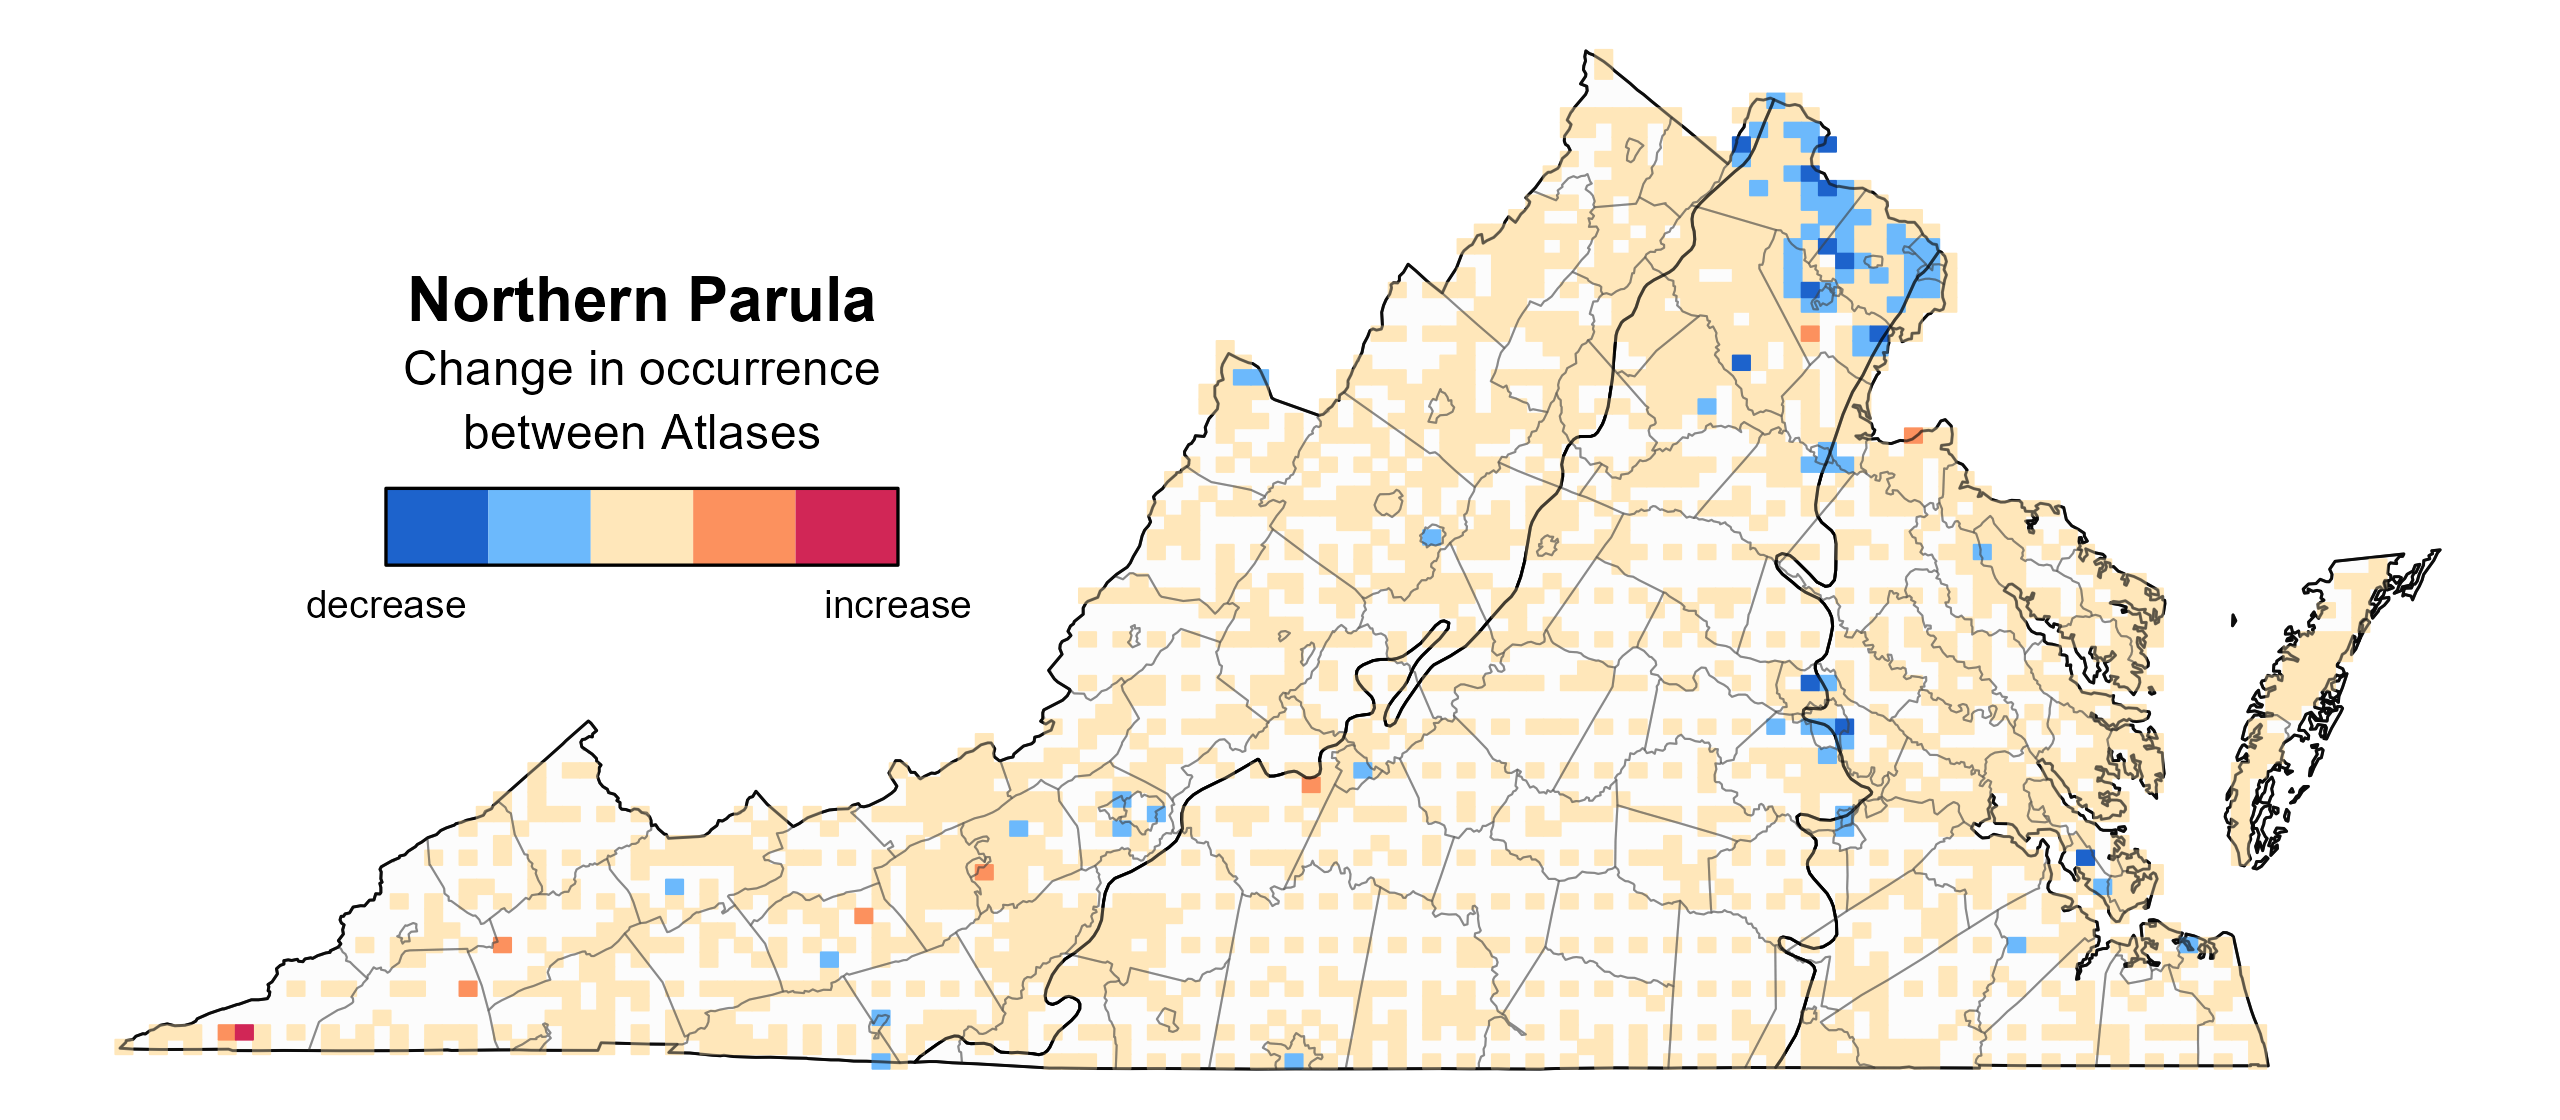
Figure 3: Northern Parula change in breeding distribution between Atlases (1985–1989 and 2016–2020) based on probability of occurrence. This map indicates the change in the probability that this species will occur in a block (an approximately 10 mi2 [26 km2] survey unit) between Atlas periods. Blocks with no change may have constant presence or constant absence. Blocks in white were not surveyed during the First Atlas and were not modeled.
Breeding Evidence
Northern Parulas were confirmed breeders in 81 blocks and 50 counties and found to be probable breeders in an additional 42 counties (Figure 4). In addition, breeding observations were recorded across the state relatively evenly, except in agricultural valleys in the Mountains and Valleys region. Breeding observations were also recorded in all regions of the state during the First Atlas (Figure 5).
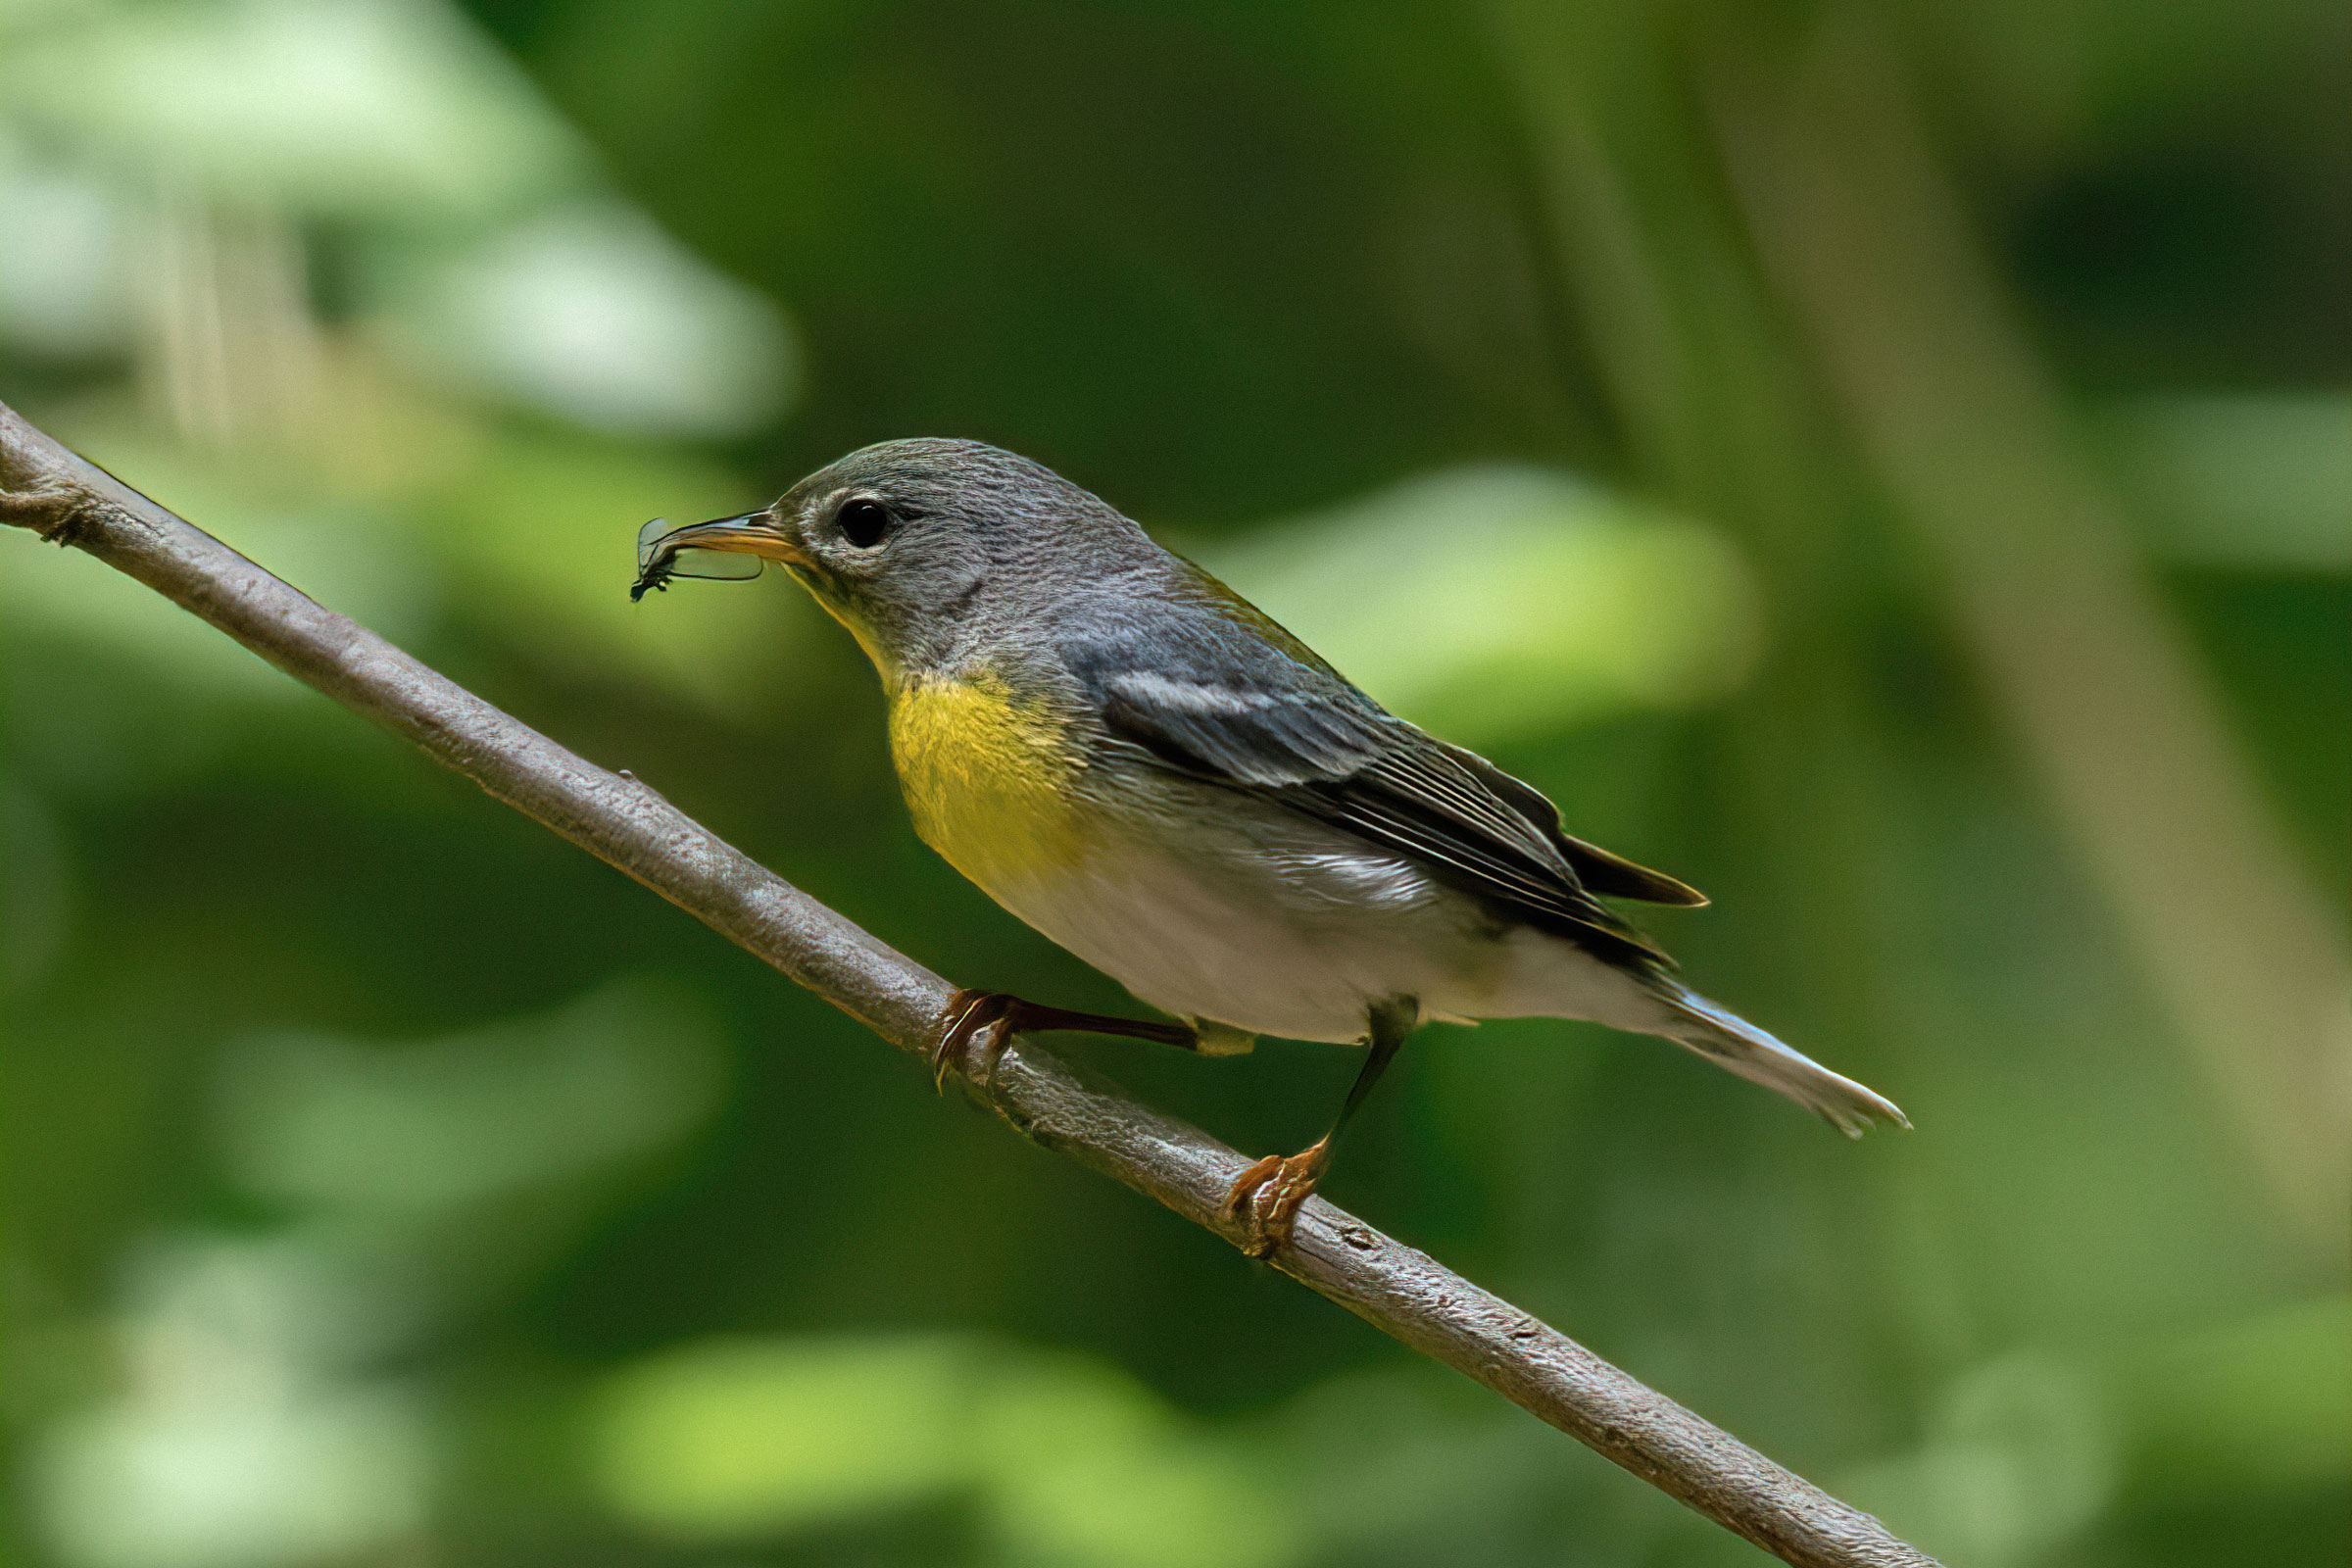
Breeding started in mid-April when adults carrying nesting material (April 22) and nest building (April 24) were recorded (Figure 6). However, breeding was confirmed primarily through observations of adults carrying food (May 23 – July 11), recently fledged young (June 12 – August 10), and adults feeding young (June 22 – July 21). Although difficult to observe, one occupied nest was recorded on July 11 (Figure 6).
For more general information on the breeding habits of this species, please refer to All About Birds.
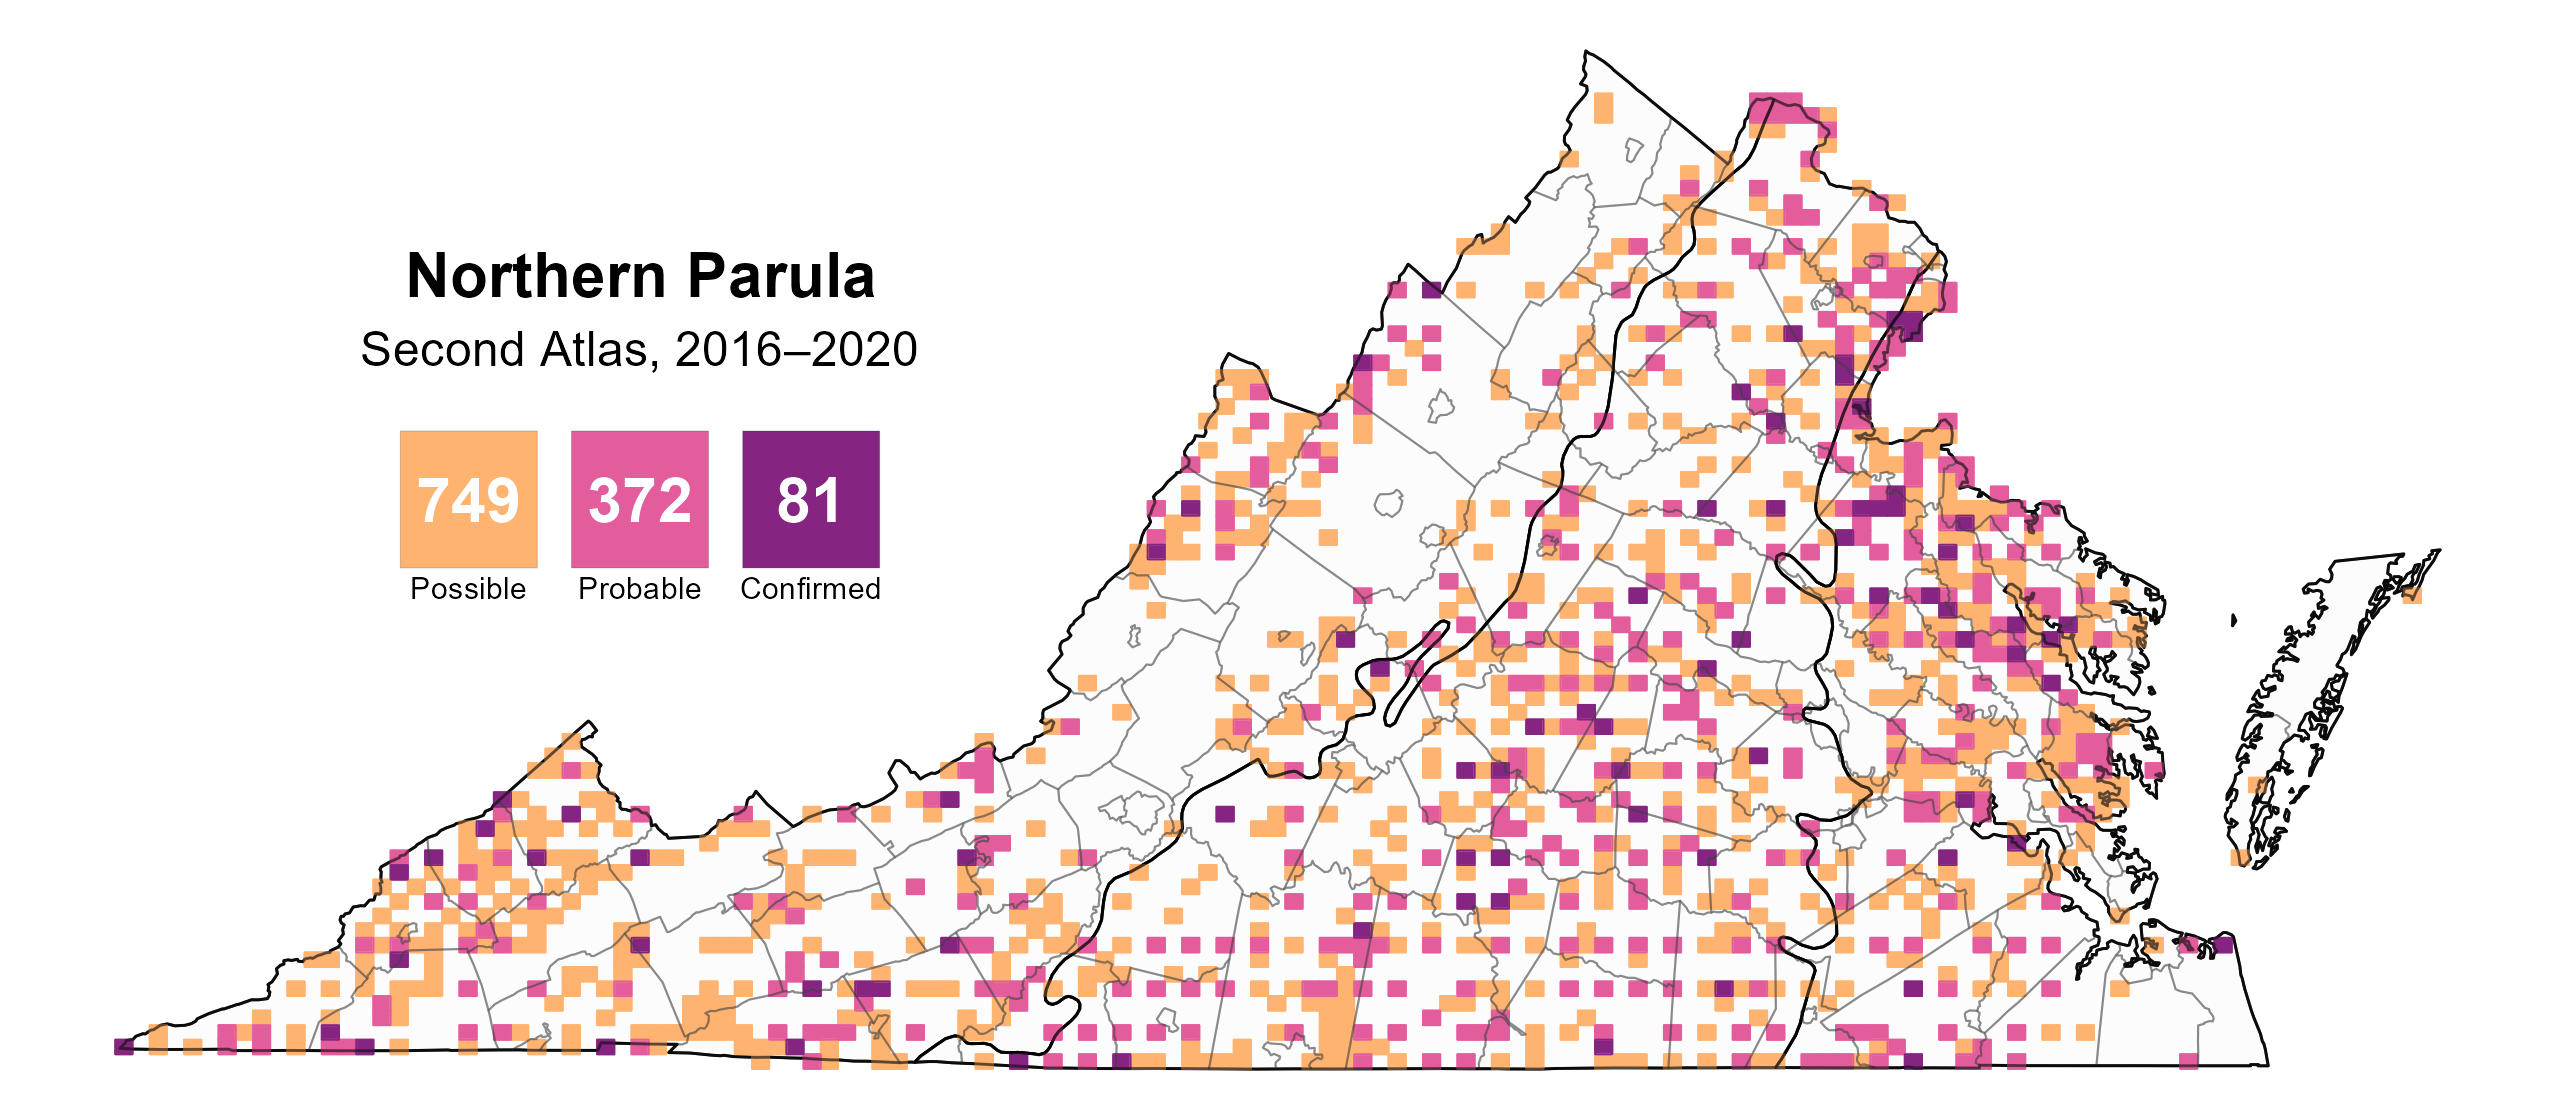
Figure 4: Northern Parula breeding observations from the Second Atlas (2016–2020). The colored boxes illustrate Atlas blocks (approximately 10 mi2 [26 km2] survey units) where the species was detected. The colors show the highest breeding category recorded in a block. The numbers within the colors in the legend correspond to the number of blocks with that breeding evidence category.
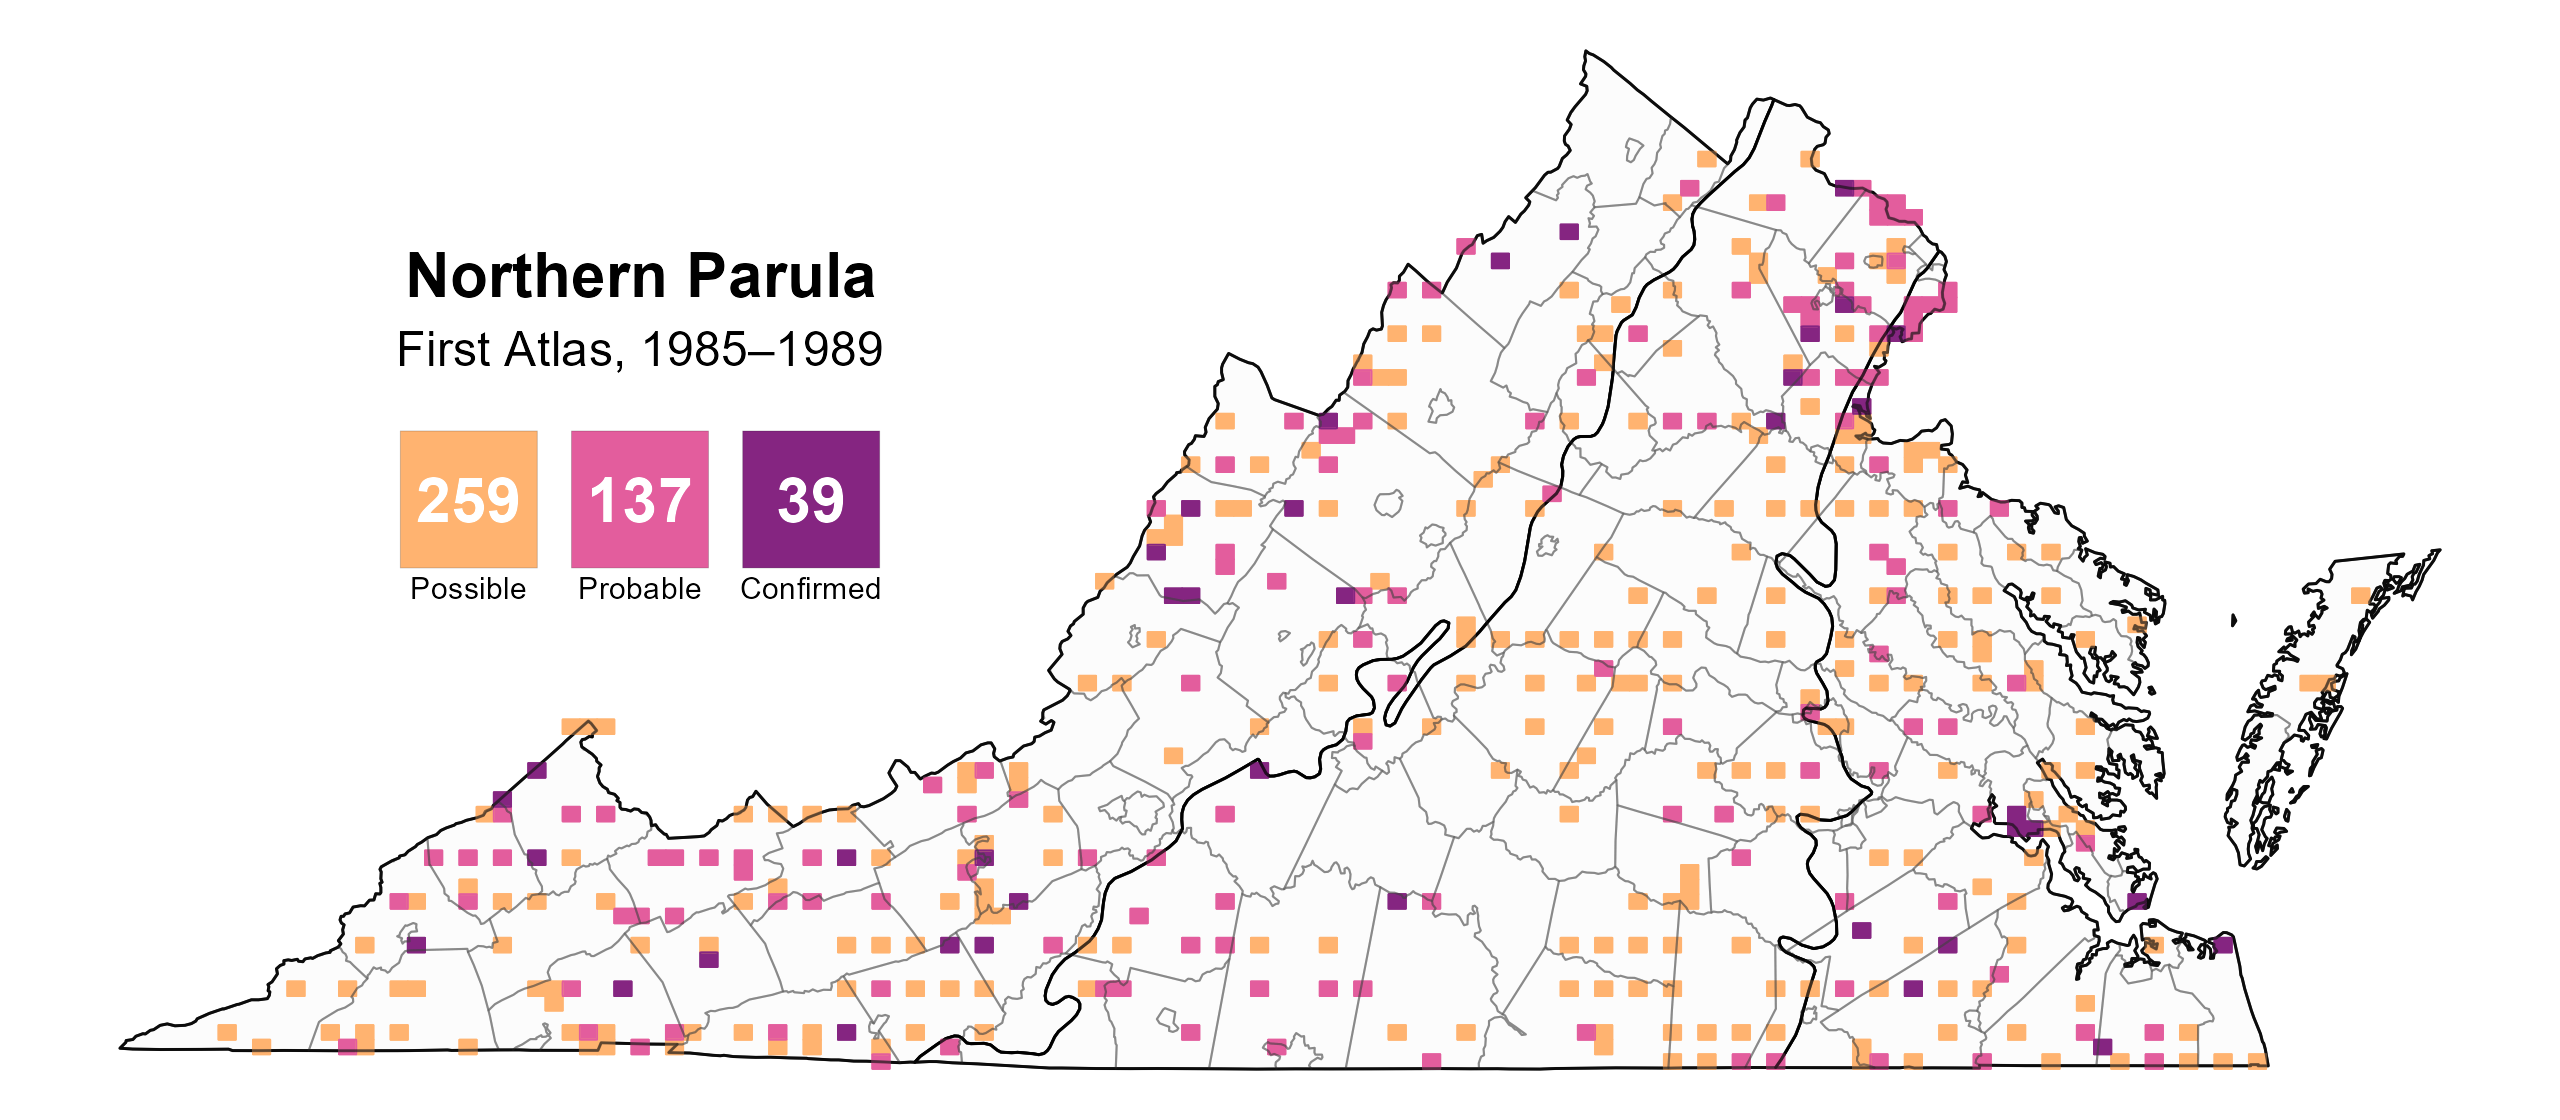
Figure 5: Northern Parula breeding observations from the First Atlas (1985–1989). The colored boxes illustrate Atlas blocks (approximately 10 mi2 [26 km2] survey units) where the species was detected. The colors show the highest breeding category recorded in a block. The numbers within the colors in the legend correspond to the number of blocks with that breeding evidence category.
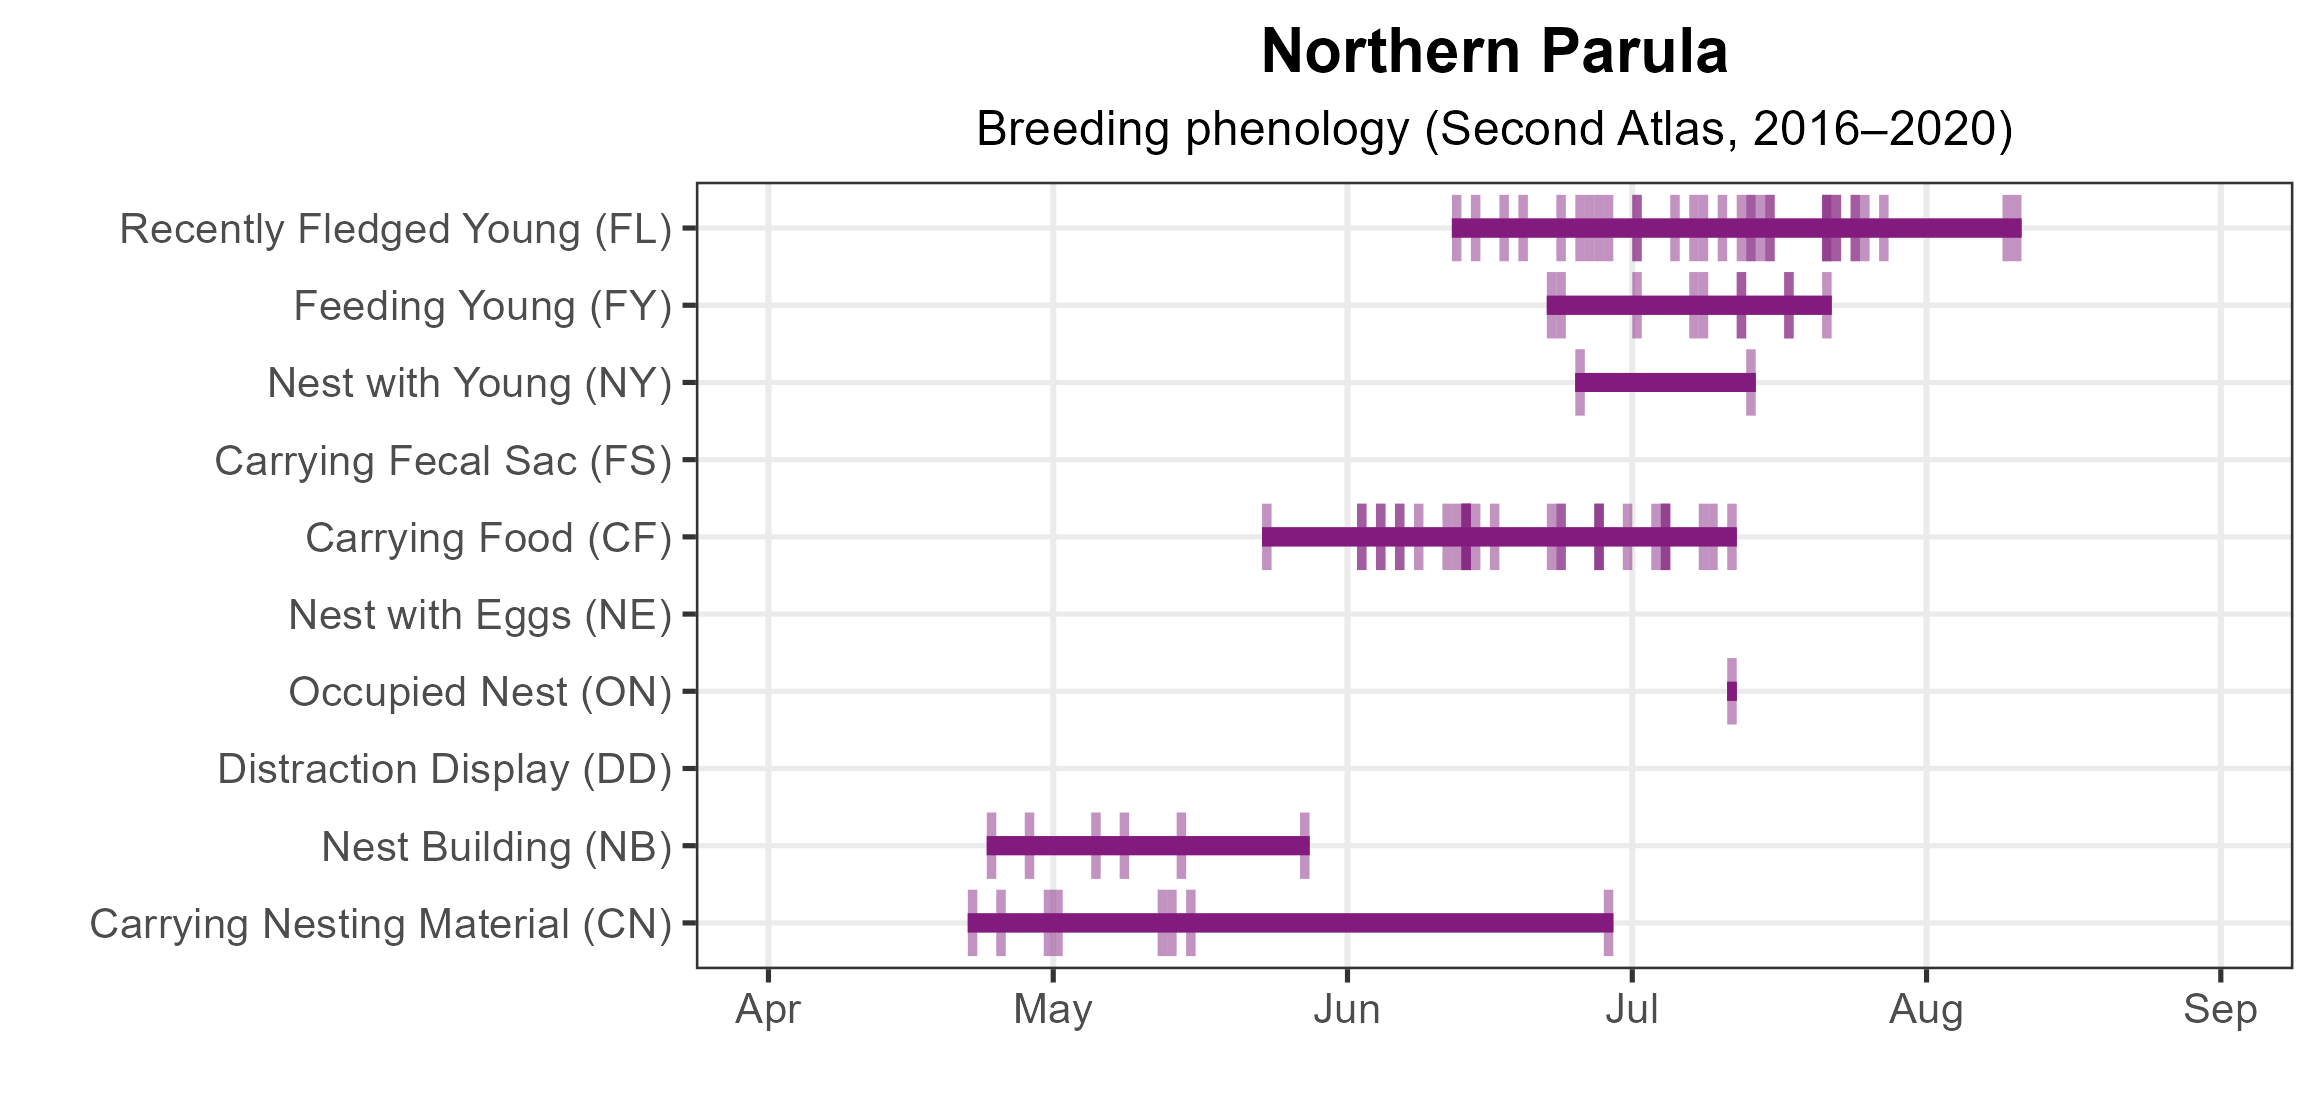
Figure 6: Northern Parula phenology: confirmed breeding codes. This graph shows a timeline of confirmed breeding behaviors. Tick marks represent individual observations of the behavior.
Population Status
Northern Parula relative abundance was estimated to be highest in three specific areas: the southern-central Piedmont region and the inner Coastal Plain region, the southwestern corner of the state, and the western-central Mountains and Valleys region (Figure 7).
The total estimated Northern Paula population in the state is approximately 244,000 individuals (with a range between 140,000 and 430,000). Based on the North American Breeding Bird Survey (BBS), the Northern Parula population is stable in Virginia, as it experienced a nonsignificant decline of 0.37% annually from 1966–2022, and between Atlases, it showed a similar nonsignificant decline of 0.29% per year from 1987–2018 (Hostetler et al. 2023; Figure 8).

Figure 7: Northern Parula relative abundance (Second Atlas, 2016–2020). This map indicates the predicted abundance of this species at a 0.4 mi2 (1 km2) scale based on environmental (including habitat) factors. Abundance values are presented on a relative scale of low to high.
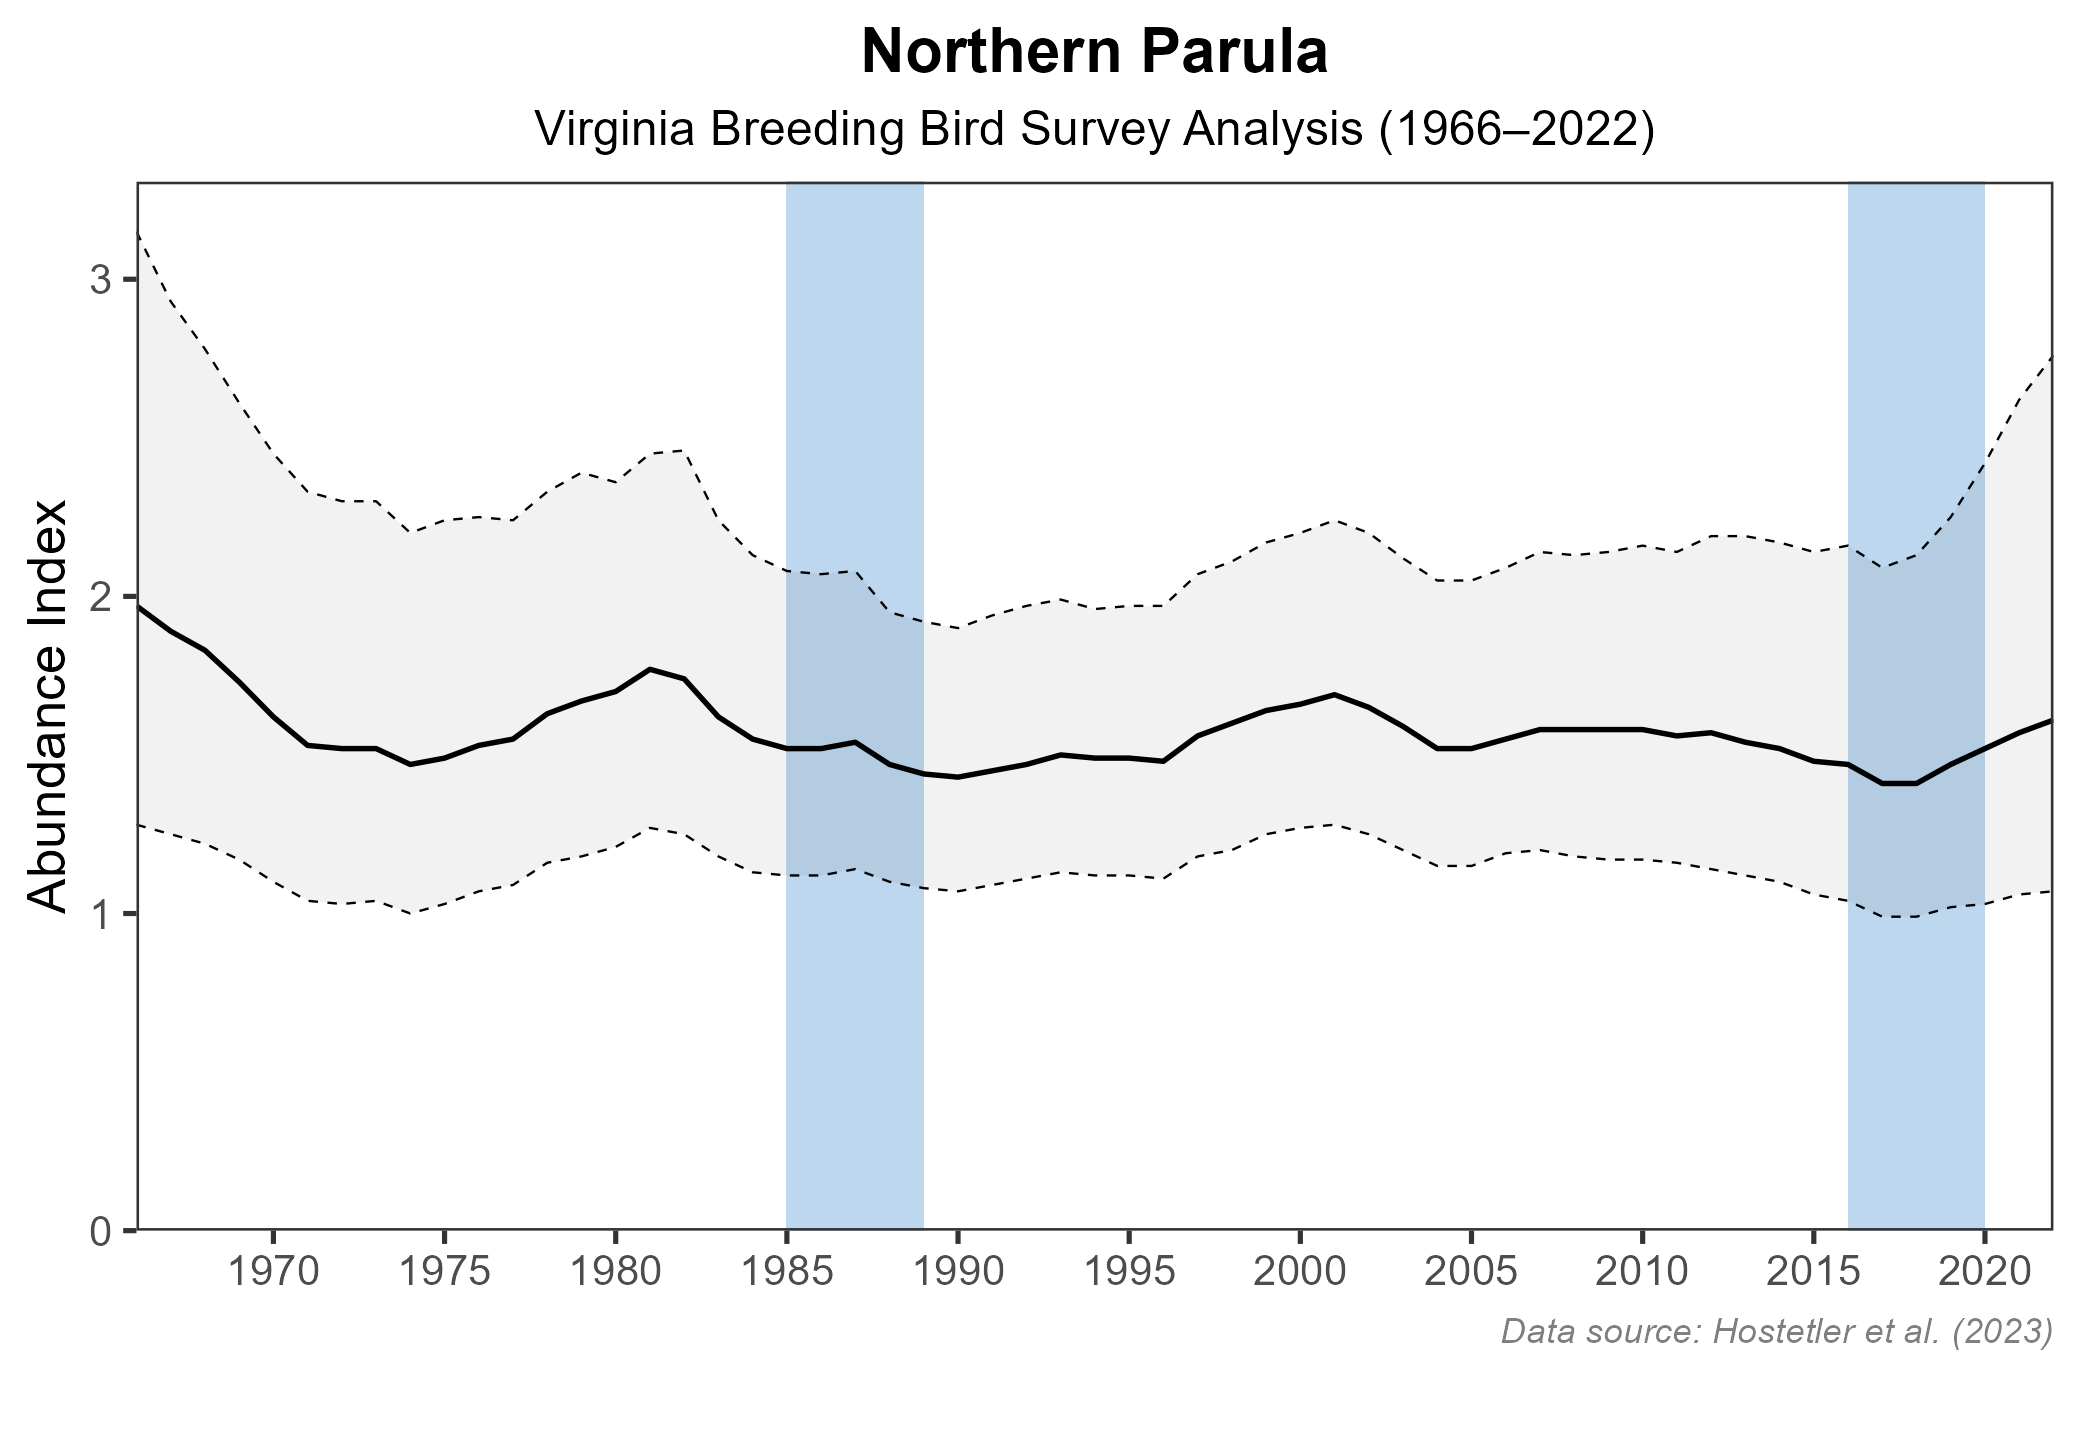
Figure 8: Northern Parula population trend for Virginia as estimated by the North American Breeding Bird Survey. The vertical axis shows species abundance; the horizontal axis shows the year. The solid line indicates the estimated population trend; there is a 97.5% probability that the true population trend falls between the dashed lines. The shaded bars indicate the First and Second Atlas periods.
Conservation
Northern Parulas are common and widespread in Virginia and throughout their range (Moldenhauer and Regelski 2020). They are not considered a species of special concern, and no specific conservation projects are underway in Virginia.
Interactive Map
The interactive map contains up to six Atlas layers (probability of occurrence for the First and Second Atlases, change in probability of occurrence between Atlases, breeding evidence for the First and Second Atlases, and abundance for the Second Atlas) that can be viewed one at a time. To view an Atlas map layer, mouse over the layer box in the upper left. County lines and physiographic regional boundaries (Mountains and Valleys, Piedmont, and Coastal Plain) can be turned on and off by checking or unchecking the box below the layer box. Within the map window, users can hover on a block to see its value for each layer and pan and zoom to see roads, towns, and other features of interest that are visible beneath a selected layer.
View Interactive Map in Full Screen
References
Hostetler, J. A., J. R. Sauer, J. E. Hines, D. Ziolkowski, and M. Lutmerding (2023). The North American breeding bird survey, analysis results 1966–2022. U.S. Geological Survey, Laurel, MD, USA. https://doi.org/10.5066/P9SC7T11.
Moldenhauer, R. R. and D. J. Regelski (2020). Northern Parula (Setophaga americana), version 1.0. In Birds of the World (A. F. Poole, Editor). Cornell Lab of Ornithology, Ithaca, NY, USA. https://doi.org/10.2173/bow.norpar.01.