Introduction
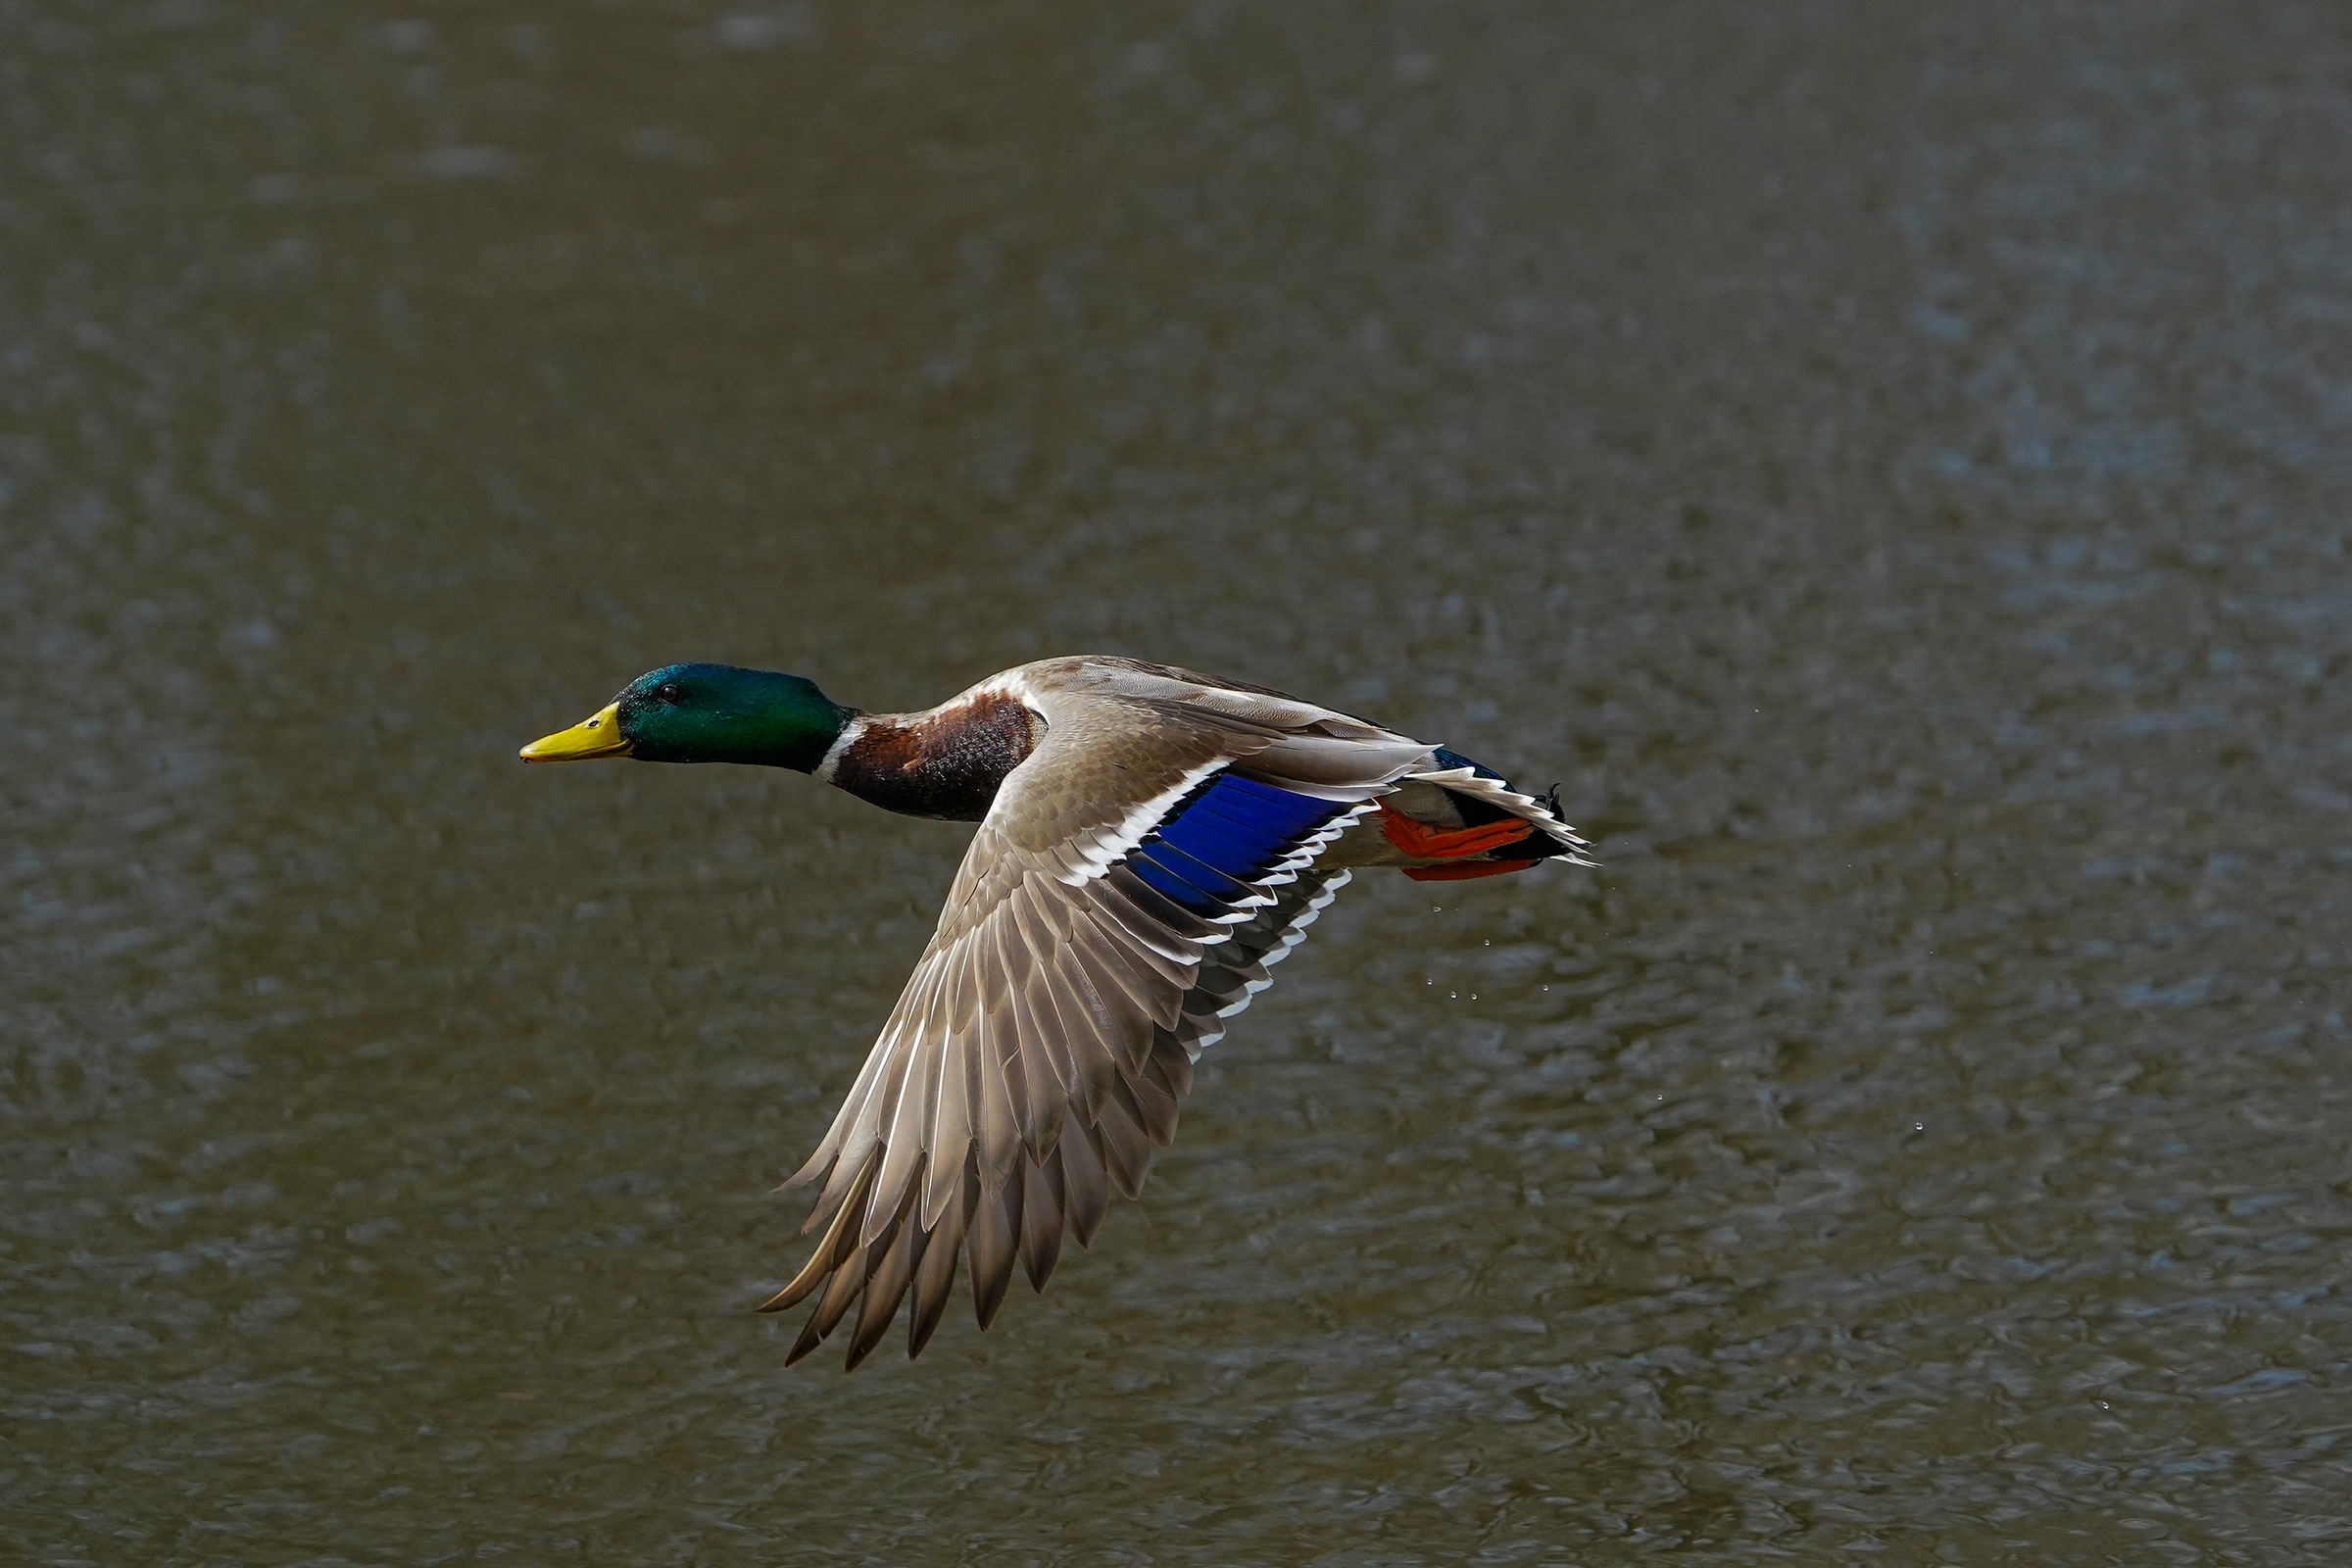
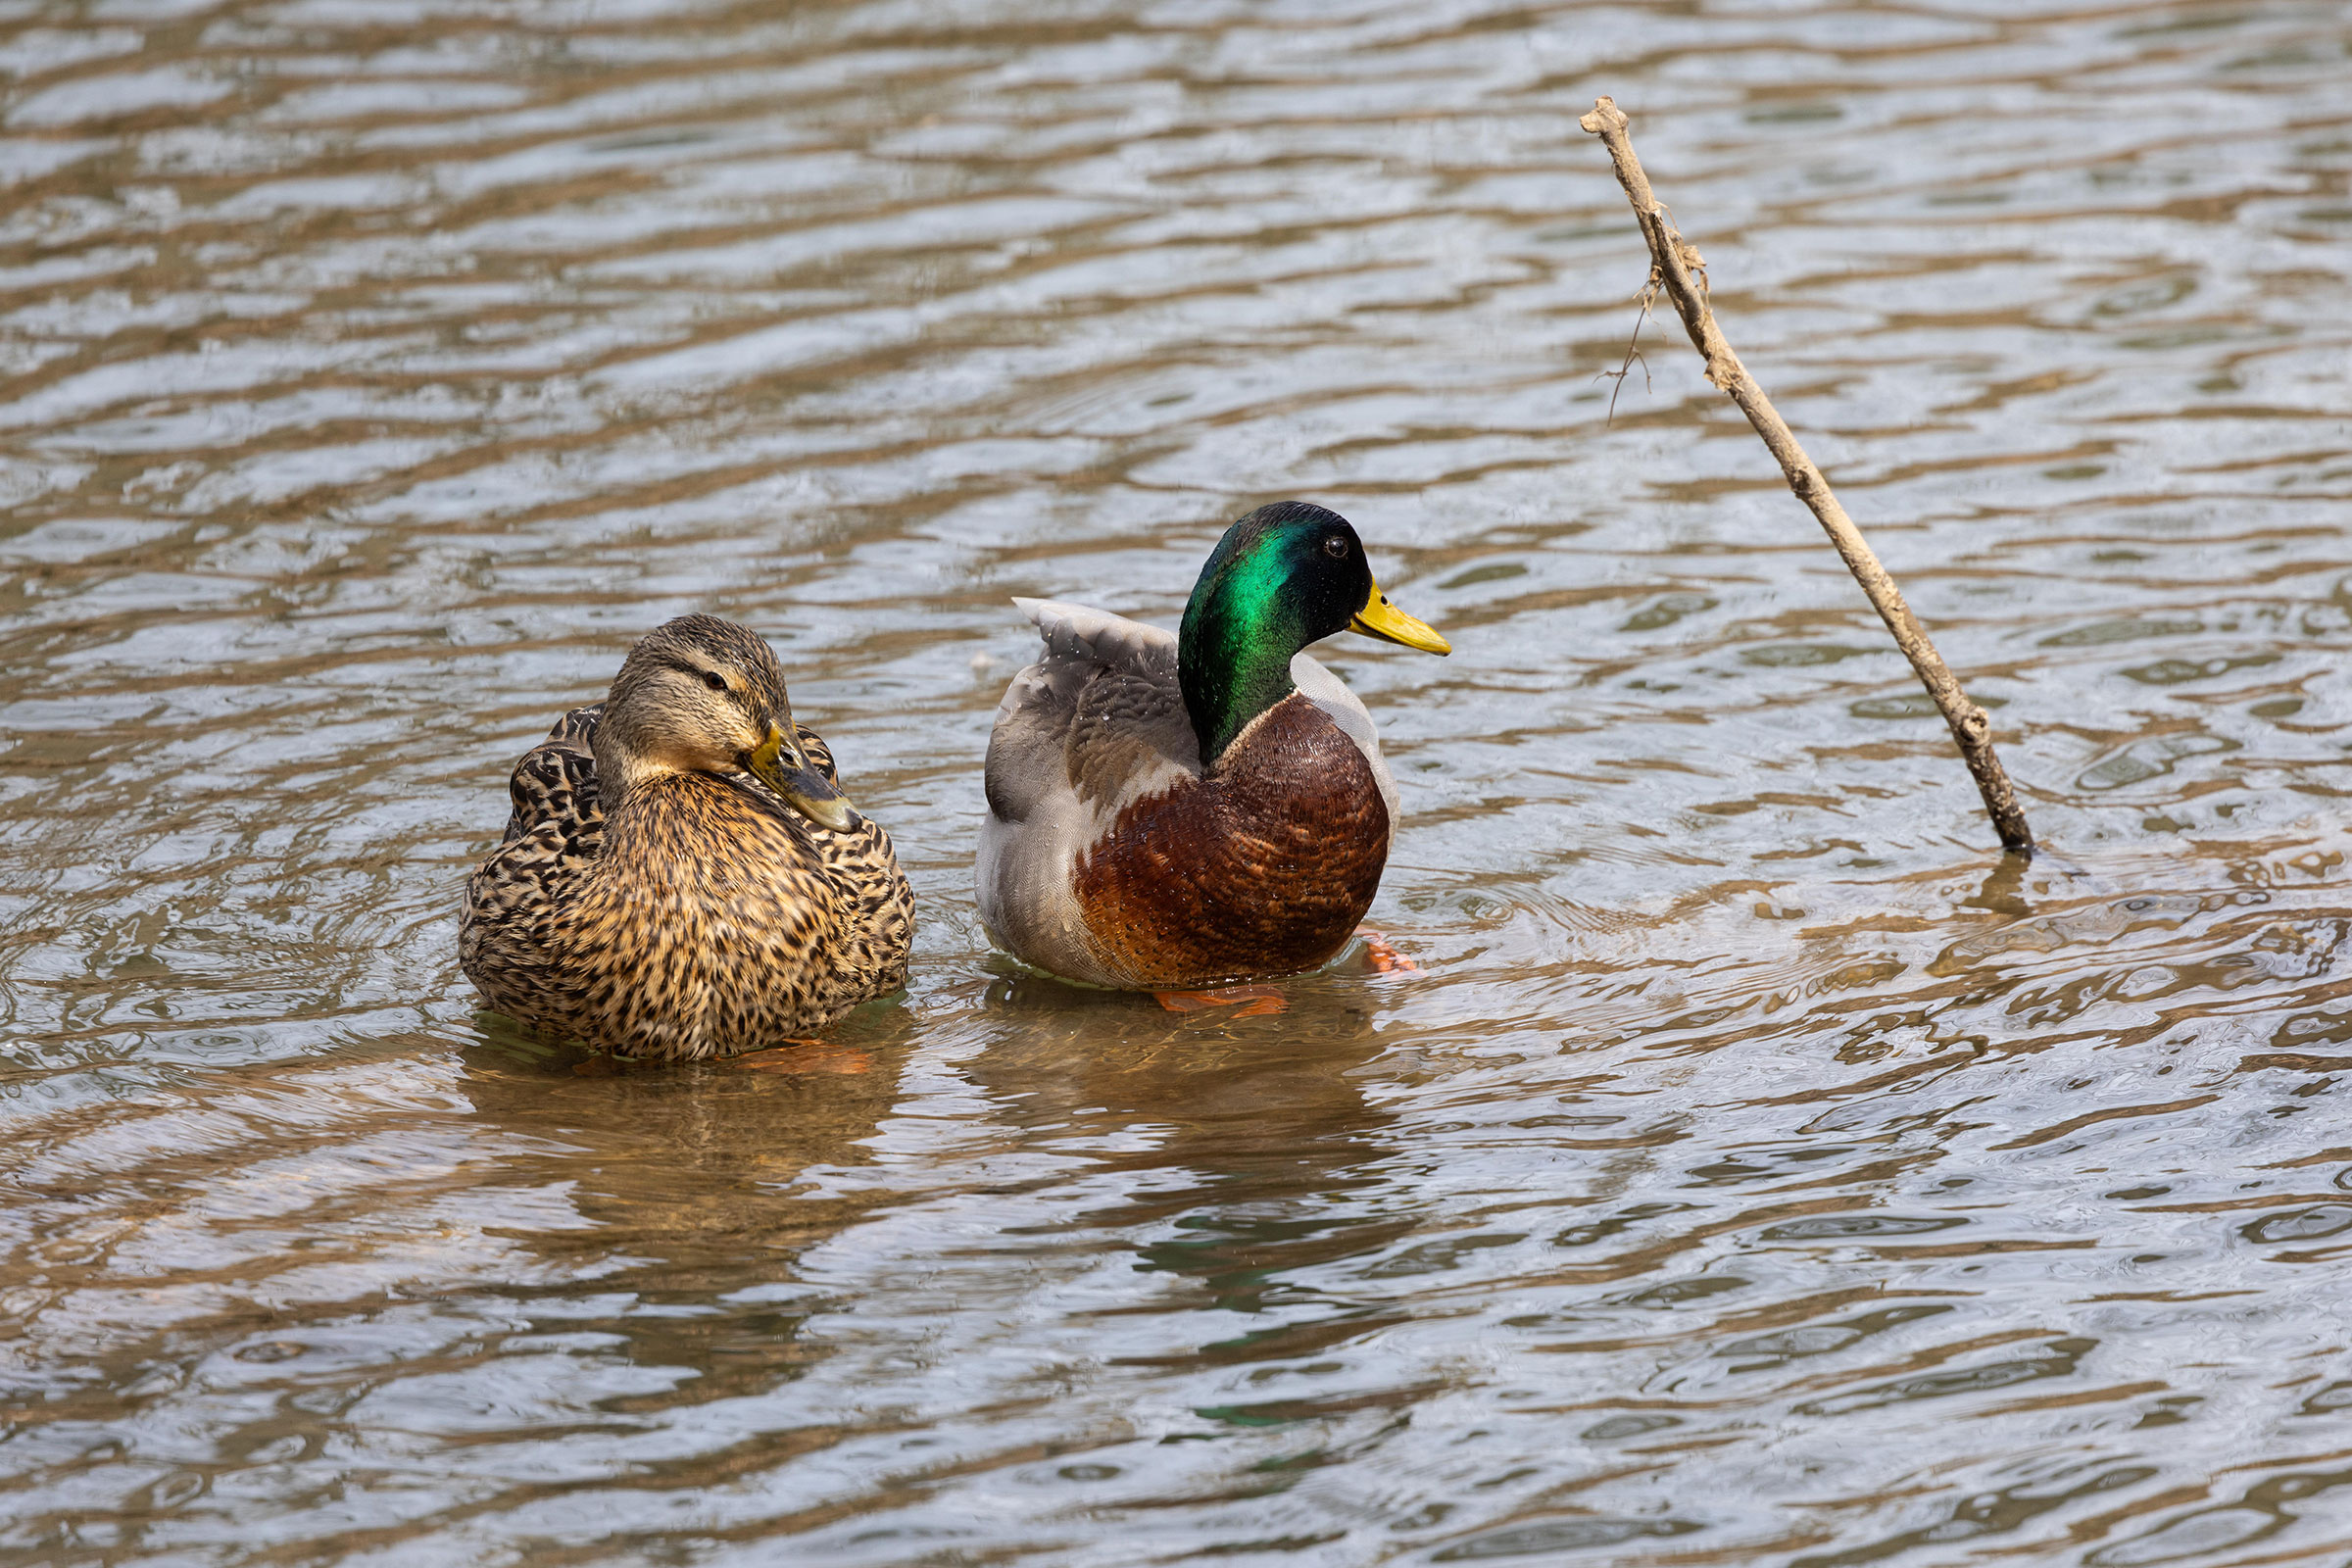
The familiar and iconic Mallard is the most common duck in Virginia. It can be found from the state’s urban parks to its wildest marshes. While universally abundant, the male’s iridescent green head and curled tail feathers give it a charm that rarely gets old. Its propensity to breed with domestic and other wild ducks has given rise to a suite of odd-looking hybrids with greenish heads that can be found in many parks across the state.
In the northeastern U.S., the mallard breeding population increased gradually from the 1950s through the 1980s (Heusmann 1991). This increase was attributed to two factors, a slow expansion of the mallard’s traditional western breeding range into human-altered habitats in the east and the release of many pen-raised mallards for stocking and hunting purposes into these habitats along the Atlantic Flyway. This population growth began slowing in the early 1990s, perhaps a result of the habitat reaching carrying capacity.
Breeding Distribution
Mallards are found in all regions of the state but are most likely to occur in urban-suburban complexes across the Commonwealth (Figure 1). Their likelihood occurring in a block sharply increases as the amount of developed land increases (Figure 1). This pattern is especially evident near large urban centers, such as Norfolk, Northern Virginia, and Richmond. Its probable occurrence is negatively associated with forest cover, agricultural lands, and grassland and shrubland habitats.
Between Atlases (Figures 1 and 2), the Mallard’s likelihood of occurrence increased throughout the Coastal Plain region, especially along the main rivers (Figure 3). In contrast, throughout the southern half of the Piedmont region, its probable occurrence decreased, while it remained constant throughout the northern Piedmont and Mountains and Valleys region.
View Environmental Associations
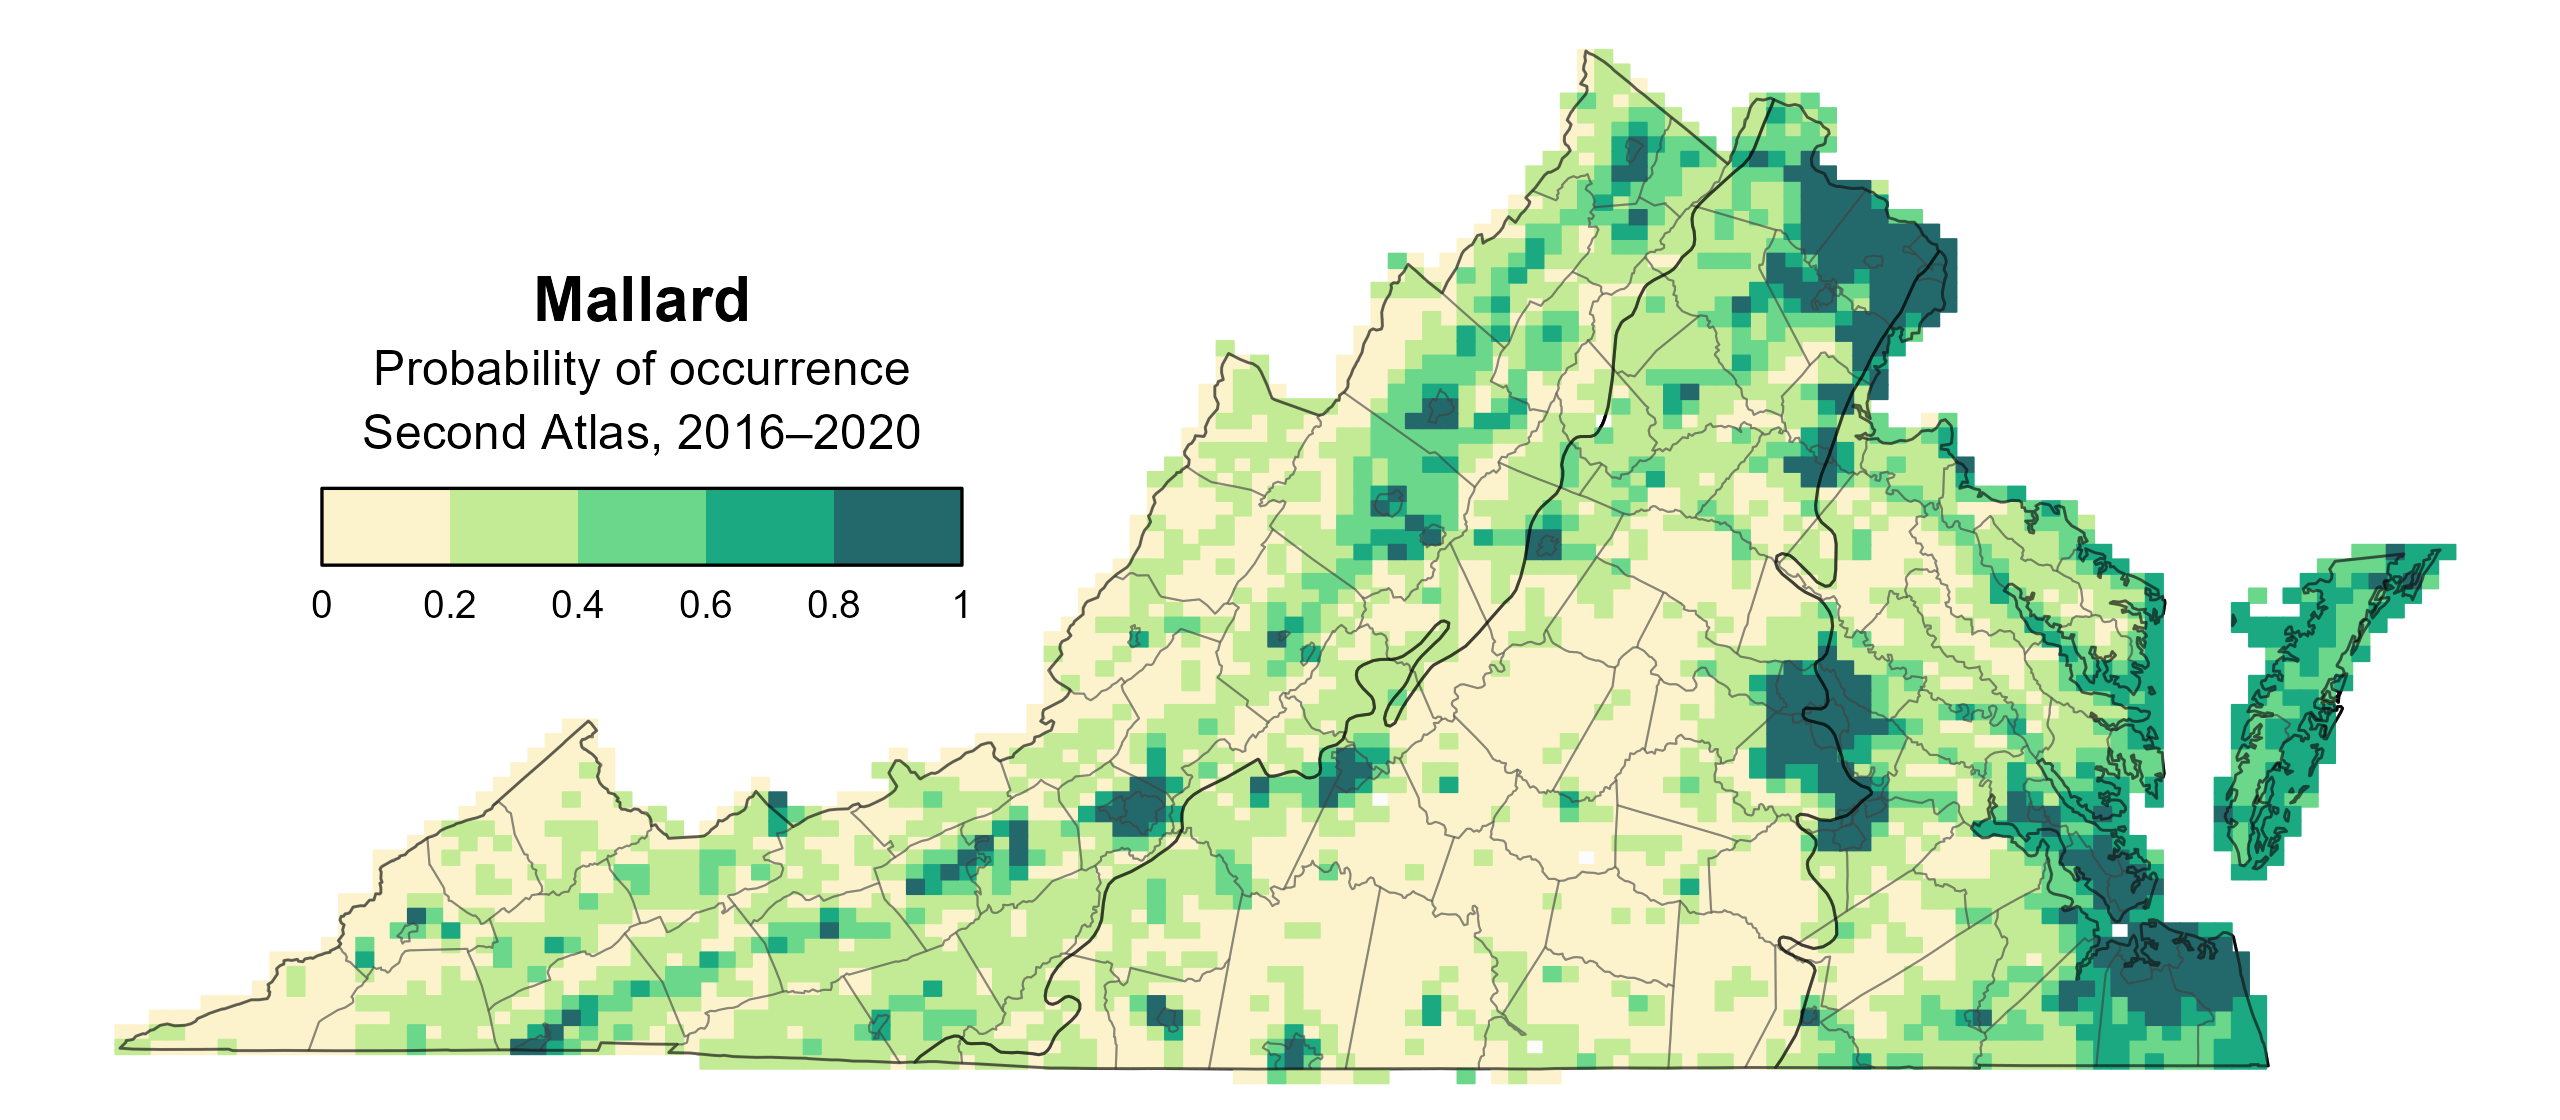
Figure 1: Mallard breeding distribution based on probability of occurrence (Second Atlas, 2016–2020). This map indicates the probability that this species will occur in an Atlas block (an approximately 10 mi2 [26 km2] survey unit) based on environmental (including habitat) factors and after adjusting for the probability of detection (variation in survey effort among blocks).
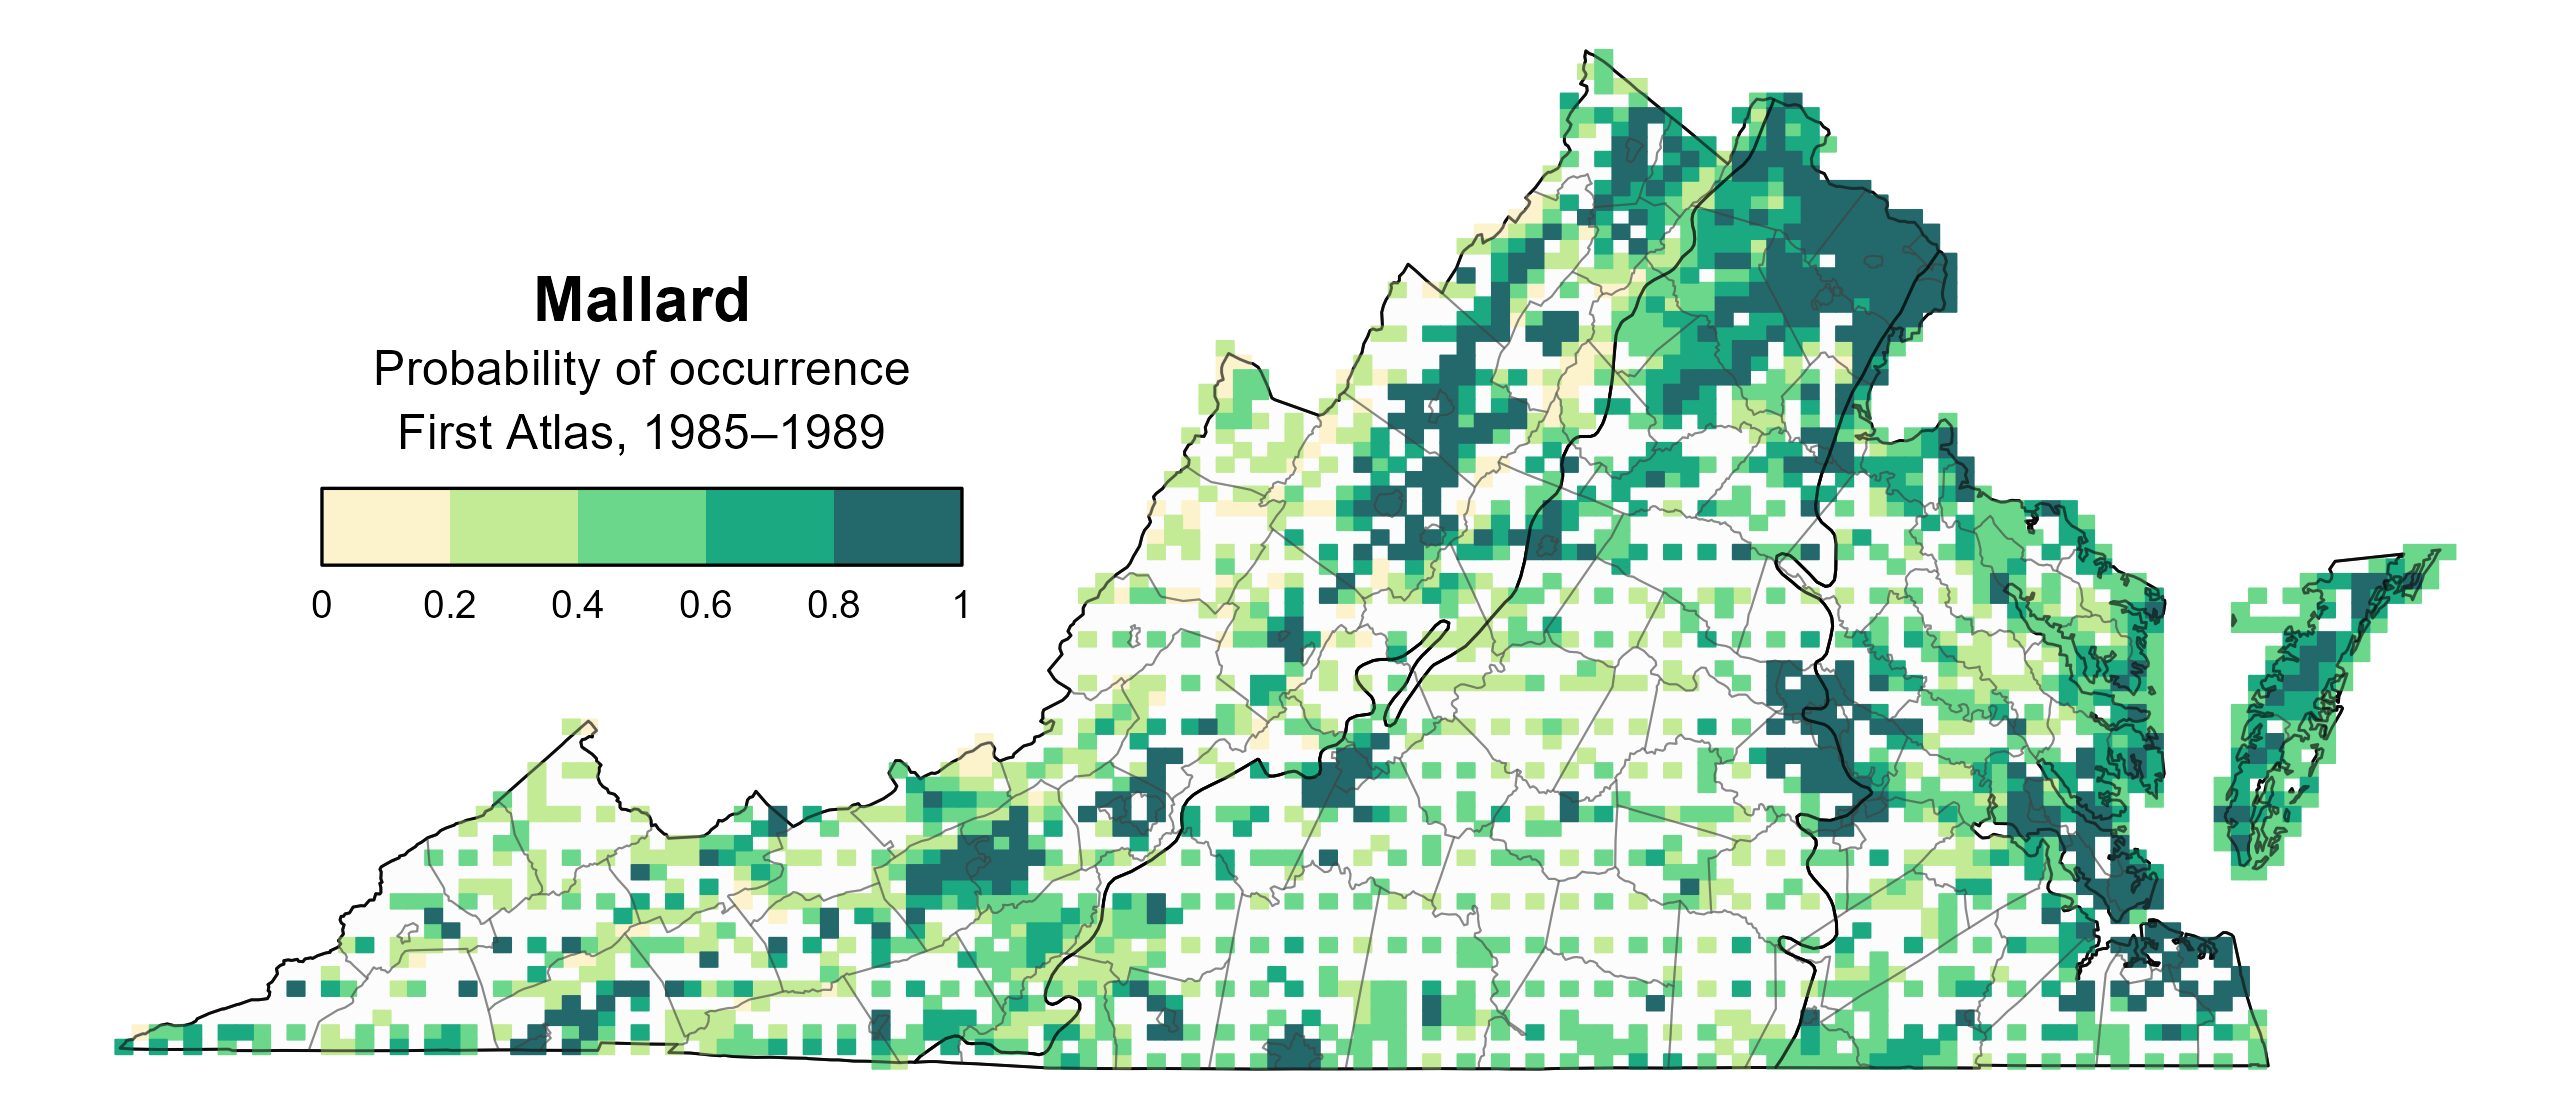
Figure 2: Mallard breeding distribution based on probability of occurrence (First Atlas, 1985–1989). This map indicates the probability that this species will occur in an Atlas block (an approximately 10 mi2 [26 km2] survey unit) based on environmental (including habitat) factors and after adjusting for the probability of detection (variation in survey effort among blocks). Blocks in white were not surveyed during the First Atlas and were not modeled.
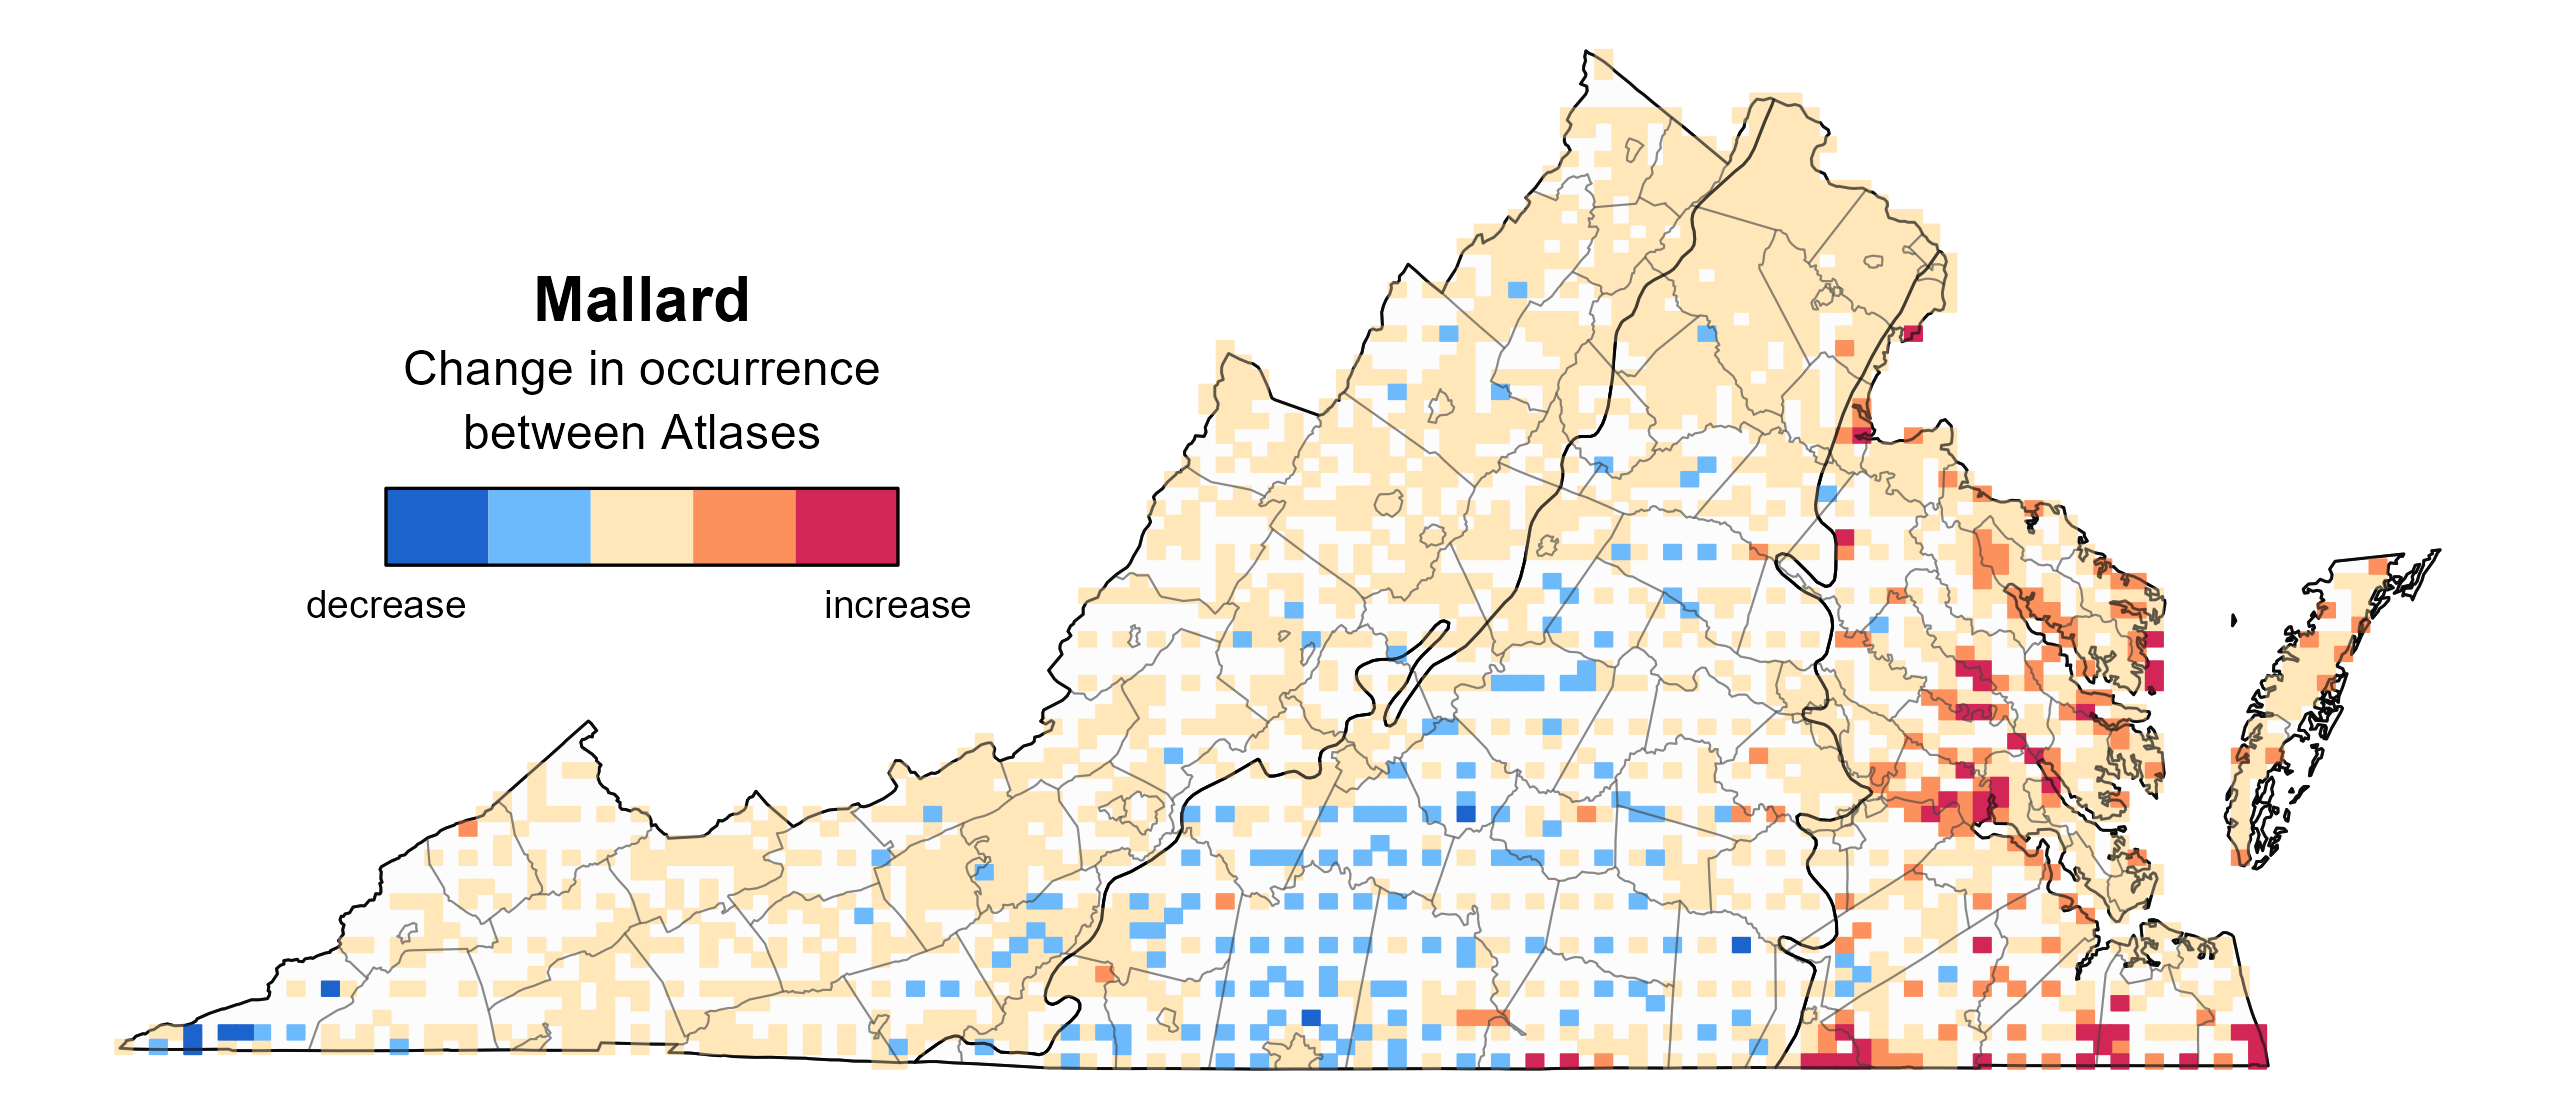
Figure 3: Mallard change in breeding distribution between Atlases (1985–1989 and 2016–2020) based on probability of occurrence. This map indicates the change in the probability that this species will occur in a block (an approximately 10 mi2 [26 km2] survey unit) between Atlas periods. Blocks with no change (tan) may have constant presence or constant absence. Blocks in white were not surveyed during the First Atlas and were not modeled.
Breeding Evidence
Mallards were confirmed breeders in 307 blocks and 89 counties and found to be probable breeders in an additional 23 counties (Figure 4). Breeding observations followed a similar pattern during both Atlas periods; however, they were more widespread during the Second Atlas, which may have been due to the substantial increase in survey effort during that period.
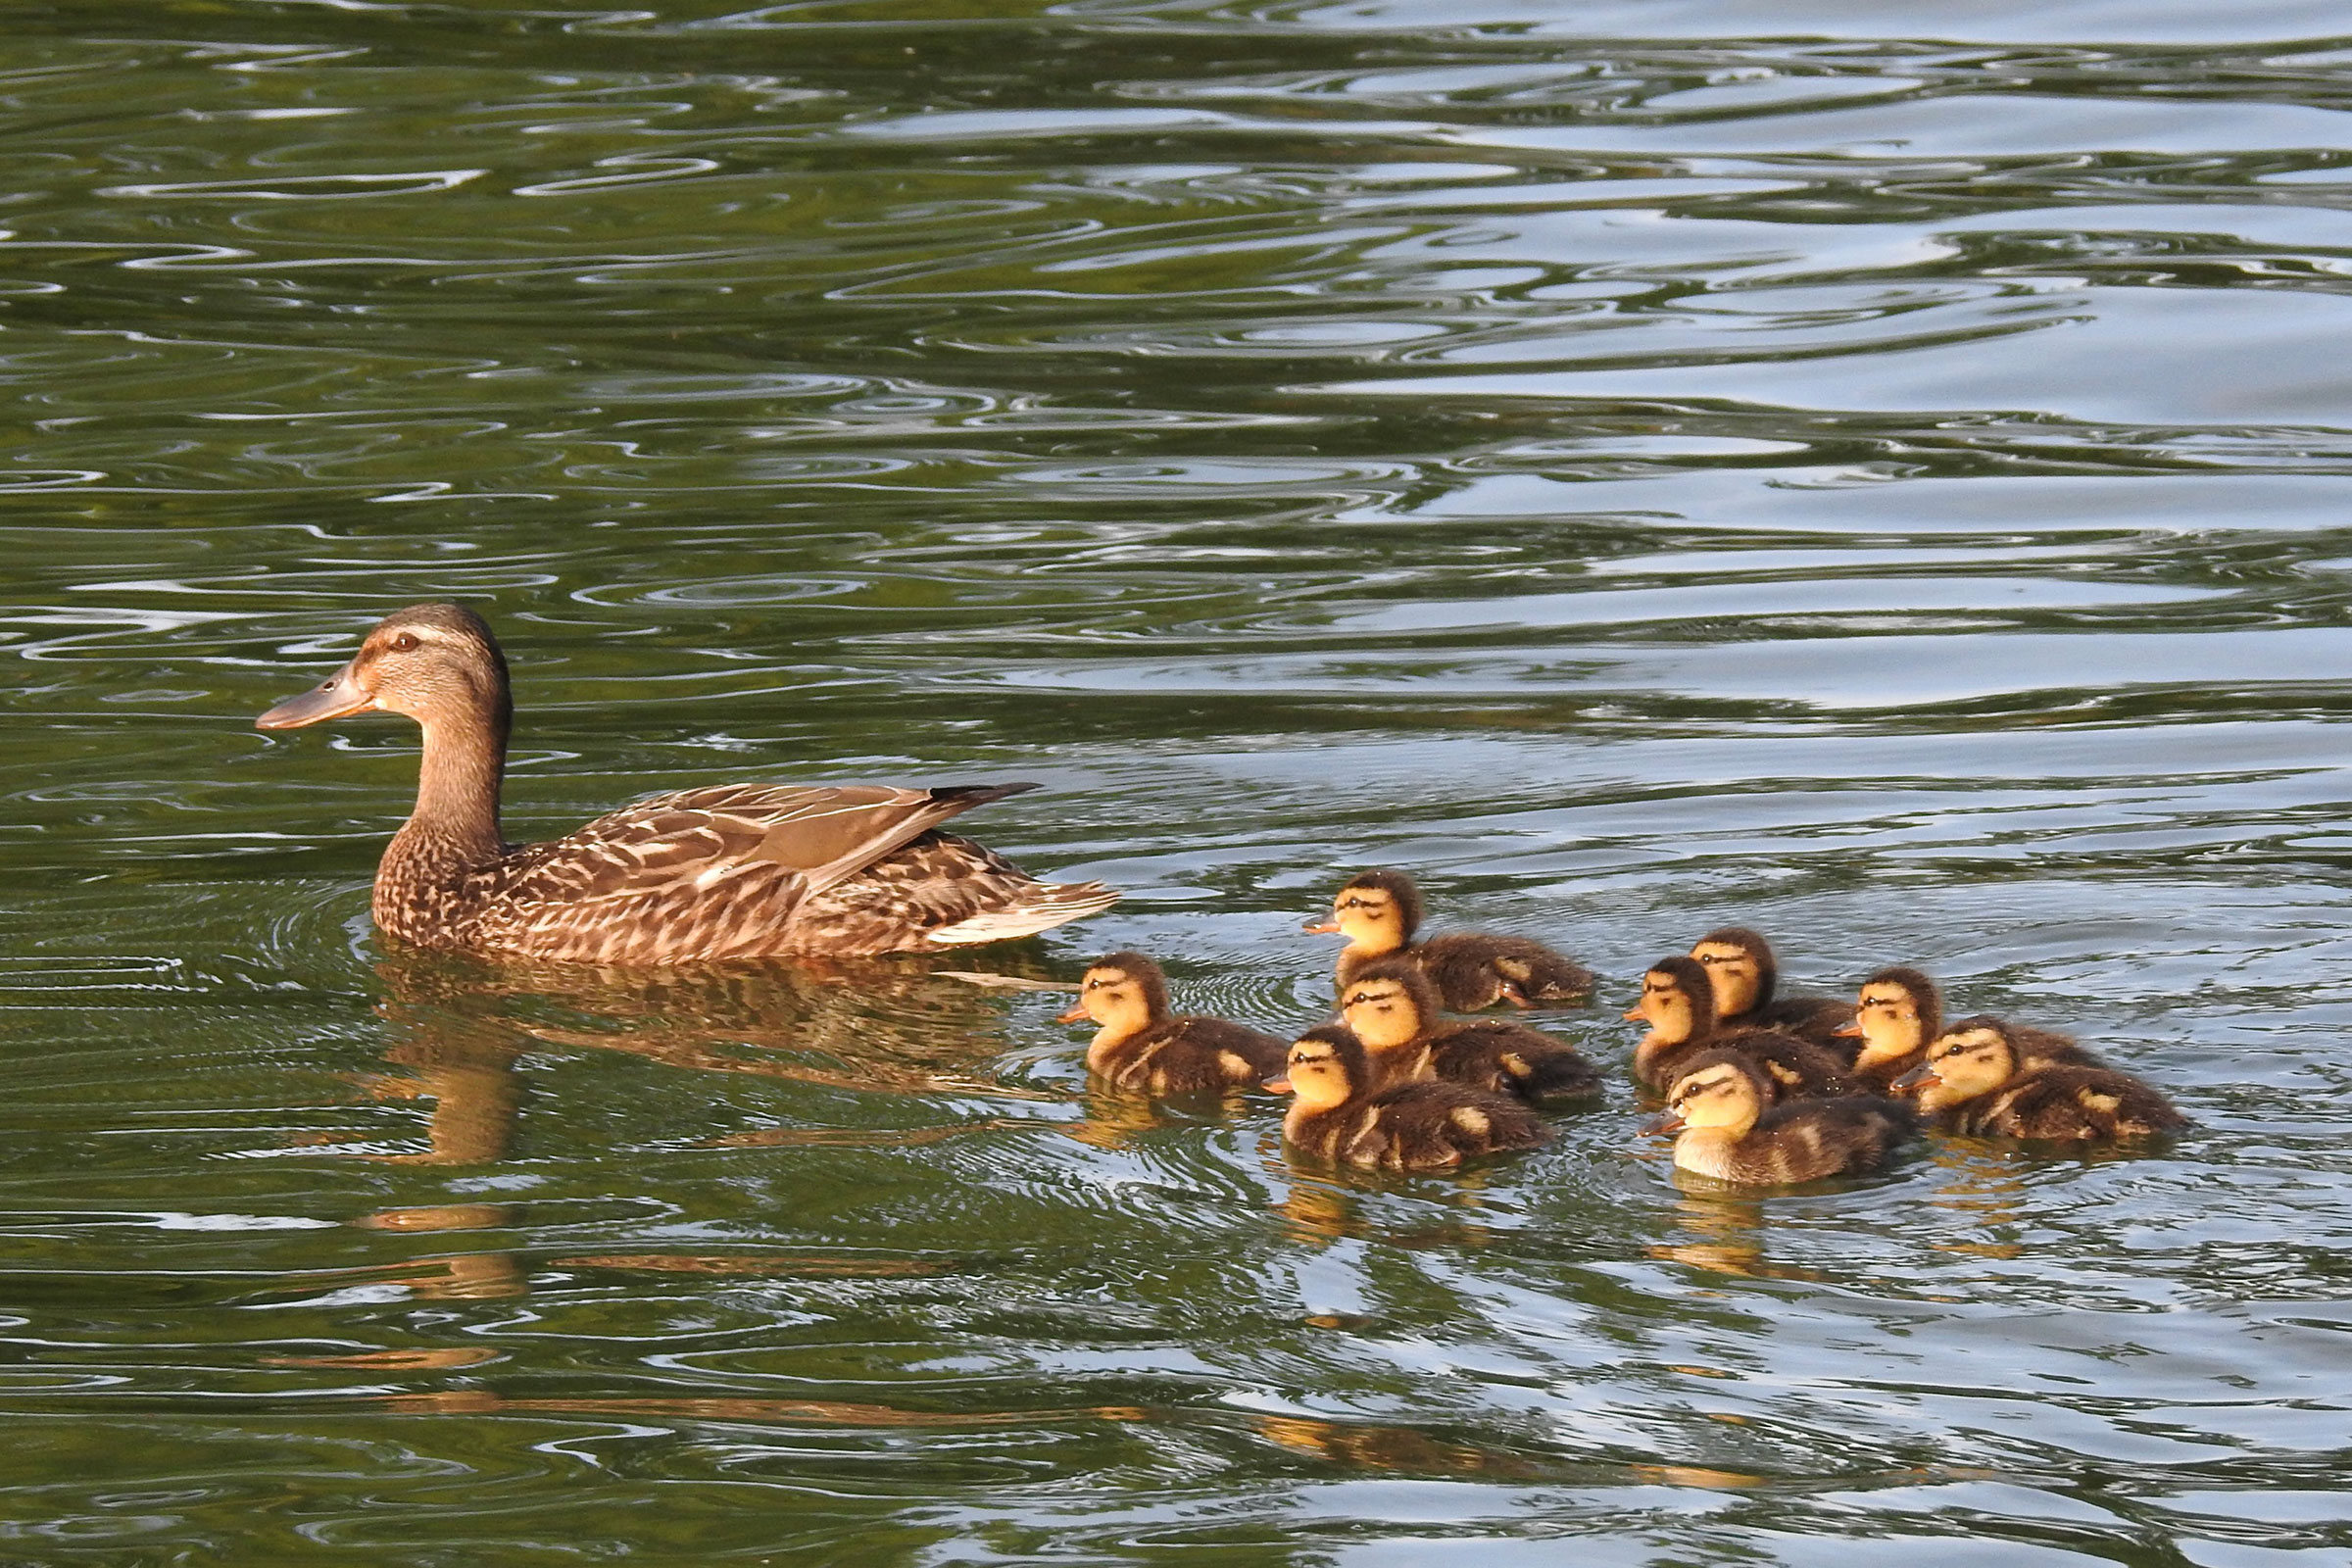
The earliest confirmed breeding behavior was documented in early March when nests with eggs were observed (Figure 6). However, breeding was overwhelmingly confirmed through observations of recently fledged young (March 13 to November 18).
For more general information on the breeding habits of this species, please refer to All About Birds.
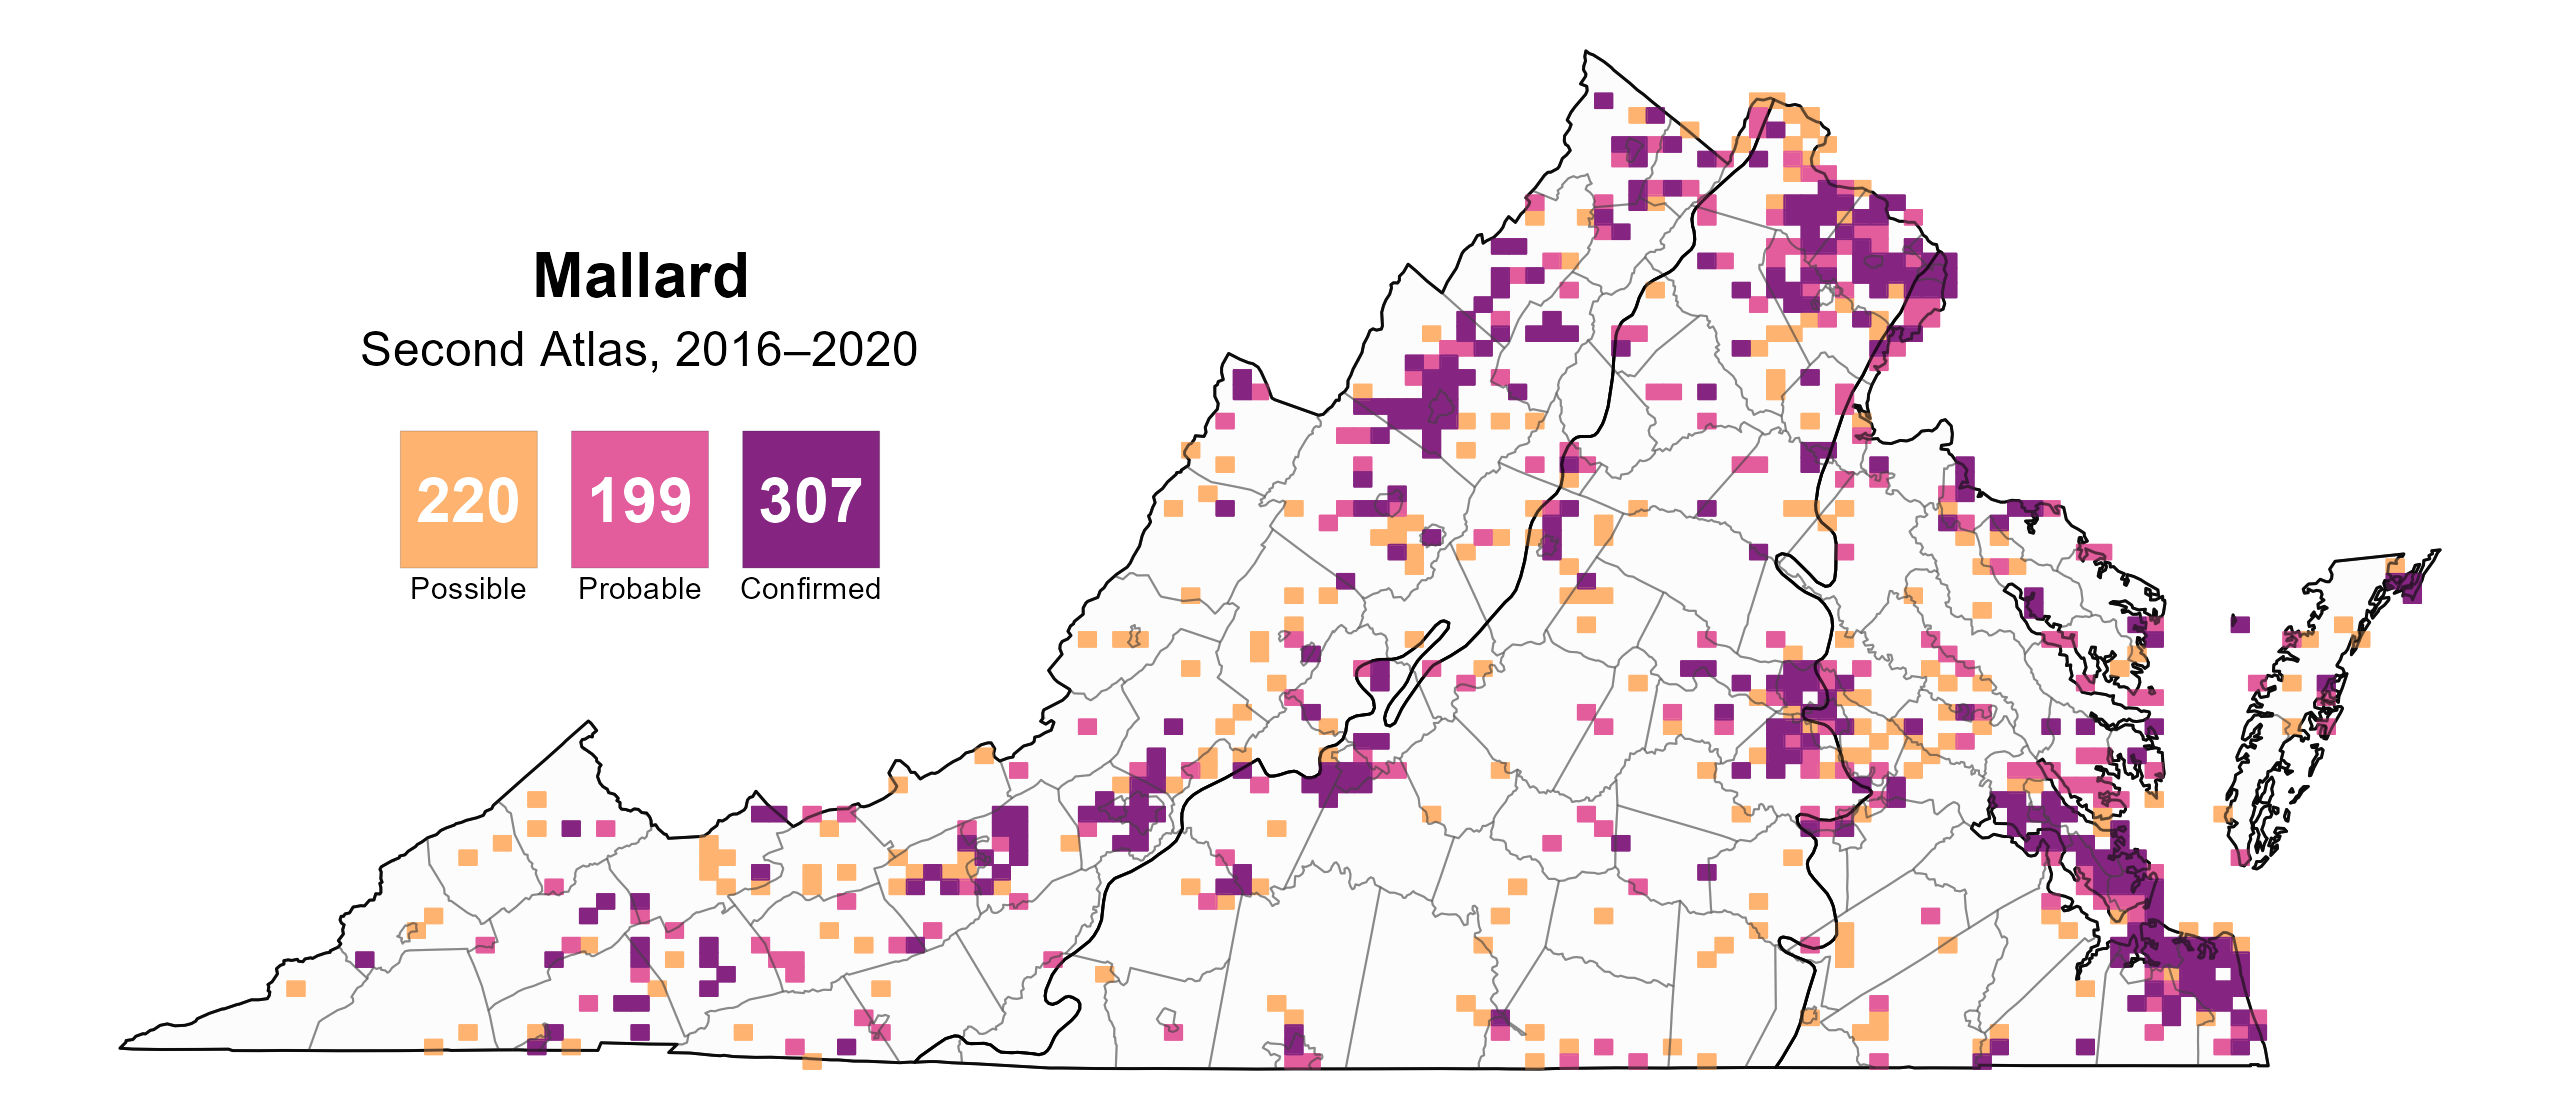
Figure 4: Mallard breeding observations from the Second Atlas (2016–2020). The colored boxes illustrate Atlas blocks (approximately 10 mi2 [26 km2] survey units) where the species was detected. The colors show the highest breeding category recorded in a block. The numbers within the colors in the legend correspond to the number of blocks with that breeding evidence category.
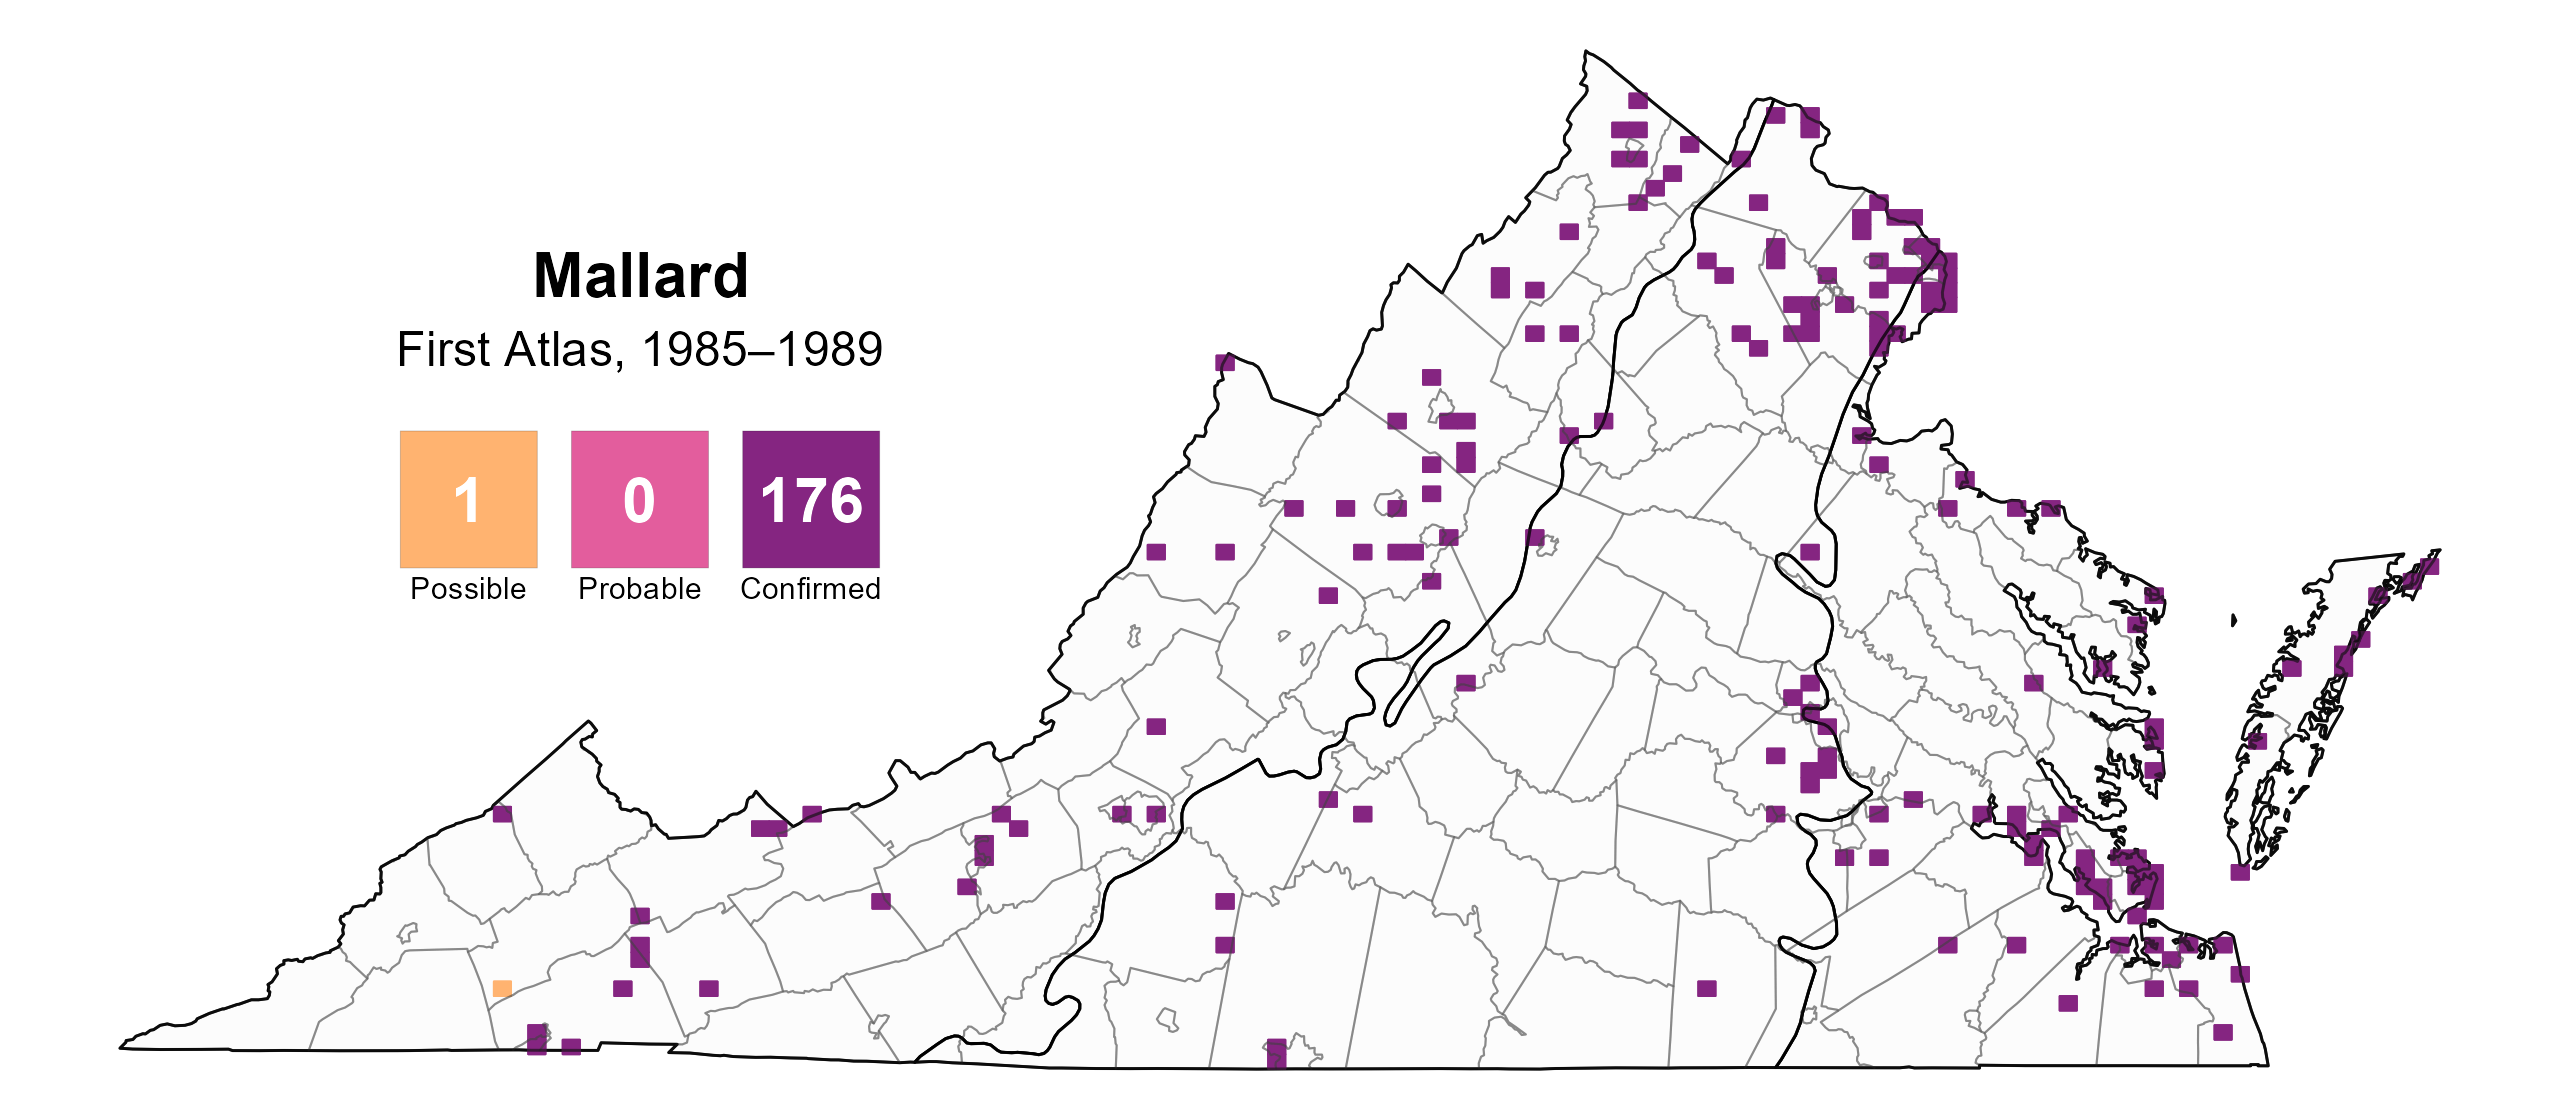
Figure 5: Mallard breeding observations from the First Atlas (1985–1989). The colored boxes illustrate Atlas blocks (approximately 10 mi2 [26 km2] survey units) where the species was detected. The colors show the highest breeding category recorded in a block. The numbers within the colors in the legend correspond to the number of blocks with that breeding evidence category.
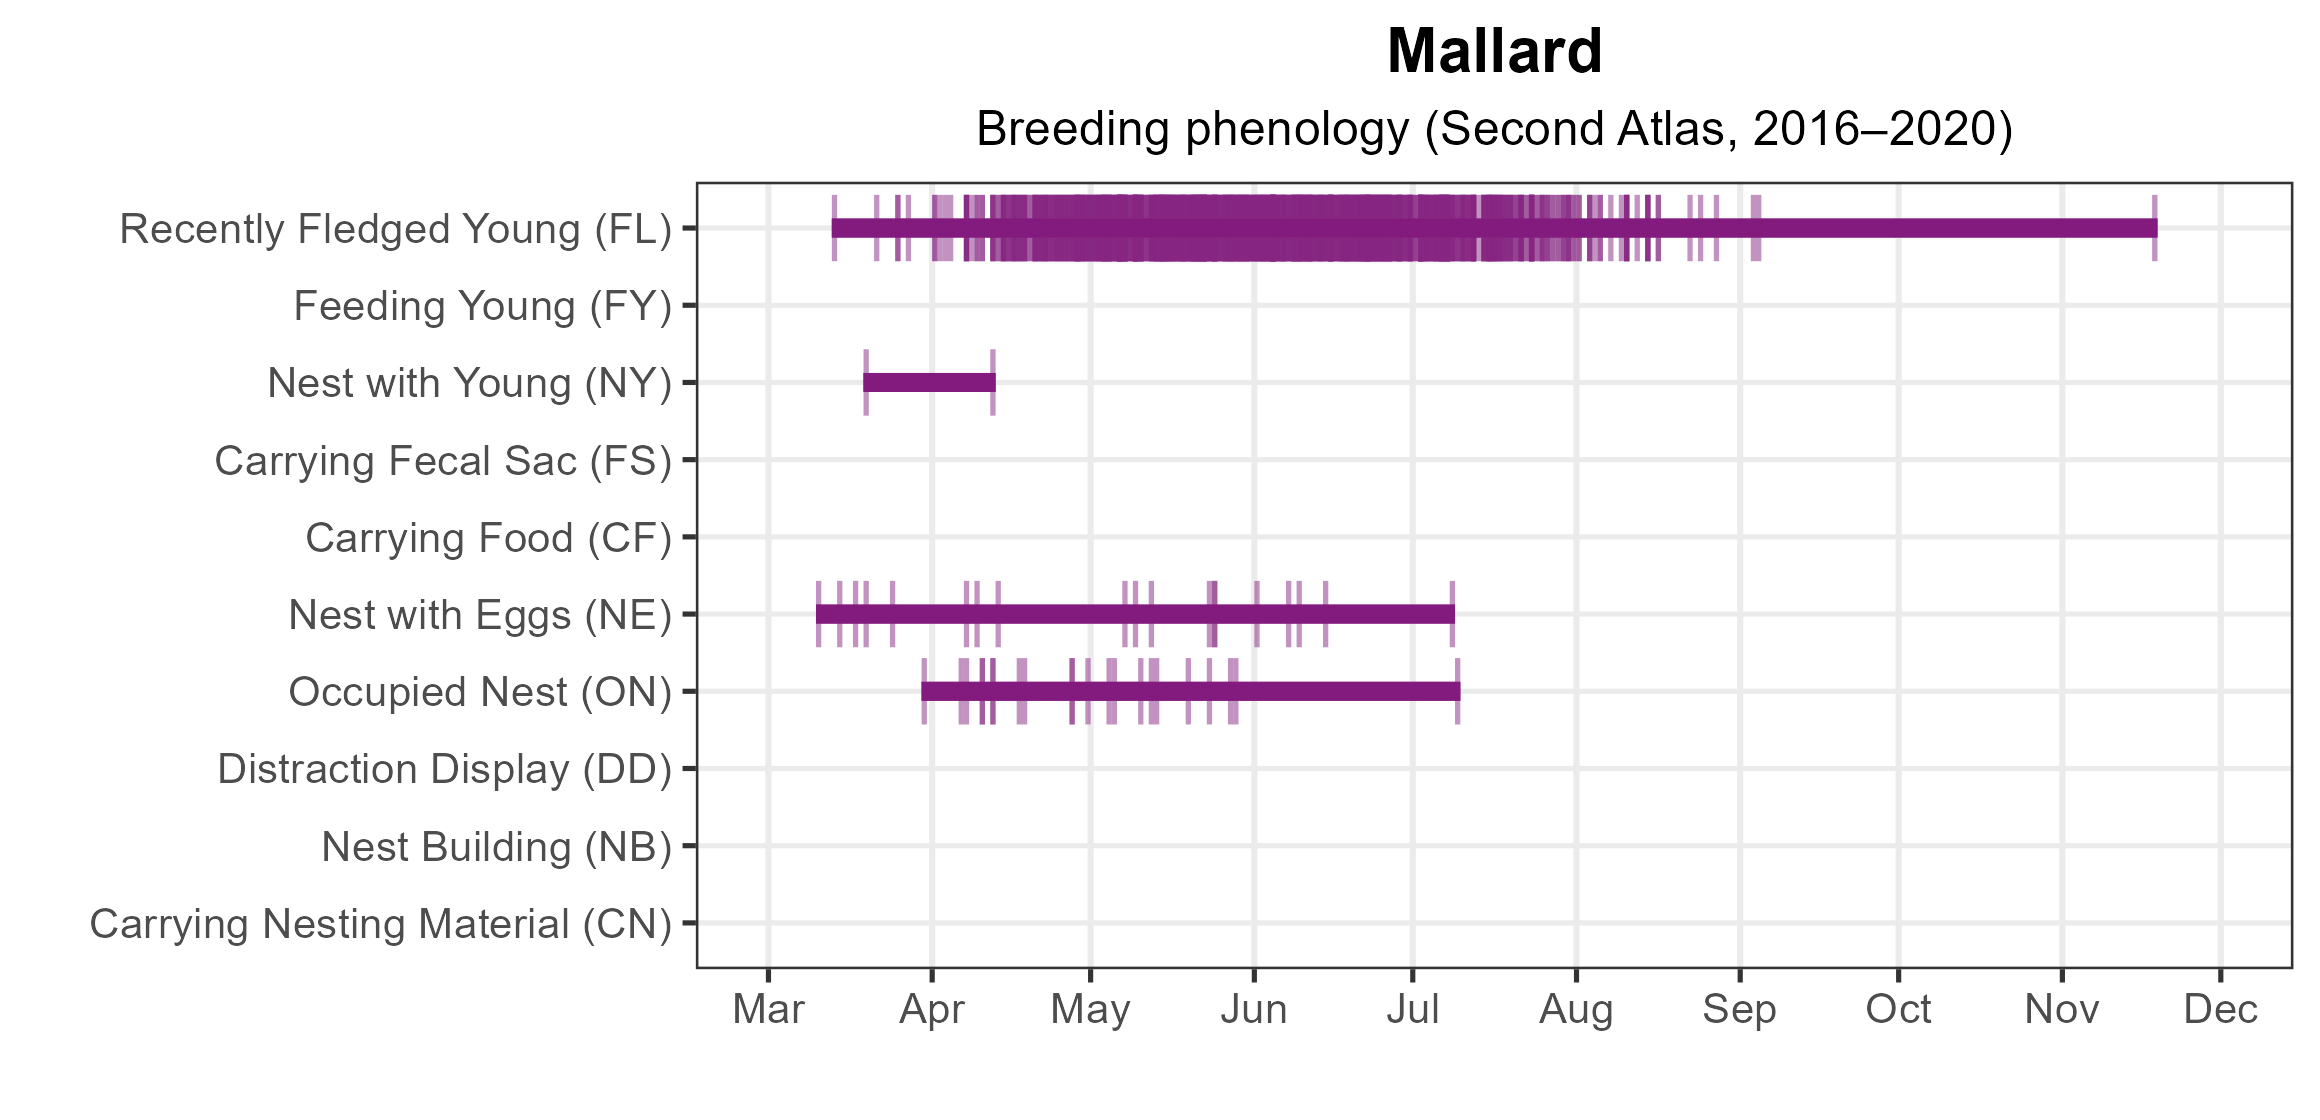
Figure 6: Mallard phenology: confirmed breeding codes. This graph shows a timeline of confirmed breeding behaviors. Tick marks represent individual observations of the behavior.
Population Status
Mallard relative abundance was estimated to be highest in urban-suburban areas across the state (Figure 7). In addition, relative abundance was consistently high on the Eastern Shore.
The total estimated Mallard population in the state is approximately 46,000 individuals (with a range between 13,000 and 166,000). Recent data from the Atlantic Flyway Breeding Waterfowl Plot Survey (1993–2023) shows a gradual declining trend in the northeastern U. S. (Heusmann and Sauer 2000). The long-term population trends in Virginia show the same general pattern, although results are more variable (Gary Costanzo, personal communication).
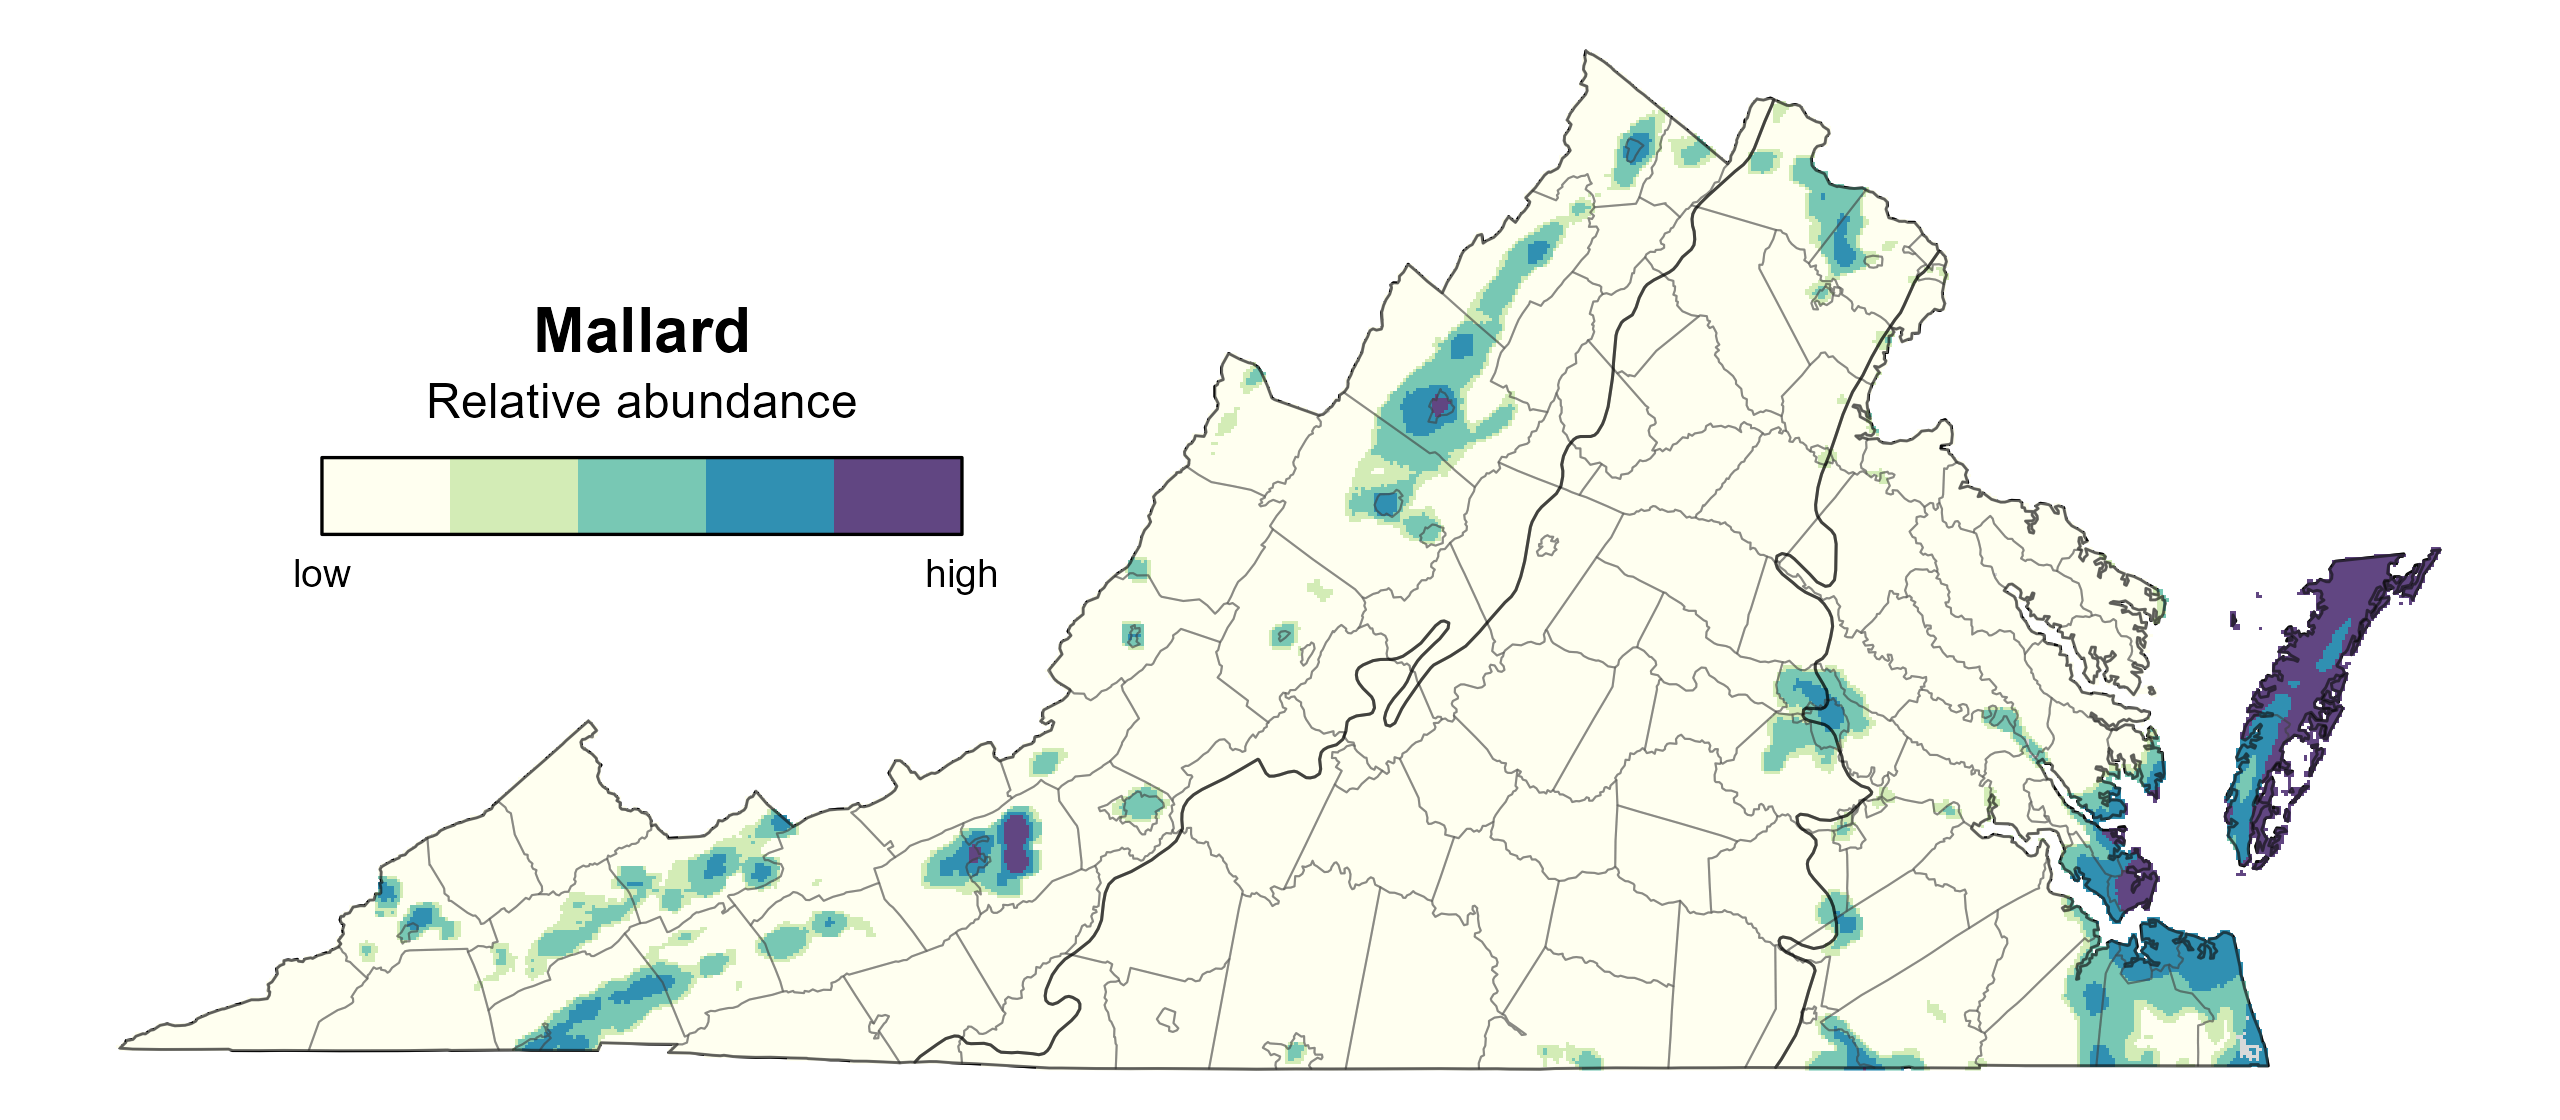
Figure 7: Mallard relative abundance (Second Atlas, 2016–2020). This map indicates the predicted abundance of this species at a 0.4 mi2 (1 km2) scale based on environmental (including habitat) factors. Abundance values are presented on a relative scale of low to high.
Conservation
Mallards are the most widespread and abundant waterfowl species in North America and are not considered a conservation priority anywhere within their range (Drilling et al. 2020). Its stable population is largely due to efforts by state and federal conservation agencies, private organizations such as Ducks Unlimited and Delta Waterfowl, and coordinated strategies such as the North American Waterfowl Management Plan.
Interactive Map
The interactive map contains up to six Atlas layers (probability of occurrence for the First and Second Atlases, change in probability of occurrence between Atlases, breeding evidence for the First and Second Atlases, and abundance for the Second Atlas) that can be viewed one at a time. To view an Atlas map layer, mouse over the layer box in the upper left. County lines and physiographic regional boundaries (Mountains and Valleys, Piedmont, and Coastal Plain) can be turned on and off by checking or unchecking the box below the layer box. Within the map window, users can hover on a block to see its value for each layer and pan and zoom to see roads, towns, and other features of interest that are visible beneath a selected layer.
View Interactive Map in Full Screen
References
Drilling, N., R. D. Titman, and F. McKinney (2020). Mallard (Anas platyrhynchos), version 1.0. In Birds of the World (S. M. Billerman, Editor). Cornell Lab of Ornithology, Ithaca, NY, USA. https://doi.org/10.2173/bow.mallar3.01
Heusmann, H. W. (1991). The history and status of the Mallard in the Atlantic Flyway. Wildlife Society Bulletin 19:14–22.
Heusmann, H. W., and J. R. Sauer (2000). The northeastern states’ waterfowl breeding population survey. Wildlife Society Bulletin 28:355–364.