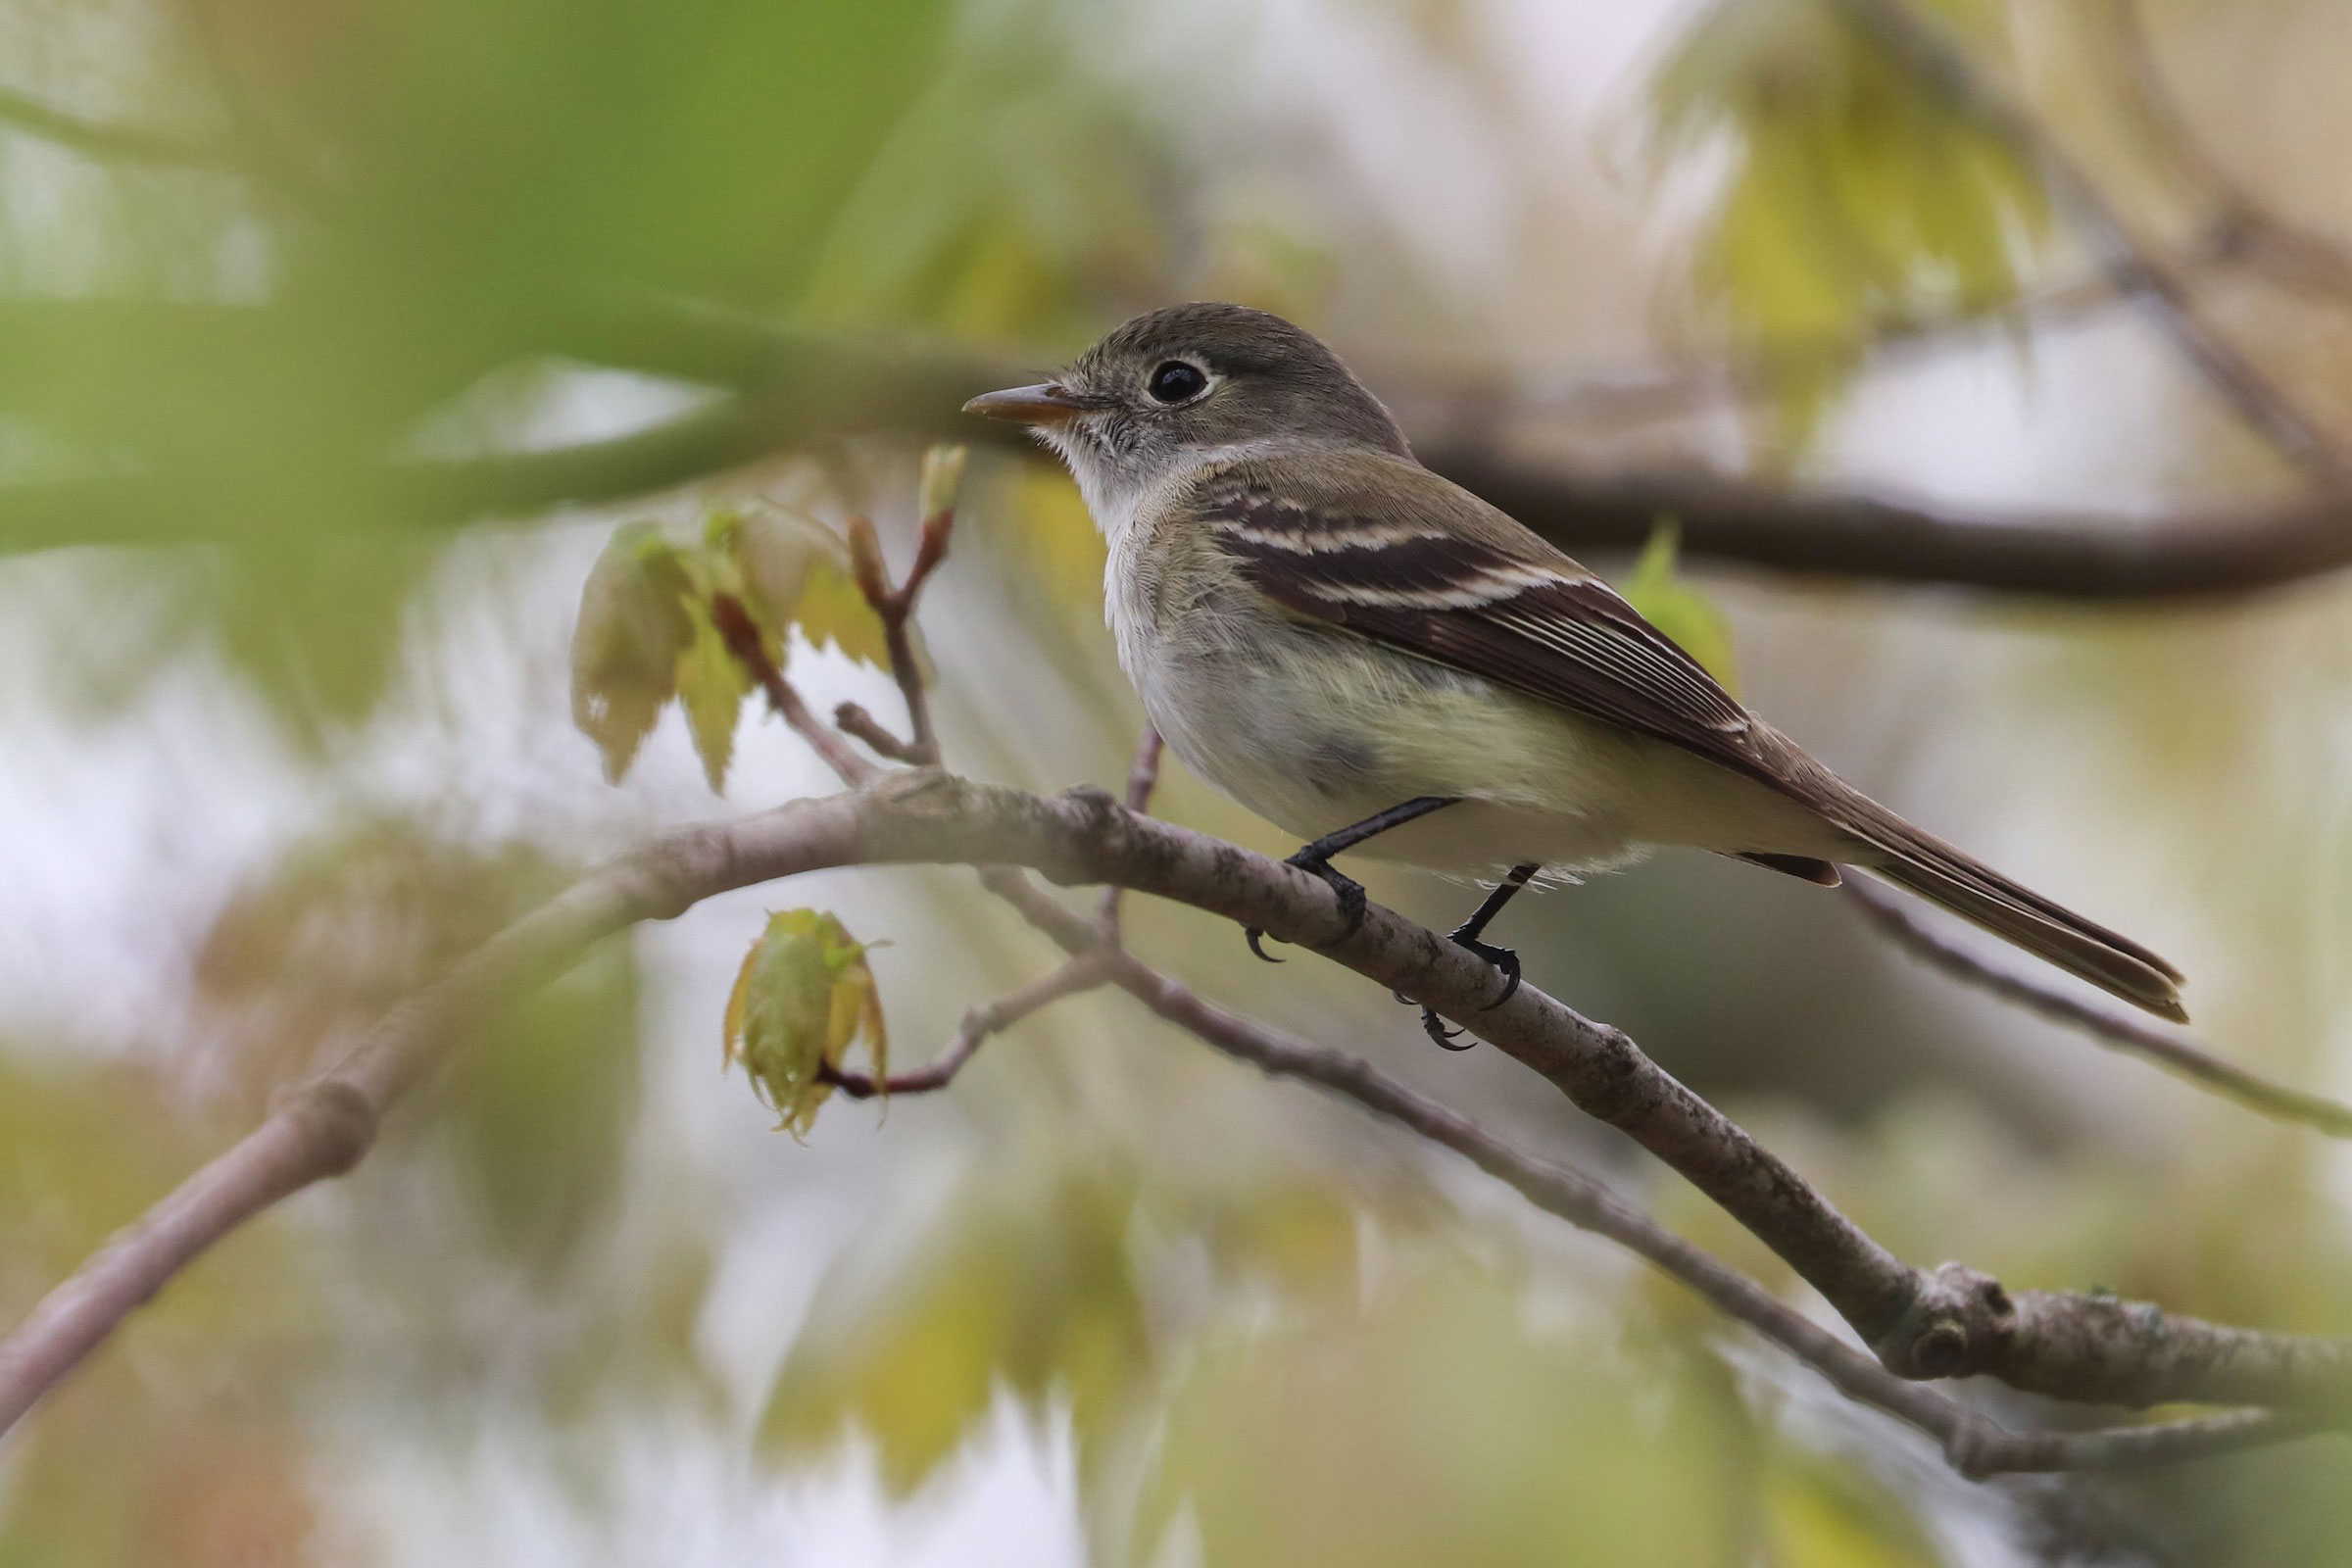
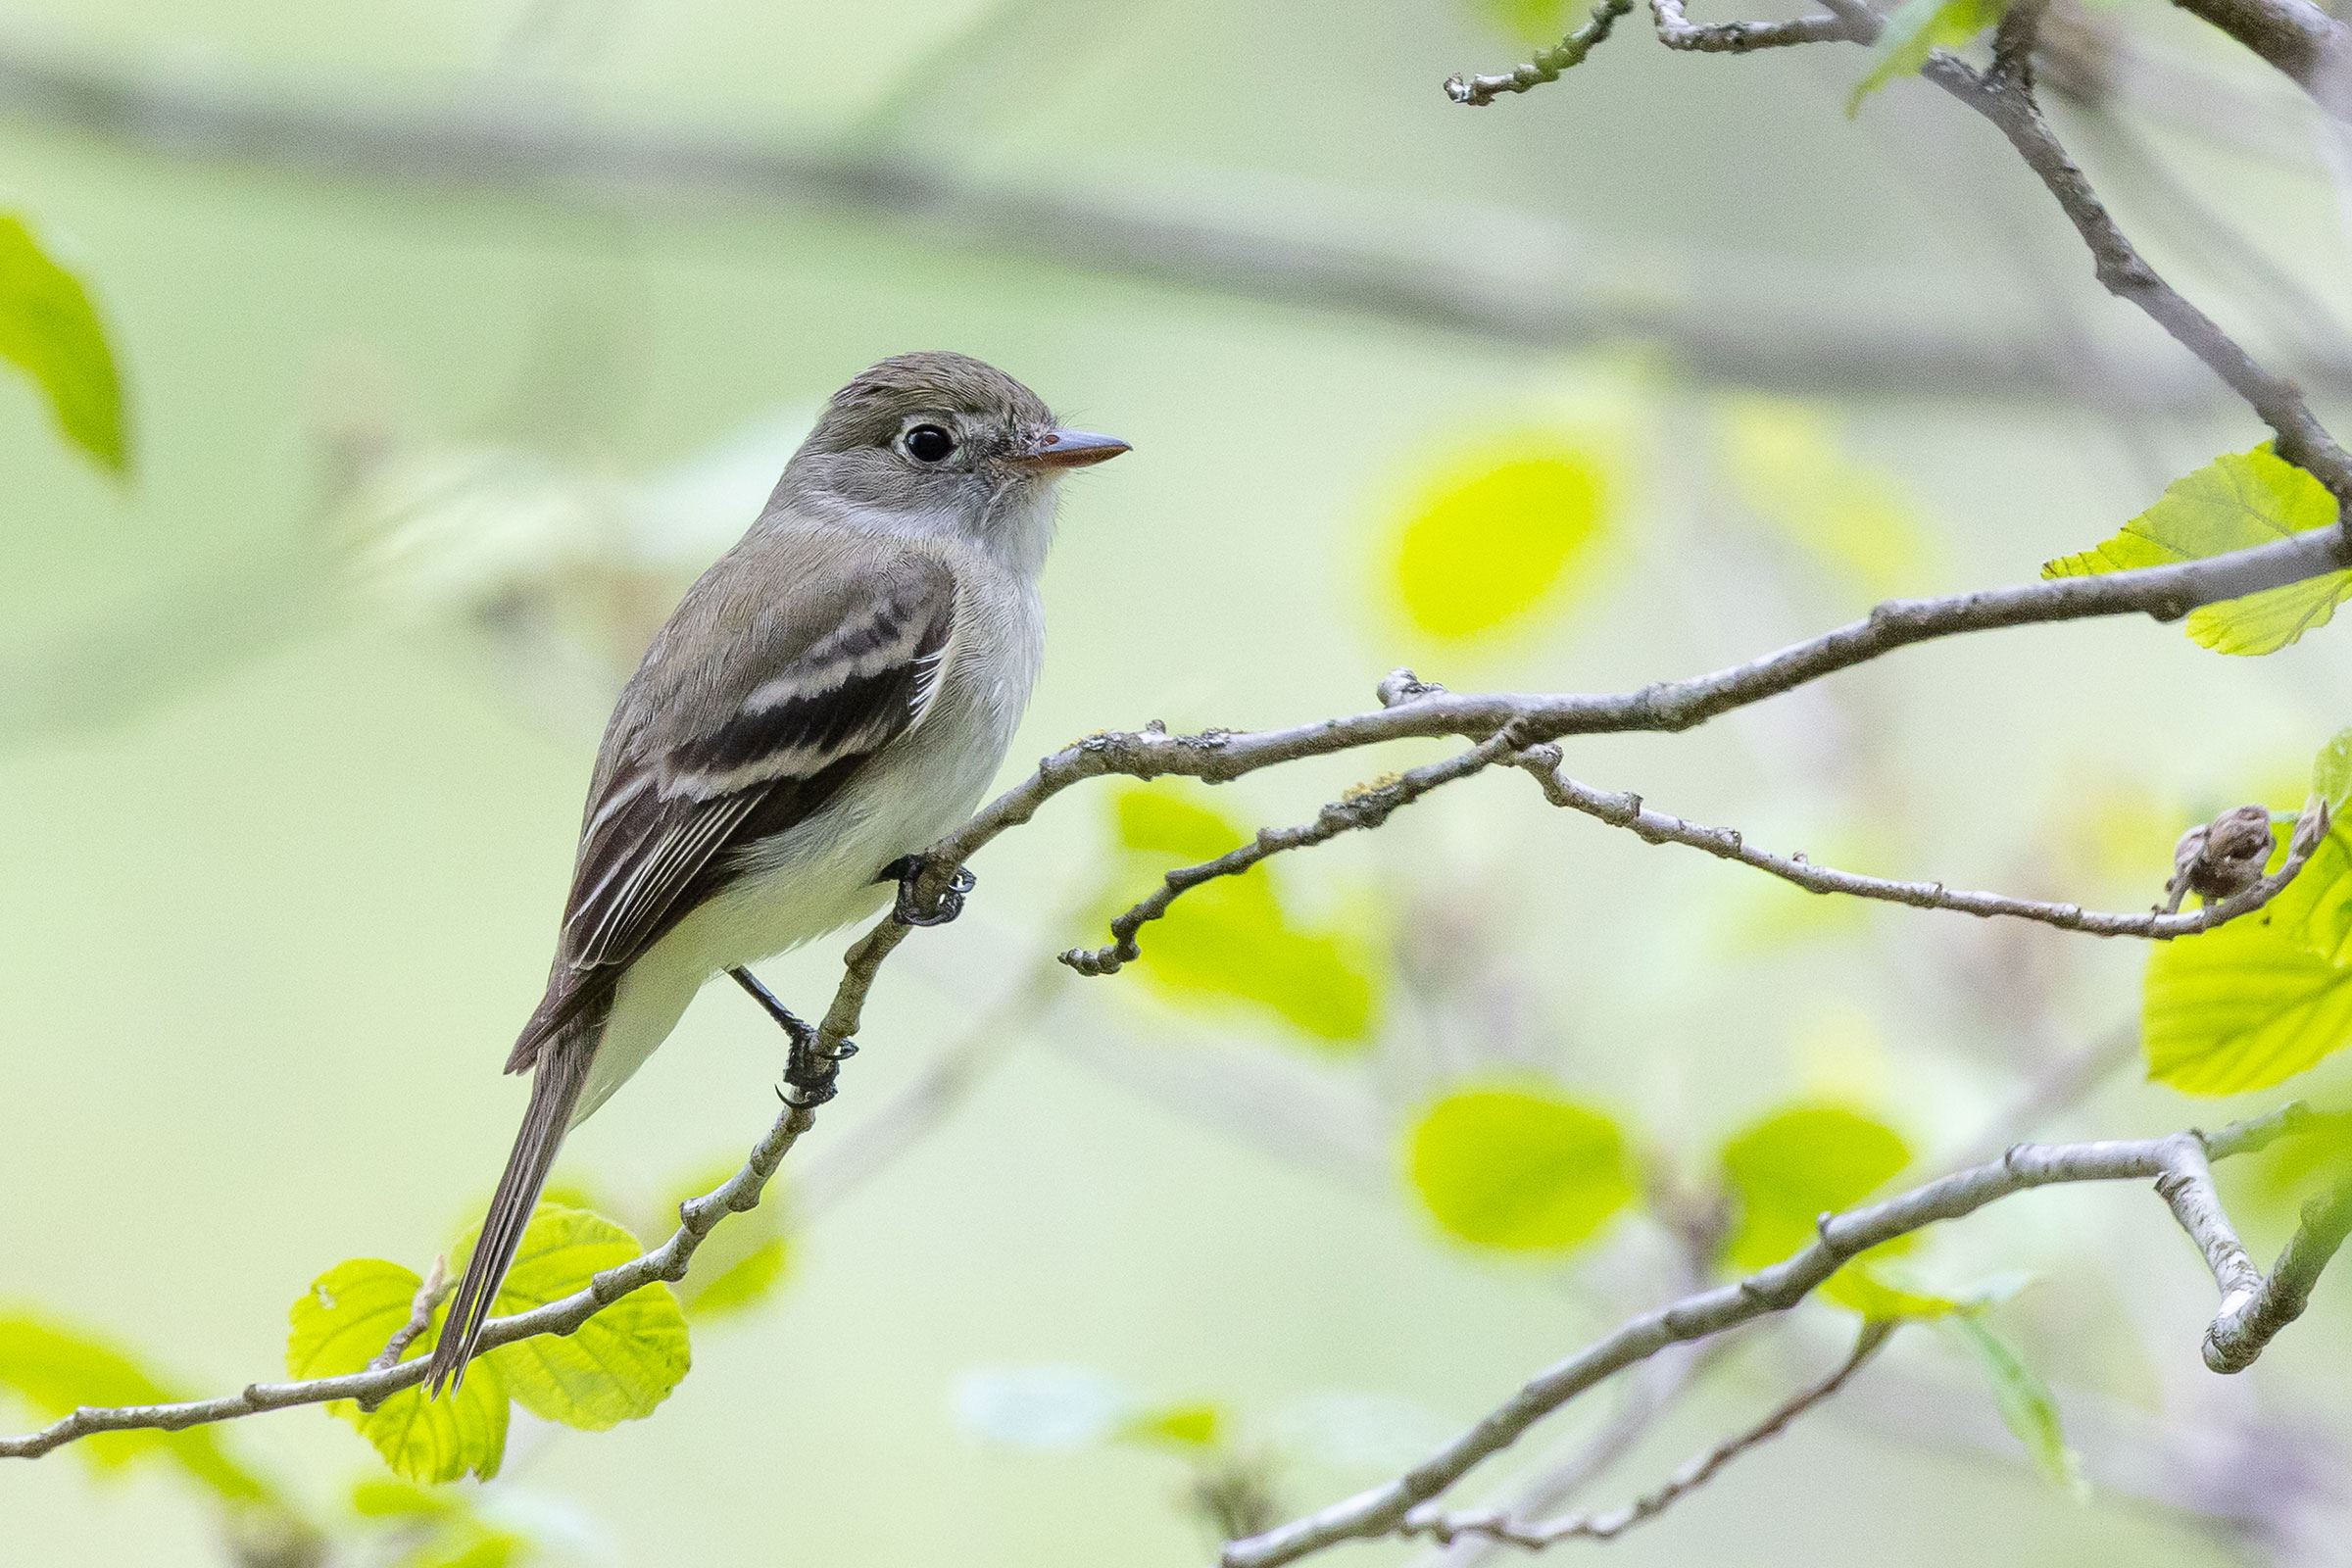
Introduction
Despite its small and unassuming appearance, the Least Flycatcher makes its presence known through its simple yet loud and emphatic two-parted che-bek vocalization. A woodland dweller, it is somewhat unique for its habit of aggregating multiple breeding territories into clusters (Taroff and Briskie 2020), with each territory being defended by its individual owner. Such defense extends to driving away other species, including both small and medium songbirds (Taroff and Briskie 2020), making the flycatcher a formidable foe for would-be avian nest predators. Interestingly, among the oldest recorded Least Flycatchers is an individual first banded in Virginia in 1977 and later recaptured and released in 1985 at age eight (Cornell Lab of Ornithology 2019).
Breeding Distribution
While Least Flycatchers sometimes occur in the Piedmont and Coastal Plain regions during migration, breeding is confined to the Mountains and Valleys region. There, they show an affinity for forest edges along higher-elevation ridges (typically greater than 2,500 ft (760 m); Rottenborn and Brinkley 2007), with a slightly positive association with forest cover. Accordingly, they are most likely to be found in the Mount Rogers area (Grayson and Smyth Counties), along the western rim of Burke’s Garden (Tazewell County), on the ridgelines of northern Giles County, and along the border with West Virginia in Augusta, Highland, Rockingham, and Shenandoah Counties (Figure 1).
Between Atlases (Figures 1 and 2), the likelihood of Least Flycatchers occurring in a block remained generally constant, with some localized decreases along the Blue Ridge Mountains and in areas of southwestern Virginia (Figure 3).
View Environmental Associations
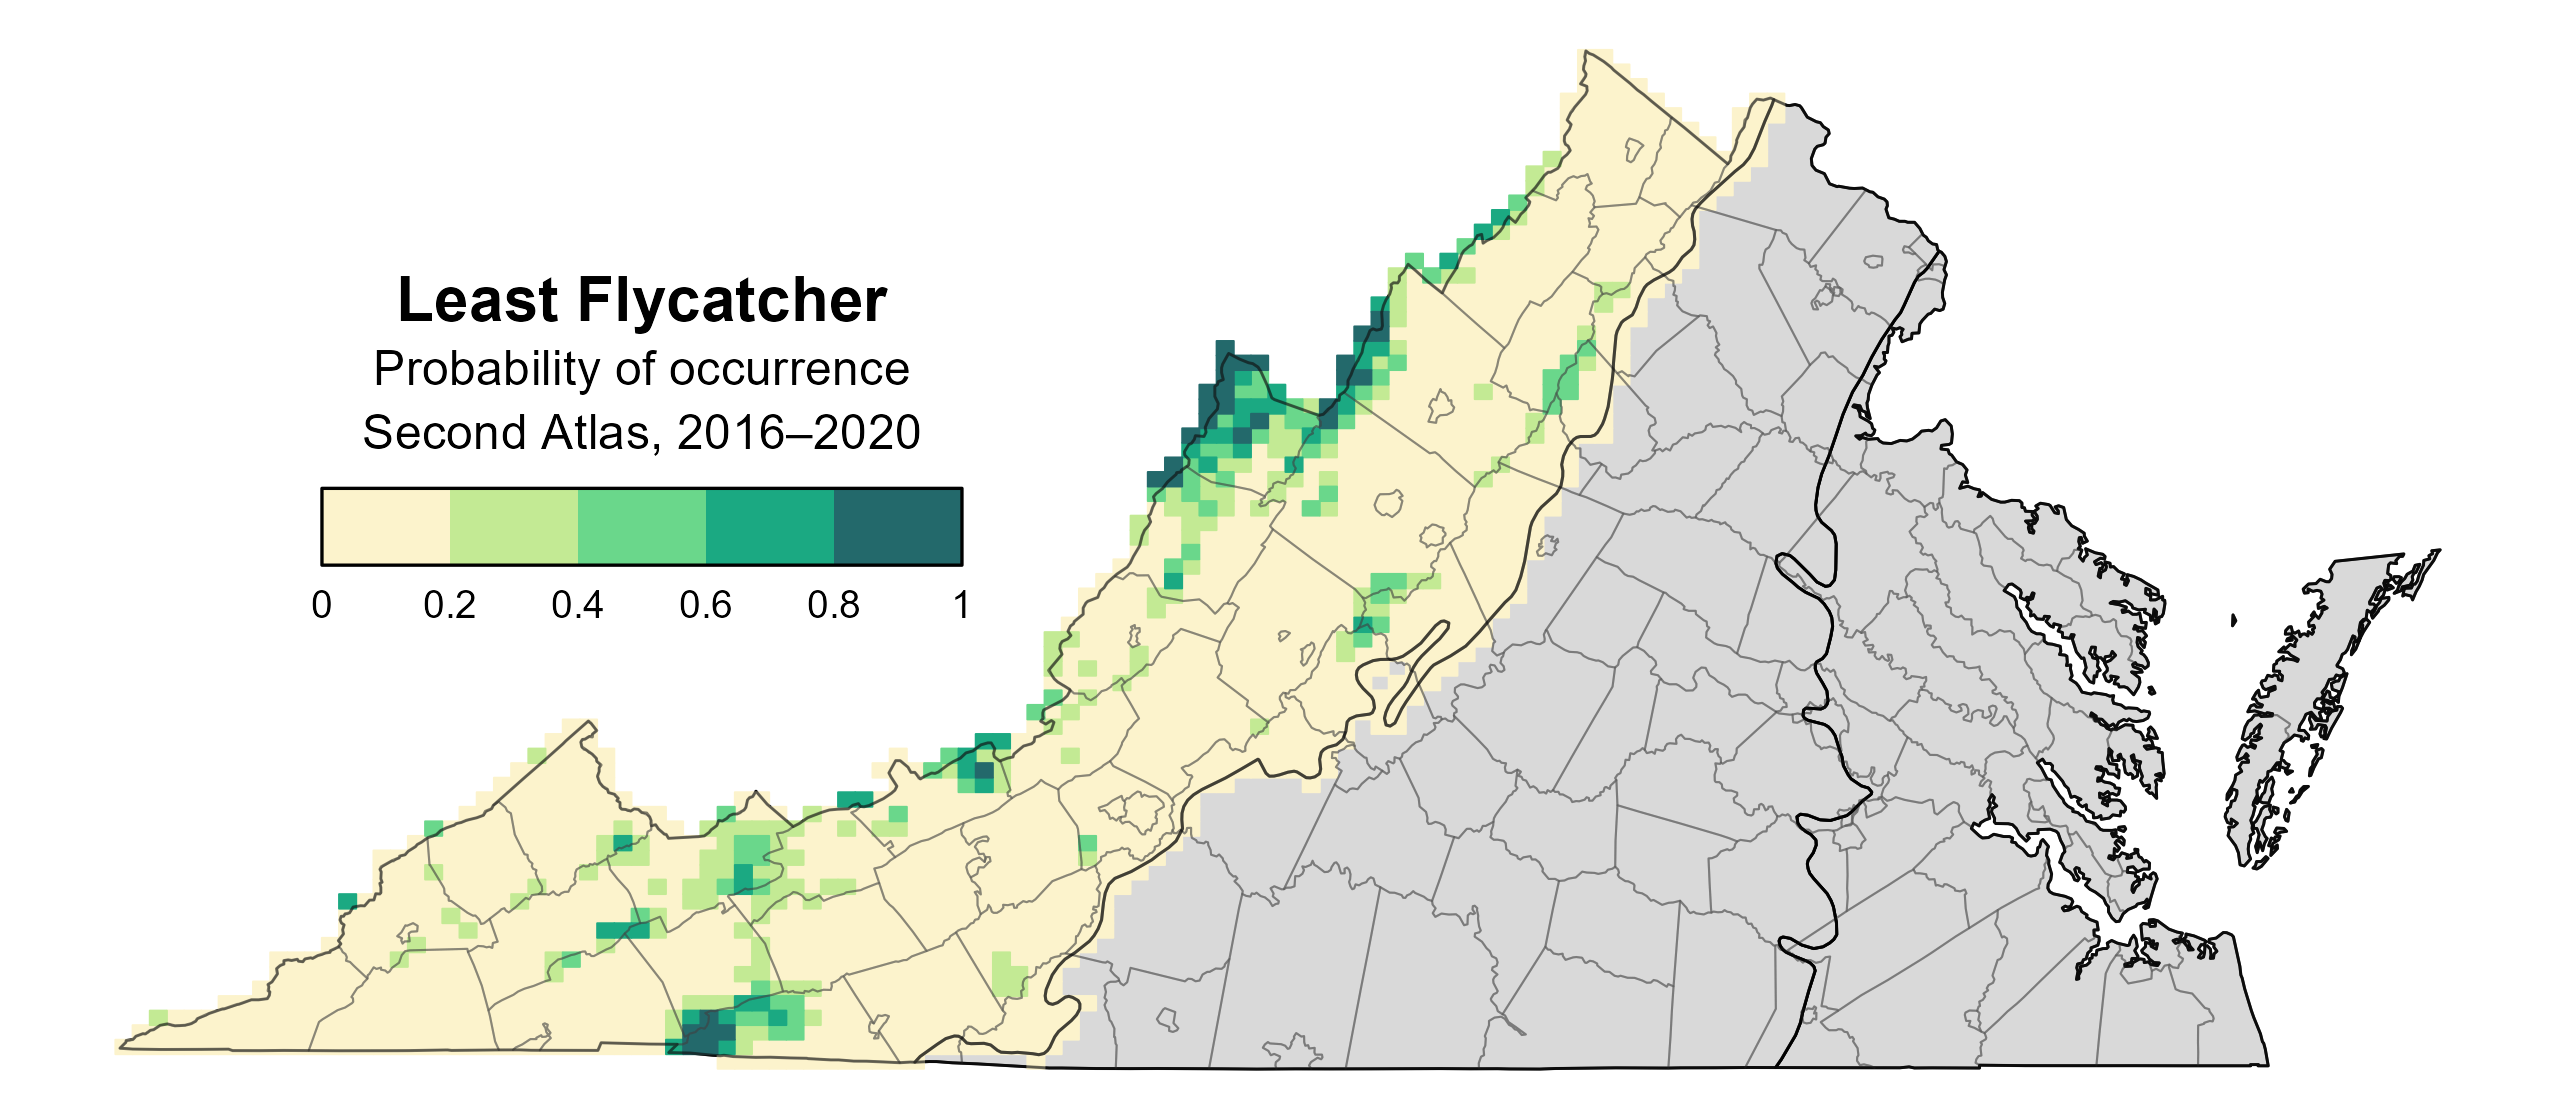
Figure 1: Least Flycatcher breeding distribution based on probability of occurrence (Second Atlas, 2016–2020). This map indicates the probability that this species will occur in an Atlas block (an approximately 10 mi2 [26 km2] survey unit) based on environmental (including habitat) factors and after adjusting for the probability of detection (variation in survey effort among blocks). Blocks in gray are outside the species’ core range and were not modeled.

Figure 2: Least Flycatcher breeding distribution based on probability of occurrence (First Atlas, 1985–1989). This map indicates the probability that this species will occur in an Atlas block (an approximately 10 mi2 [26 km2] survey unit) based on environmental (including habitat) factors and after adjusting for the probability of detection (variation in survey effort among blocks). Blocks in white were not surveyed during the First Atlas and were not modeled. Blocks in gray are outside the species’ core range and were not modeled.
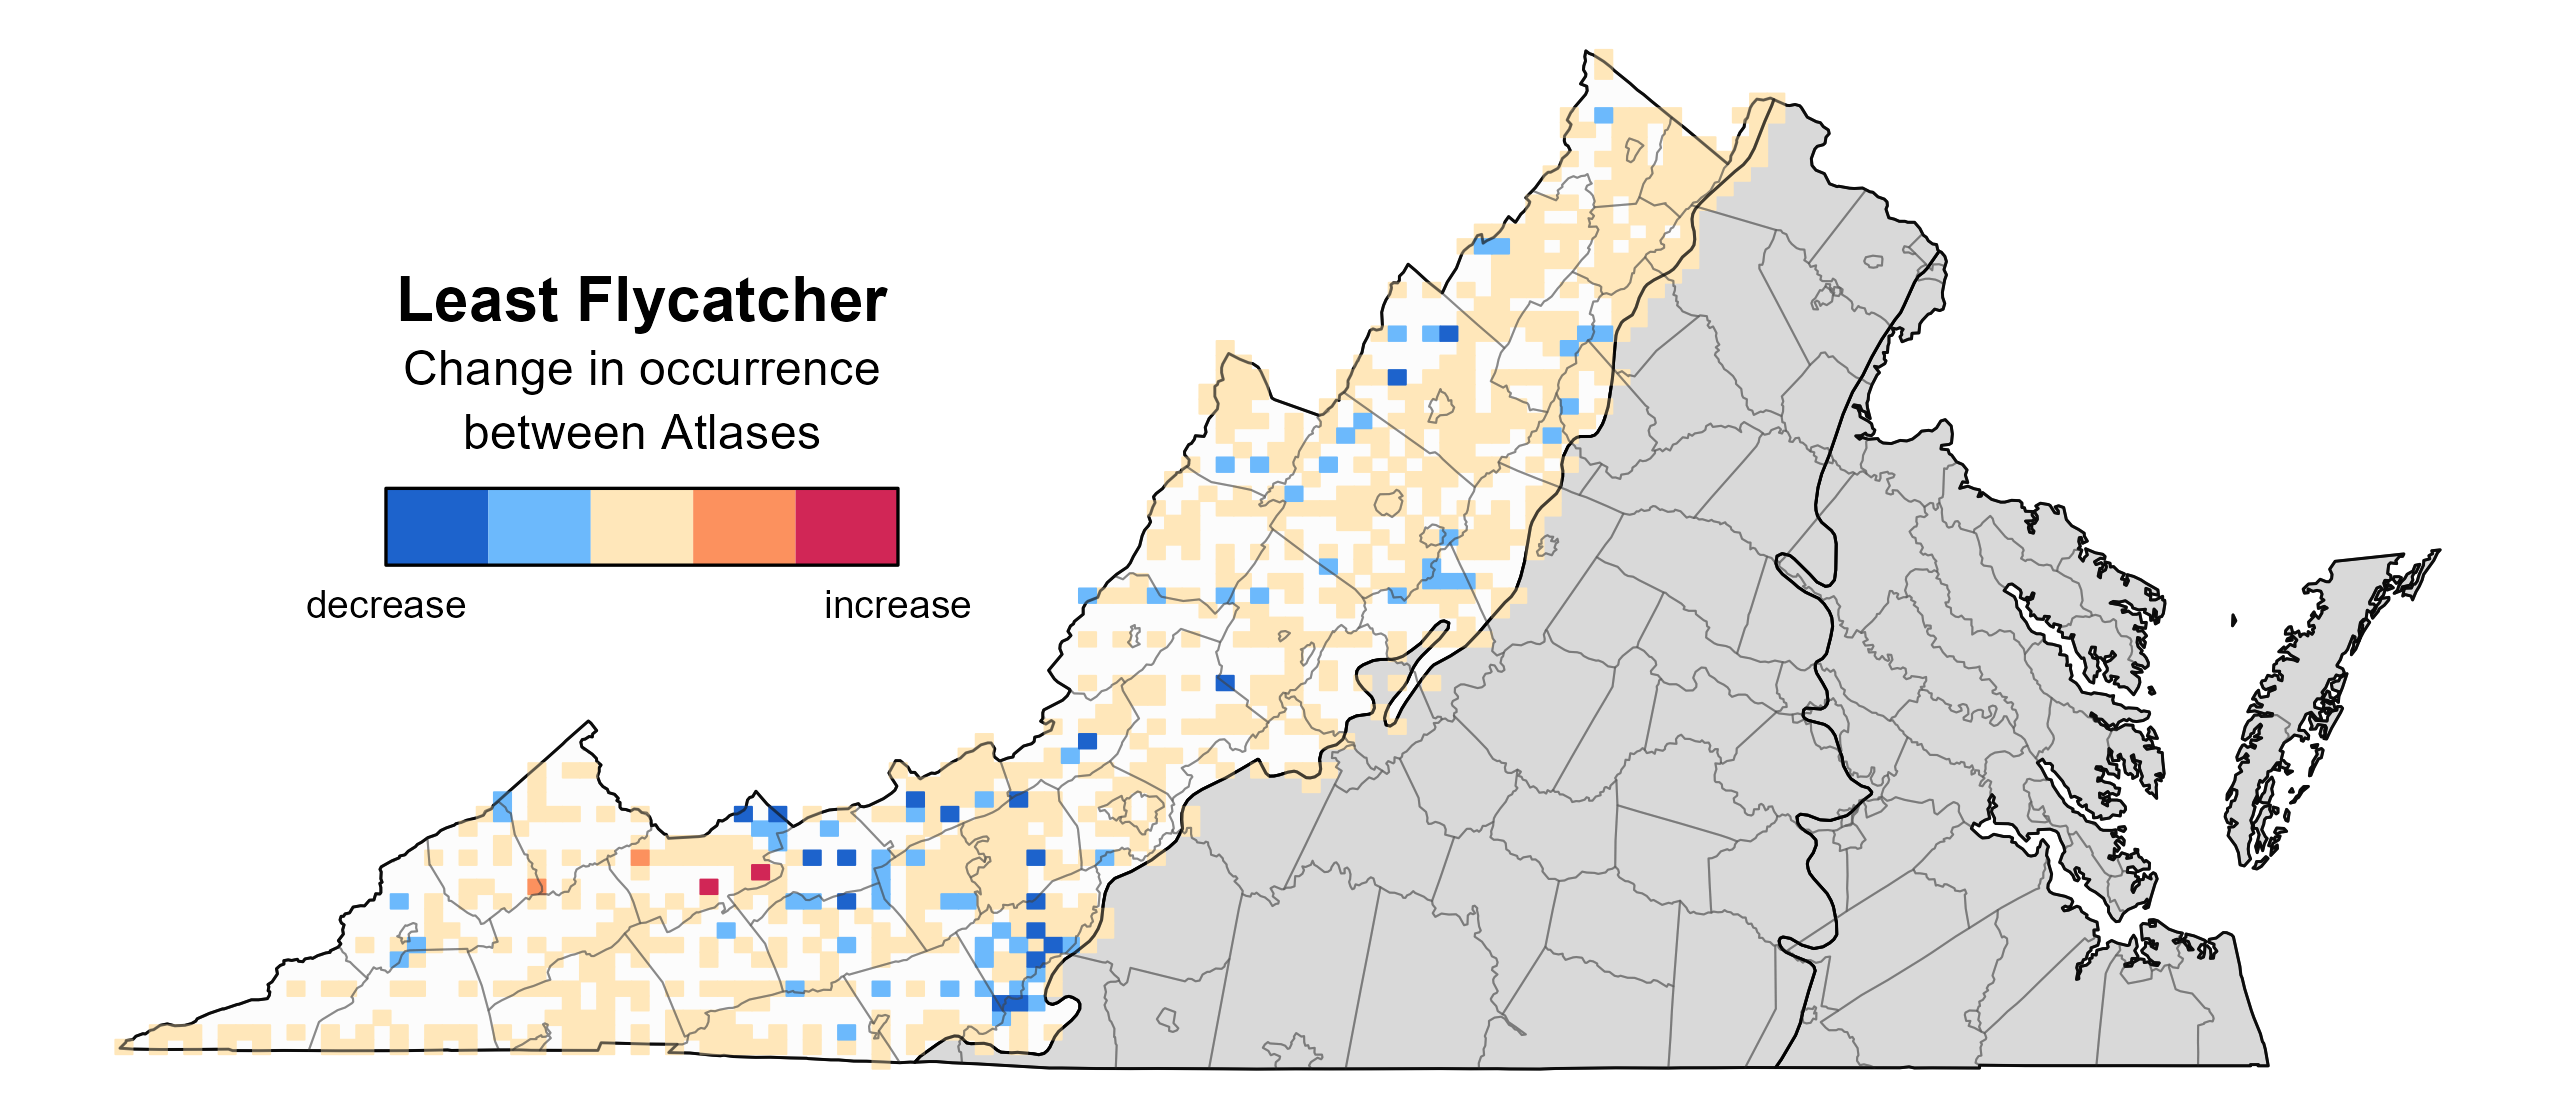
Figure 3: Least Flycatcher change in breeding distribution between Atlases (1985–1989 and 2016–2020) based on probability of occurrence. This map indicates the change in the probability that this species will occur in a block (an approximately 10 mi2 [26 km2] survey unit) between Atlas periods. Blocks with no change (tan) may have constant presence or constant absence. Blocks in white were not surveyed during the First Atlas and were not modeled. Blocks in gray are outside the species’ core range and were not modeled.
Breeding Evidence
Least Flycatchers were confirmed breeders in 12 blocks and nine counties and probable breeders in an additional five counties (Figure 4). Despite a declining population trend (see Conservation section), the species was observed in a greater number of blocks during the Second Atlas, and breeding evidence was documented in many of the same areas as during the First Atlas (Figure 5). The greater survey effort expended during the Second Atlas may have contributed to this result.
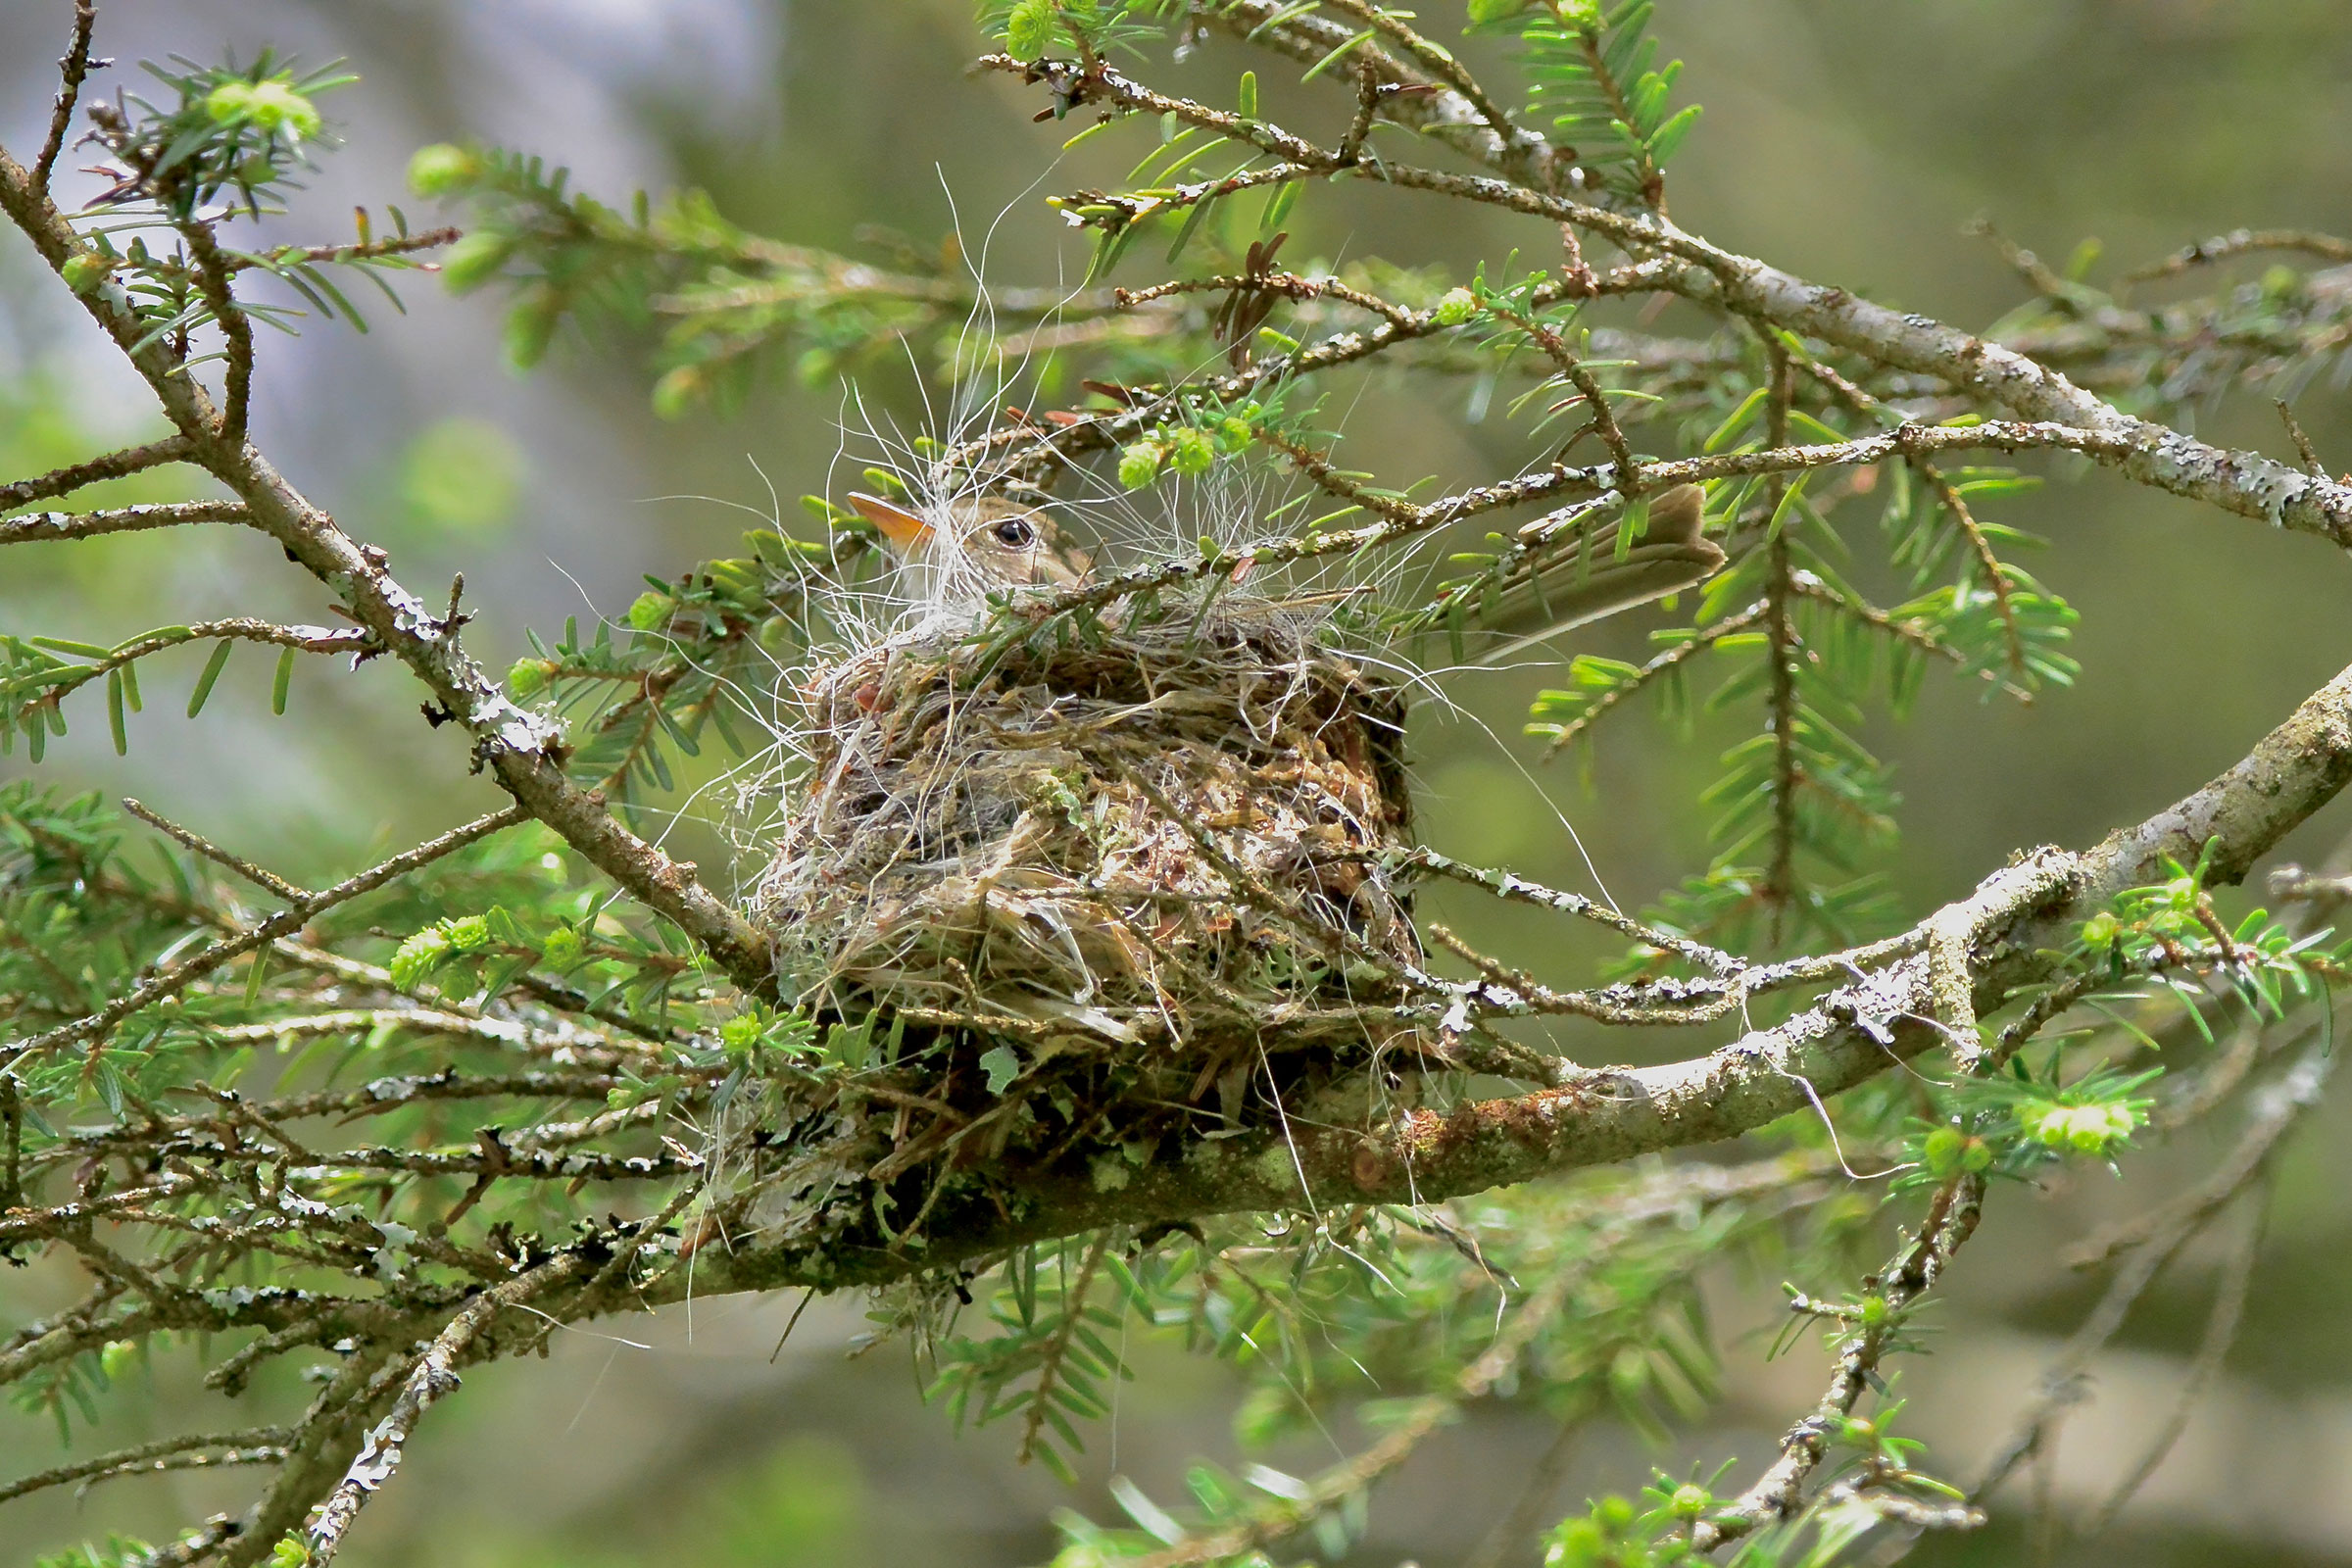
Volunteers confirmed breeding mainly through observations of occupied nests (May 14 – 31) and adults carrying food (June 11 – 16), but each was limited to only a few records (Figure 6). Nests are constructed in the crotches of deciduous trees located in the mid-canopy, making them difficult to observe. For more general information on the breeding habits of this species, please visit All About Birds.
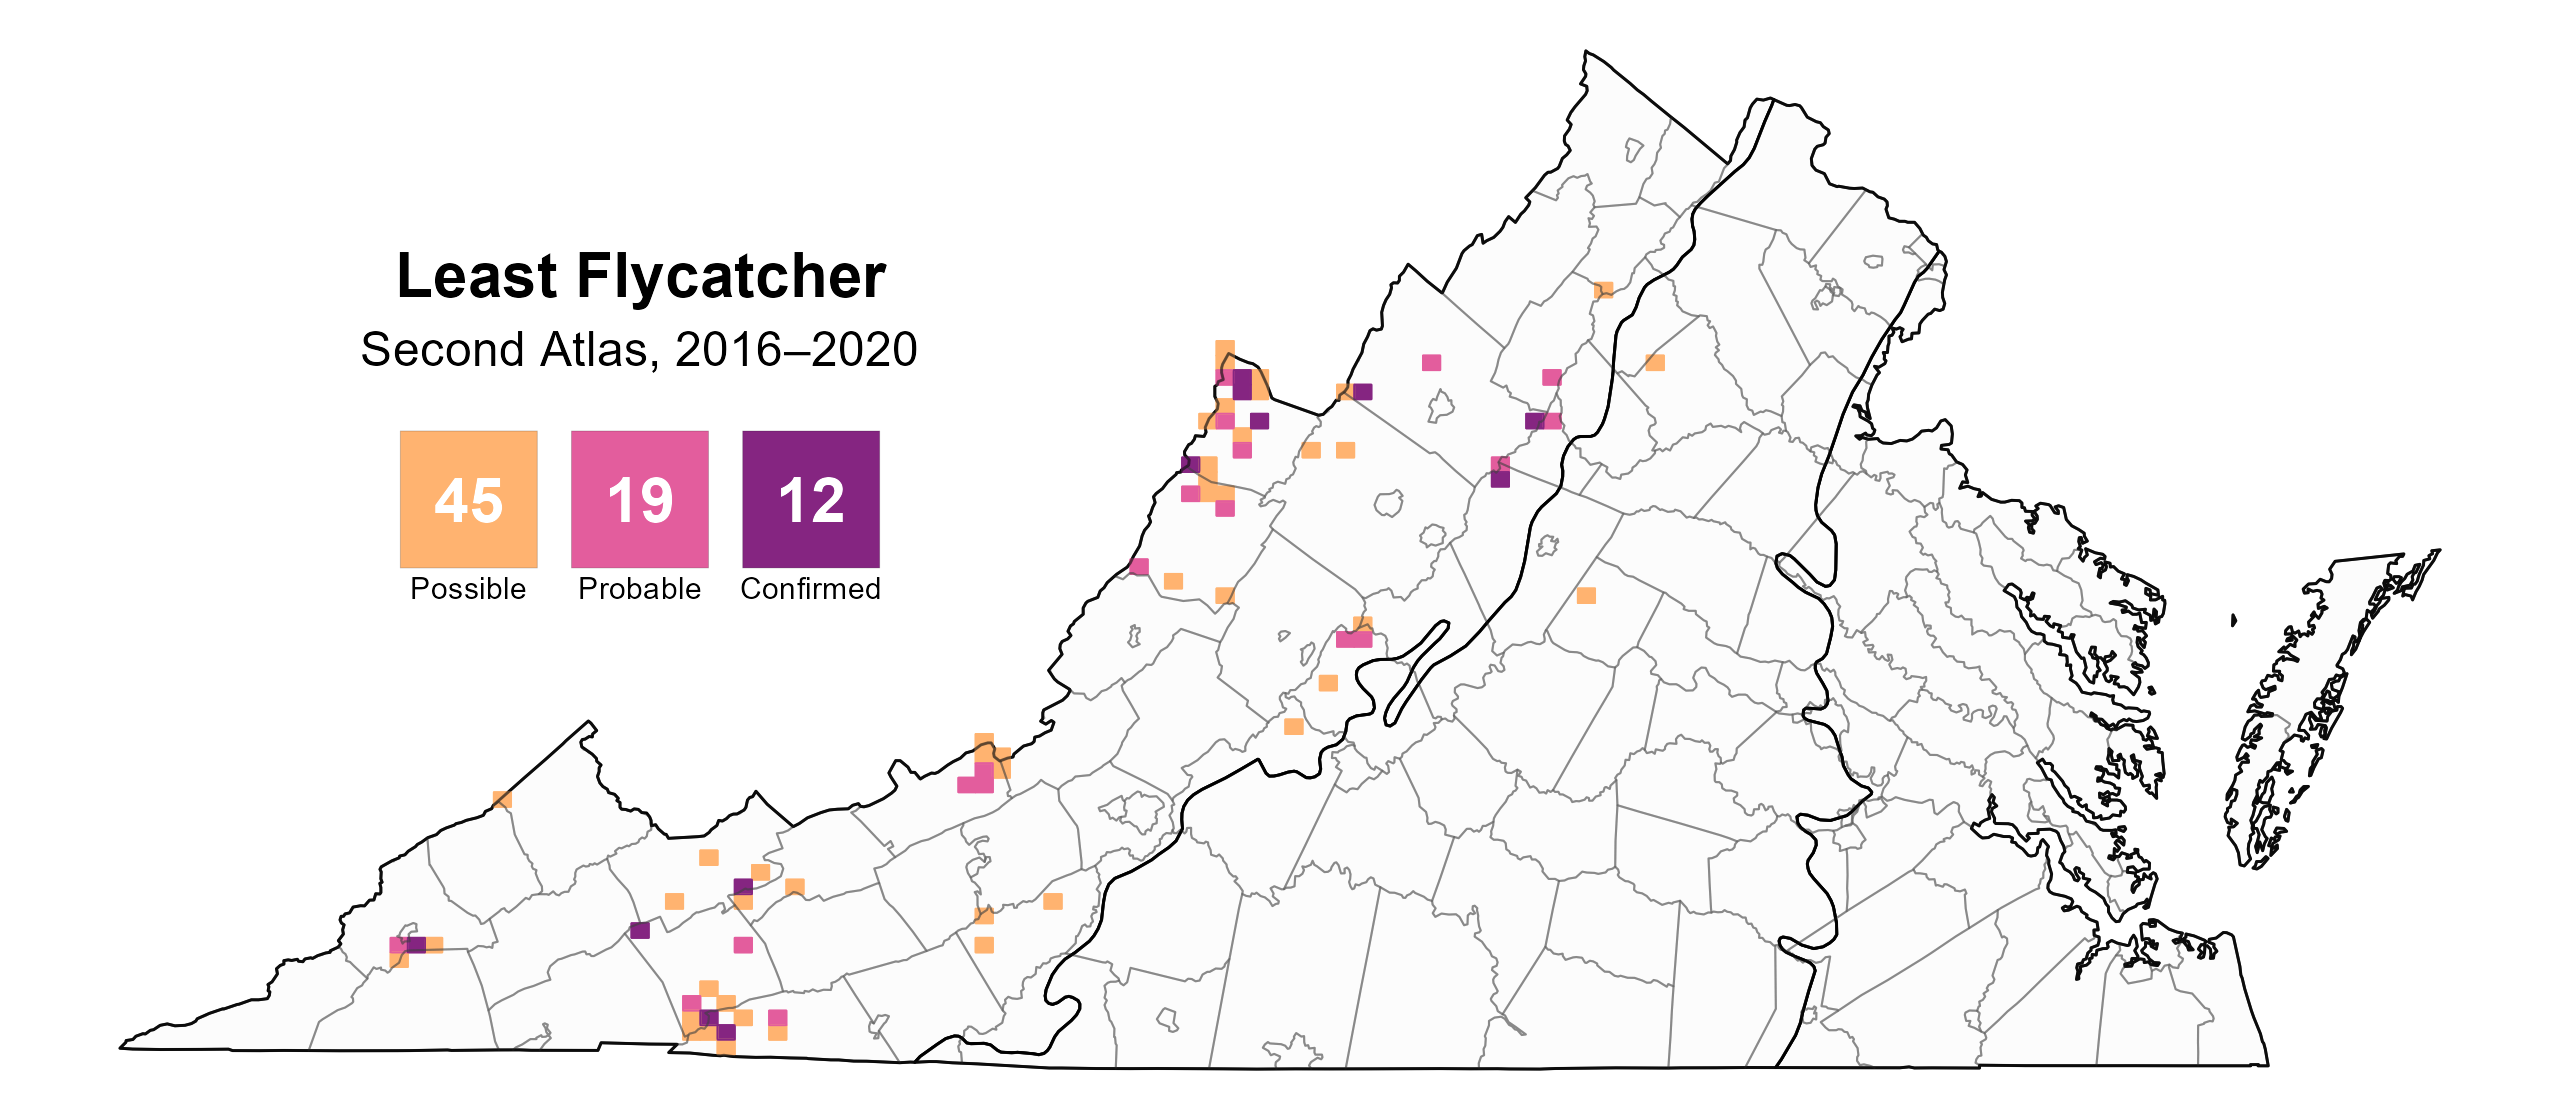
Figure 4: Least Flycatcher breeding observations from the Second Atlas (2016–2020). The colored boxes illustrate Atlas blocks (approximately 10 mi2 [26 km2] survey units) where the species was detected. The colors show the highest breeding category recorded in a block. The numbers within the colors in the legend correspond to the number of blocks with that breeding evidence category.
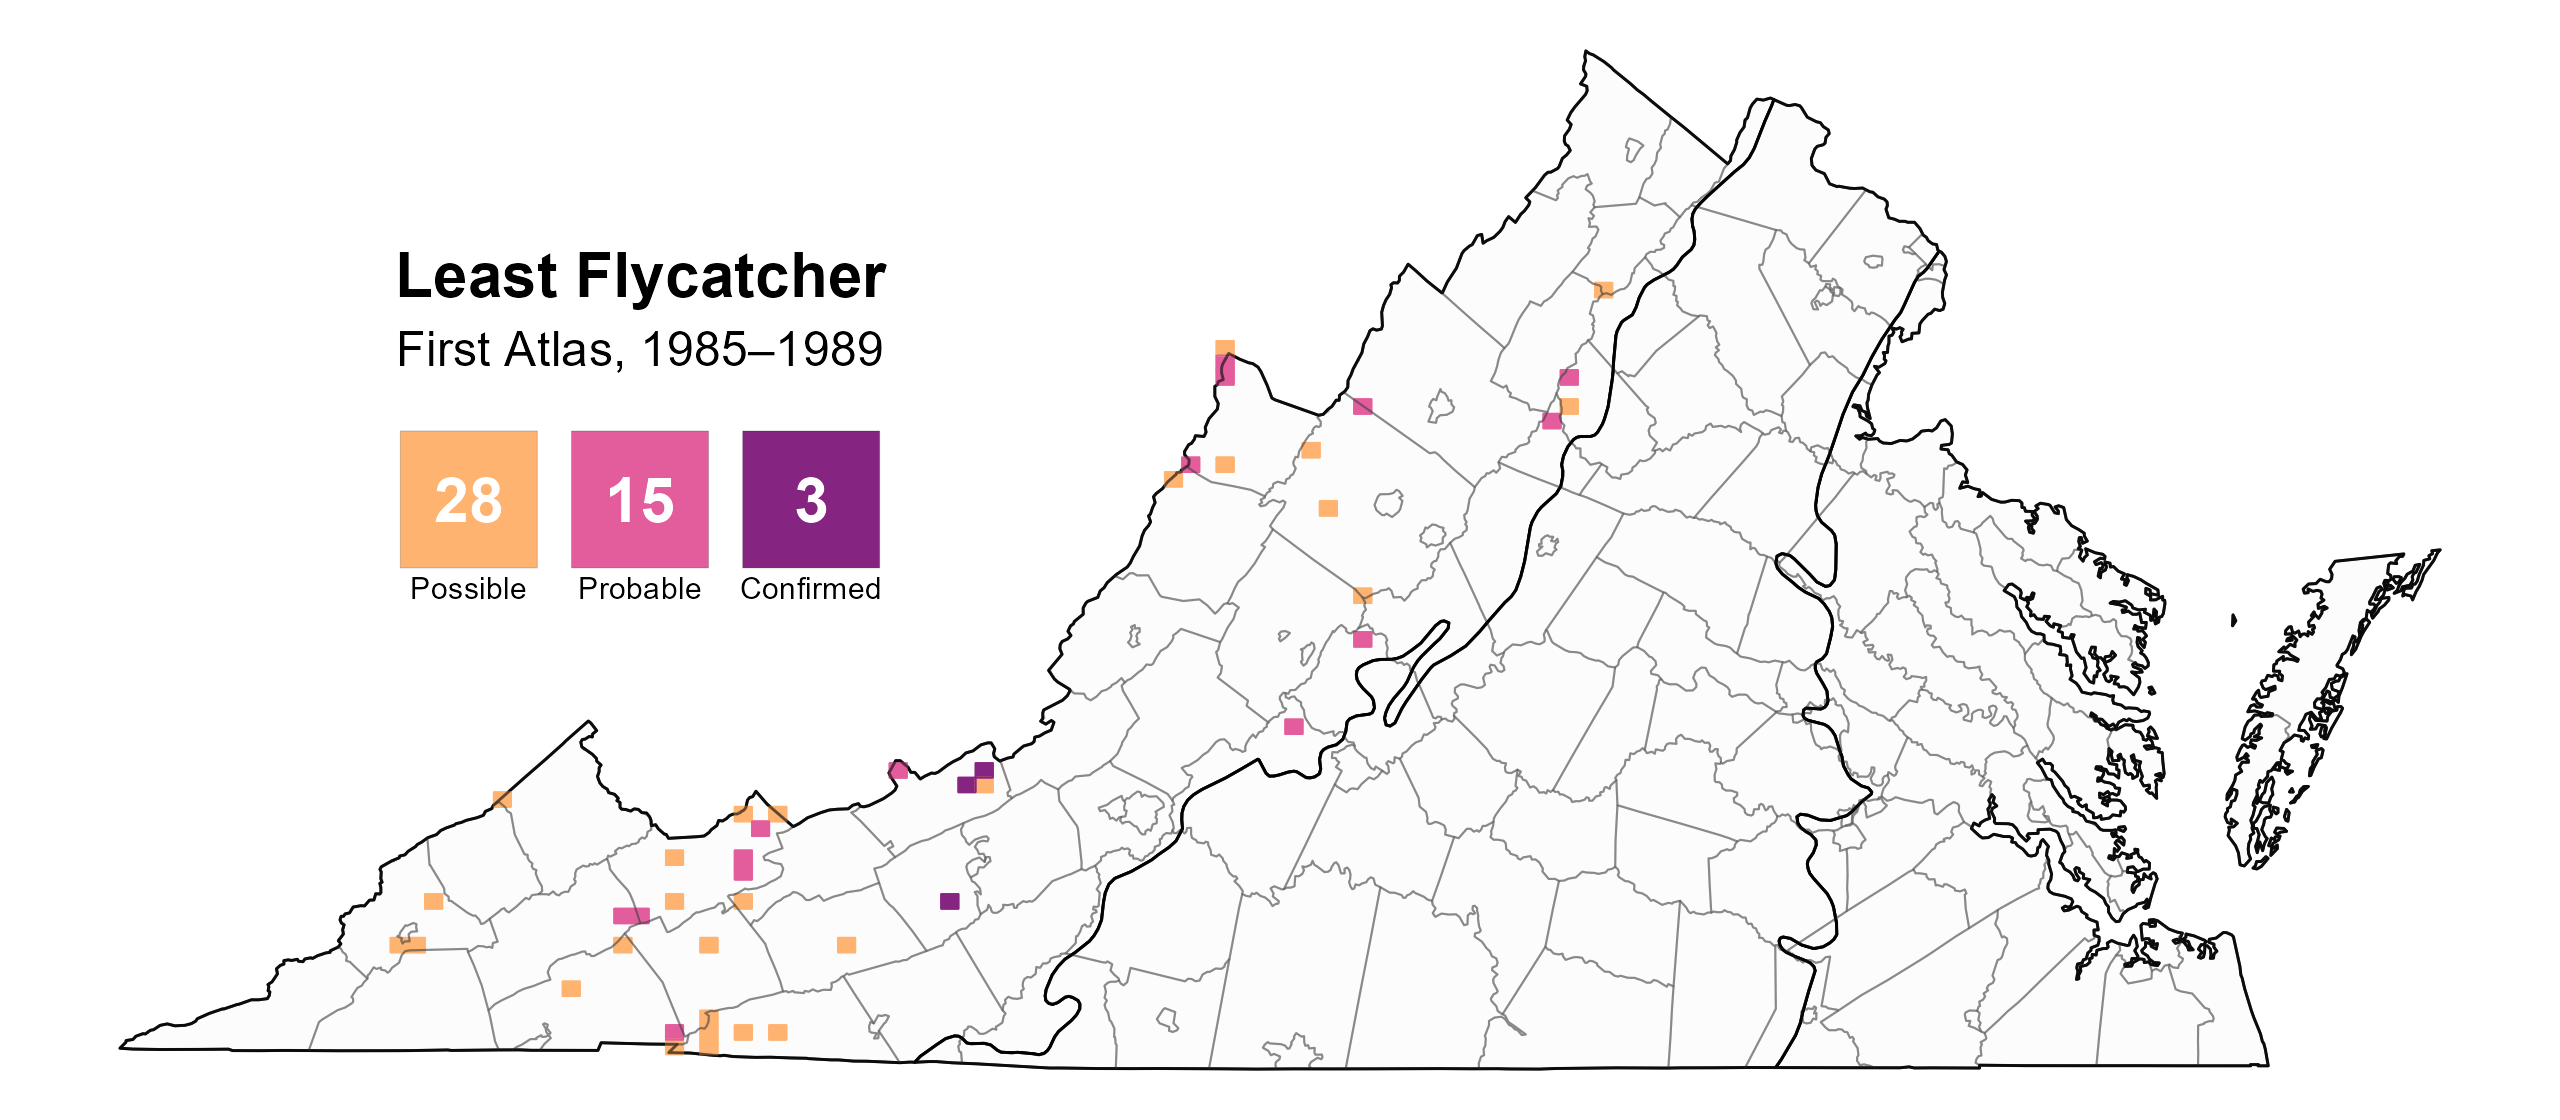
Figure 5: Least Flycatcher breeding observations from the First Atlas (1985–1989). The colored boxes illustrate Atlas blocks (approximately 10 mi2 [26 km2] survey units) where the species was detected. The colors show the highest breeding category recorded in a block. The numbers within the colors in the legend correspond to the number of blocks with that breeding evidence category.

Figure 6: Least Flycatcher phenology: confirmed breeding codes. This graph shows a timeline of confirmed breeding behaviors. Tick marks represent individual observations of the behavior.
Population Status
The Least Flycatcher was detected at only 35 points during the Atlas point counts, preventing development of an abundance model. North American Breeding Bird Survey (BBS) population trends for Virginia are not credible; however, the BBS data for the Appalachian Mountains showed a significant decrease of 2.26% per year from 1966–2022 (Figure 7; Hostetler et al. 2023). Between Atlases, BBS data showed a significant decline of 3.6% per year from 1987–2018 for that region.
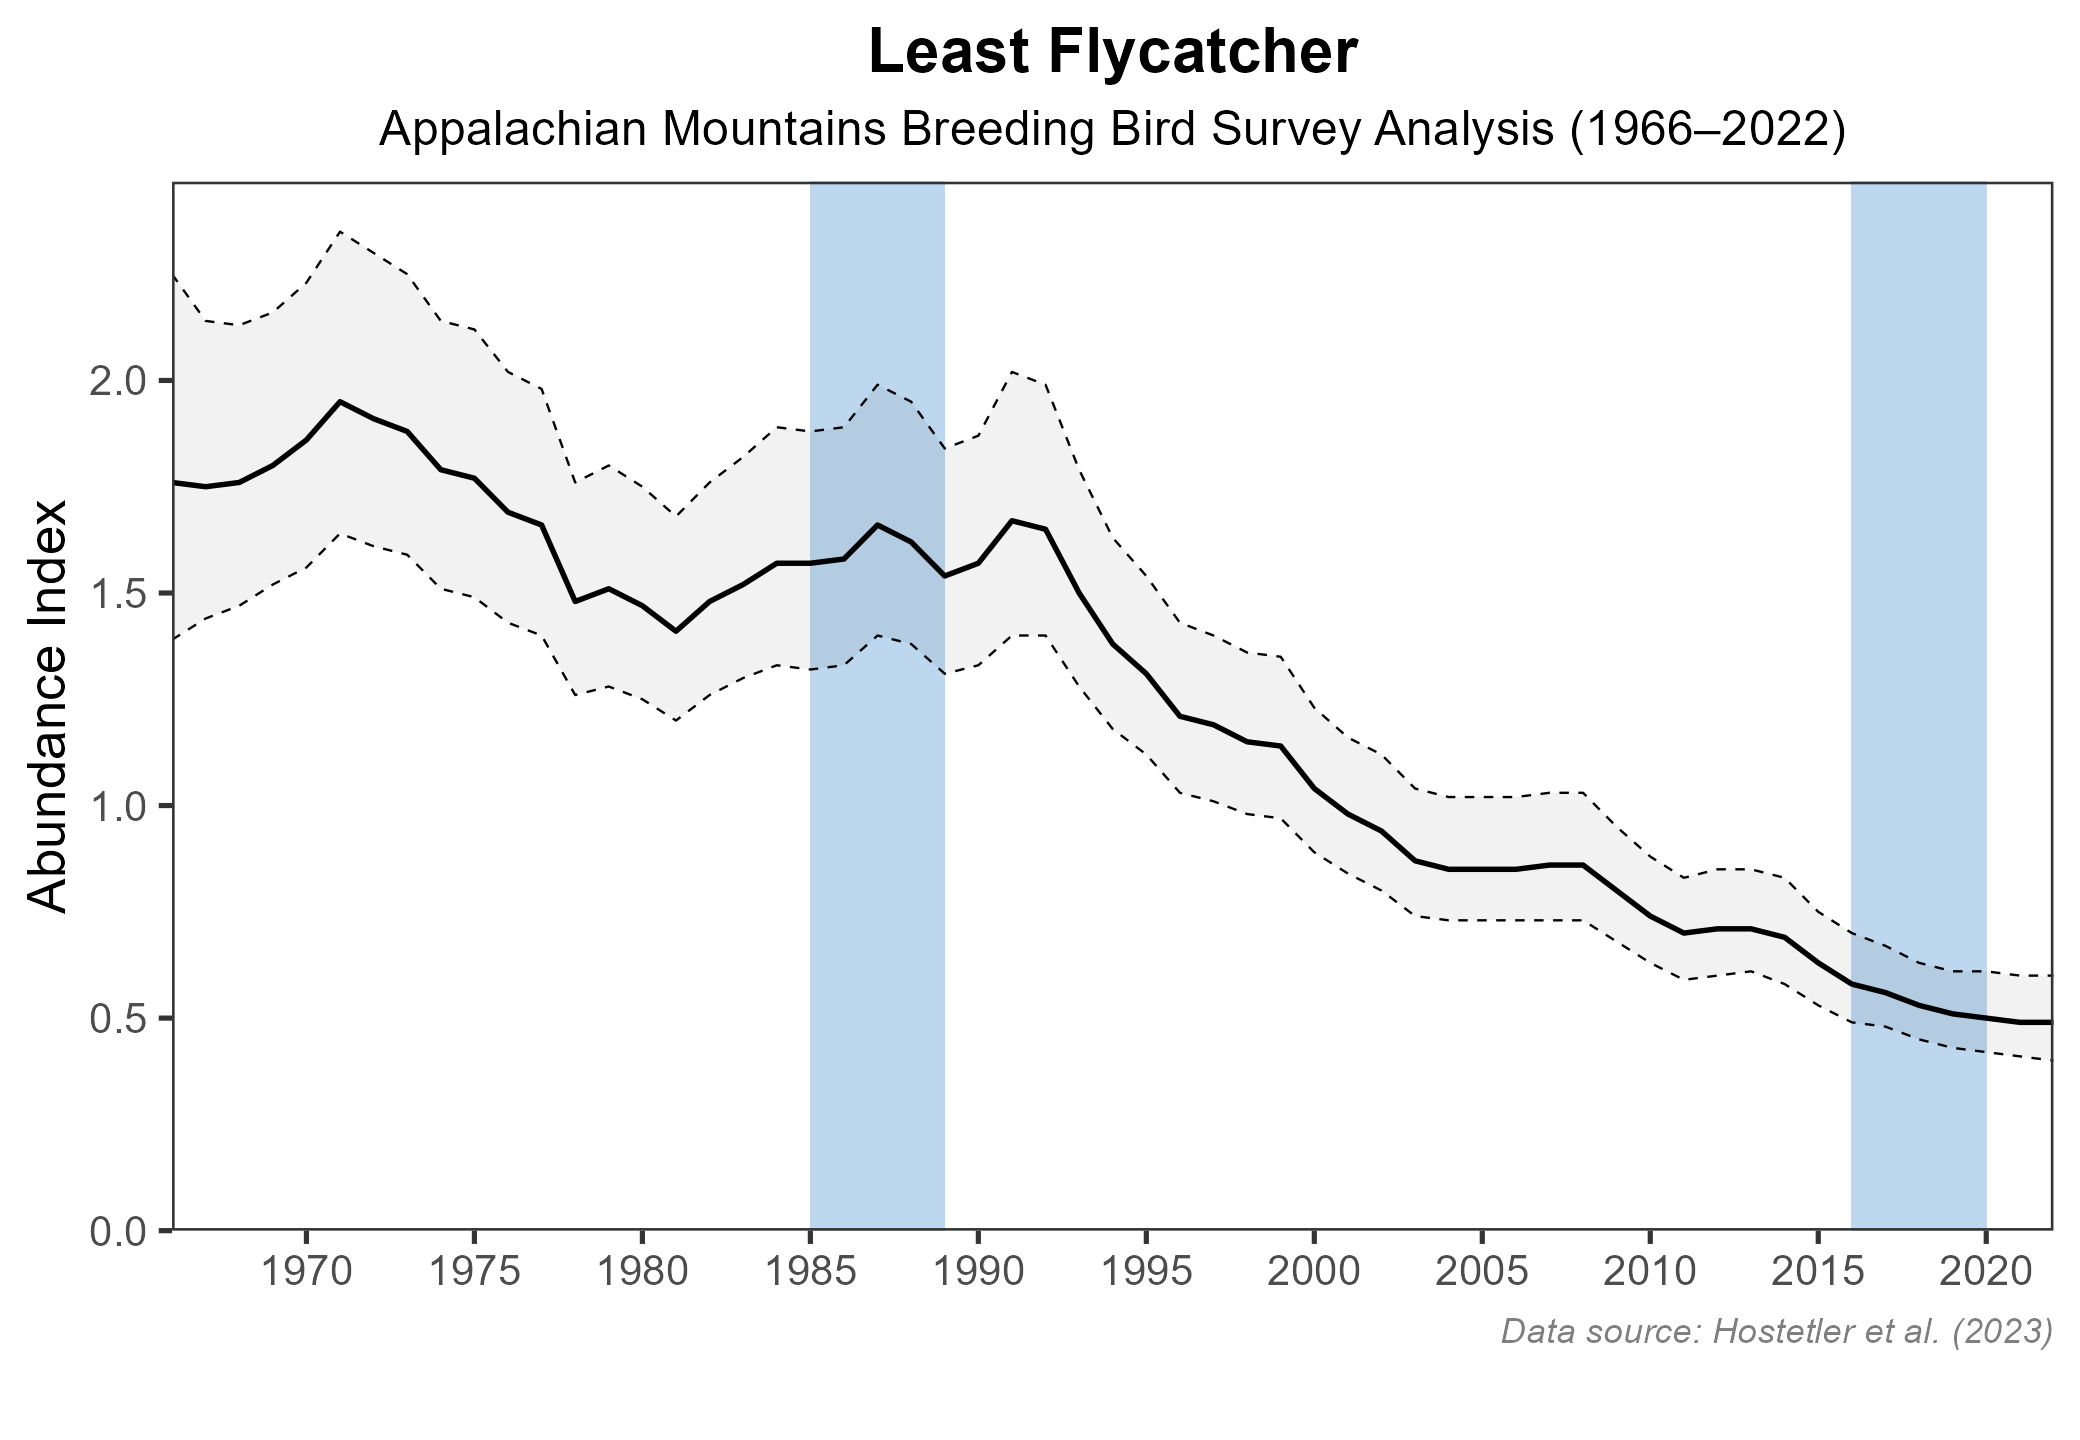
Figure 7: Least Flycatcher population trend for the Appalachian Mountains as estimated by the North American Breeding Bird Survey. The vertical axis shows species abundance; the horizontal axis shows the year. The solid line indicates the estimated population trend; there is a 97.5% probability that the true population trend falls between the dashed lines. The shaded bars indicate the First and Second Atlas periods.
Conservation
Although a population estimate for the Least Flycatcher could not be derived from Atlas data, the species was found at only 4% of over 1,300 points surveyed in high-elevation habitat in Virginia (Lessig 2008). This, along with its patchy distribution, suggests that its population size in the Commonwealth is relatively small. This small population size, in combination with the species’ declining trend, forms the basis of the flycatcher’s classification as a Tier II (Very High Conservation Need) Species of Greatest Conservation Need in the 2025 Virginia Wildlife Action Plan (VDWR 2025).
Although it breeds at higher elevations, the Least Flycatcher was not found to be elevation-sensitive in a Virginia study of high-island birds, as its presence did not increase with increasing elevation (Lessig 2008). In fact, the species appears to have bred below 1,400 ft (427 m) in extreme southwestern Virginia in the past (Rottenborn and Brinkley 2007). This flexibility may make it more resilient to climate change, which is a threat to isolated, high-elevation habitats in Virginia.
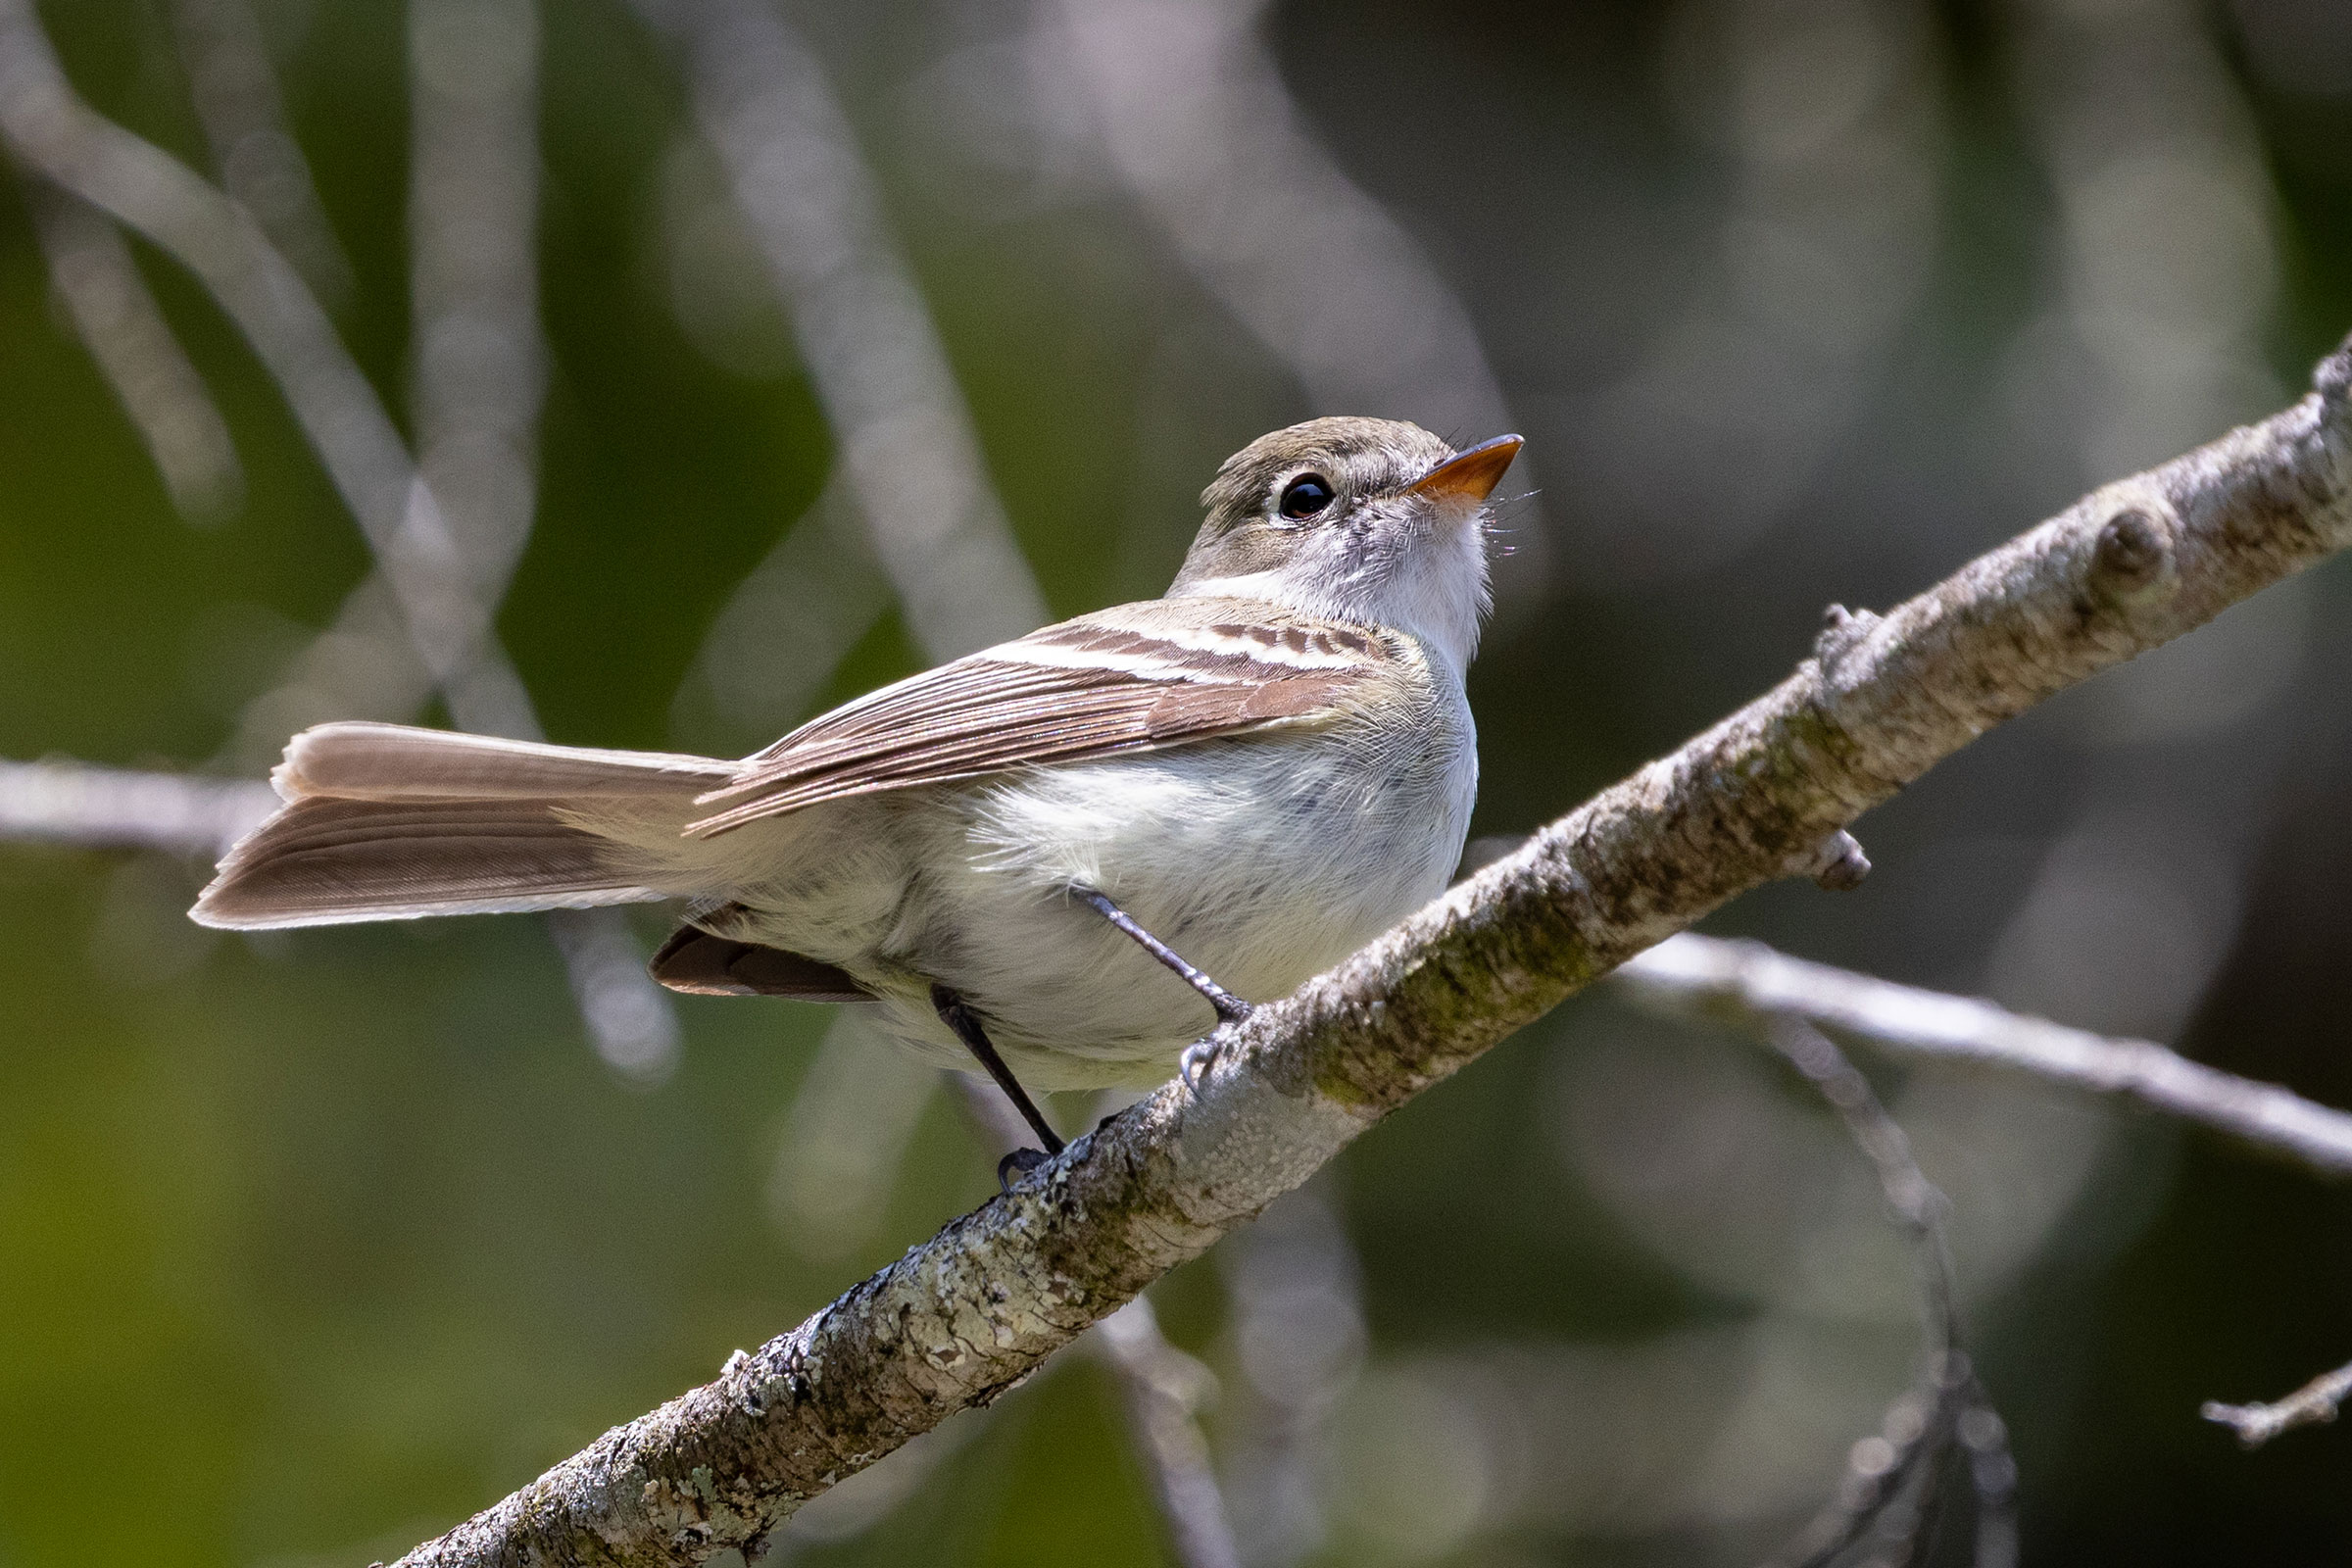
Least Flycatchers are woodland birds whose specific habitat preferences in Virginia are not well-documented. Elsewhere in their eastern range, the bird is associated with second growth to mature forests. They can be common in forest patches as small as 2.5 acres (1 hectare) and are often associated with forest clearings and edges (Tarof and Briskie 2020), which is supported by Atlas modeling. As with other forest-dependent birds, the most valuable conservation action is to prevent forest loss. However, the species’ response to forest disturbance, fragmentation, and management requires more study (Taroff and Briskie 2020).
The reasons for Least Flycatcher declines are not completely understood and may be taking place at different stages of its full annual cycle, including during migration and the non-breeding period. Investigating the factors involved might require multiple approaches, including ecological and reproductive studies in Virginia and across its broader Appalachian breeding range. These could be complemented by tracking studies to better understand what portions of its wintering range, which currently is known to include southern Florida, the Gulf Coast, and Central America, are used by Appalachian breeders (Taroff and Briskie 2020).
Interactive Map
The interactive map contains up to six Atlas layers (probability of occurrence for the First and Second Atlases, change in probability of occurrence between Atlases, breeding evidence for the First and Second Atlases, and abundance for the Second Atlas) that can be viewed one at a time. To view an Atlas map layer, mouse over the layer box in the upper left. County lines and physiographic regional boundaries (Mountains and Valleys, Piedmont, and Coastal Plain) can be turned on and off by checking or unchecking the box below the layer box. Within the map window, users can hover on a block to see its value for each layer and pan and zoom to see roads, towns, and other features of interest that are visible beneath a selected layer.
View Interactive Map in Full Screen
References
Cornell Lab of Ornithology (2019). All about birds. Cornell Lab of Ornithology, Ithaca, NY, USA. https://www.allaboutbirds.org.
Hostetler, J. A., J. R. Sauer, J. E. Hines, D. Ziolkowski, and M. Lutmerding (2023). The North American breeding bird survey, analysis results 1966–2022. U.S. Geological Survey, Laurel, MD, USA. https://doi.org/10.5066/P9SC7T11.
Lessig, H. (2008). Species distribution and richness patterns of bird communities in the high elevation forests of Virginia. Master’s Thesis. Virginia Polytechnic Institute and State University, Blacksburg, VA, USA.
Rottenborn, Stephen C, and Edward S Brinkley, eds. 2007. Virginia’s Birdlife: An Annotated Checklist. 4th ed. Virginia’s Avifauna, No. 7. Virginia Society of Ornithology.
Tarof, S., and J. V. Briskie (2020). Least Flycatcher (Empidonax minimus), version 1.0. In Birds of the World (A. F. Poole, Editor). Cornell Lab of Ornithology, Ithaca, NY, USA. https://doi.org/10.2173/bow.leafly.01.
Virginia Department of Wildlife Resources (VDWR). 2025. Virginia wildlife action plan. Virginia Department of Wildlife Resources. Henrico, VA, USA. 506 pp.