Introduction
House Finches are songbirds common to bird feeders in a wide range of suburban to very urban areas. They are native to the western U.S. and Mexico, but in 1940, they were introduced to New York State as part of an unsuccessful effort to sell them as pets (Shedd 1990; Badyaev et al. 2020). After being introduced to the East Coast, it took several decades for House Finches to become established in Virginia (Veit and Lewis 1996). From the late 1970s until the mid-1990s, the House Finch population in Virginia grew rapidly from this very small initial population.
Breeding Distribution
House Finches are found throughout Virginia, and their likelihood of occurring is highly varied across all regions. They are likely to occur in the agricultural valleys of the Mountains and Valleys region, the urban areas of northern and central Piedmont region, and the southeastern Coastal Plain region and Eastern Shore (Figure 1).
Between the First and Second Atlases (Figures 1 and 2), the House Finch’s likelihood of occurrence increased throughout much of the Coastal Plain region and some parts of the southern Piedmont, while remaining constant throughout the remainder of the state (Figure 3).
View Environmental Associations

Figure 1: House Finch breeding distribution based on probability of occurrence (Second Atlas, 2016–2020). This map indicates the probability that this species will occur in an Atlas block (an approximately 10 mi2 [26 km2] survey unit) based on environmental (including habitat) factors and after adjusting for the probability of detection (variation in survey effort among blocks).
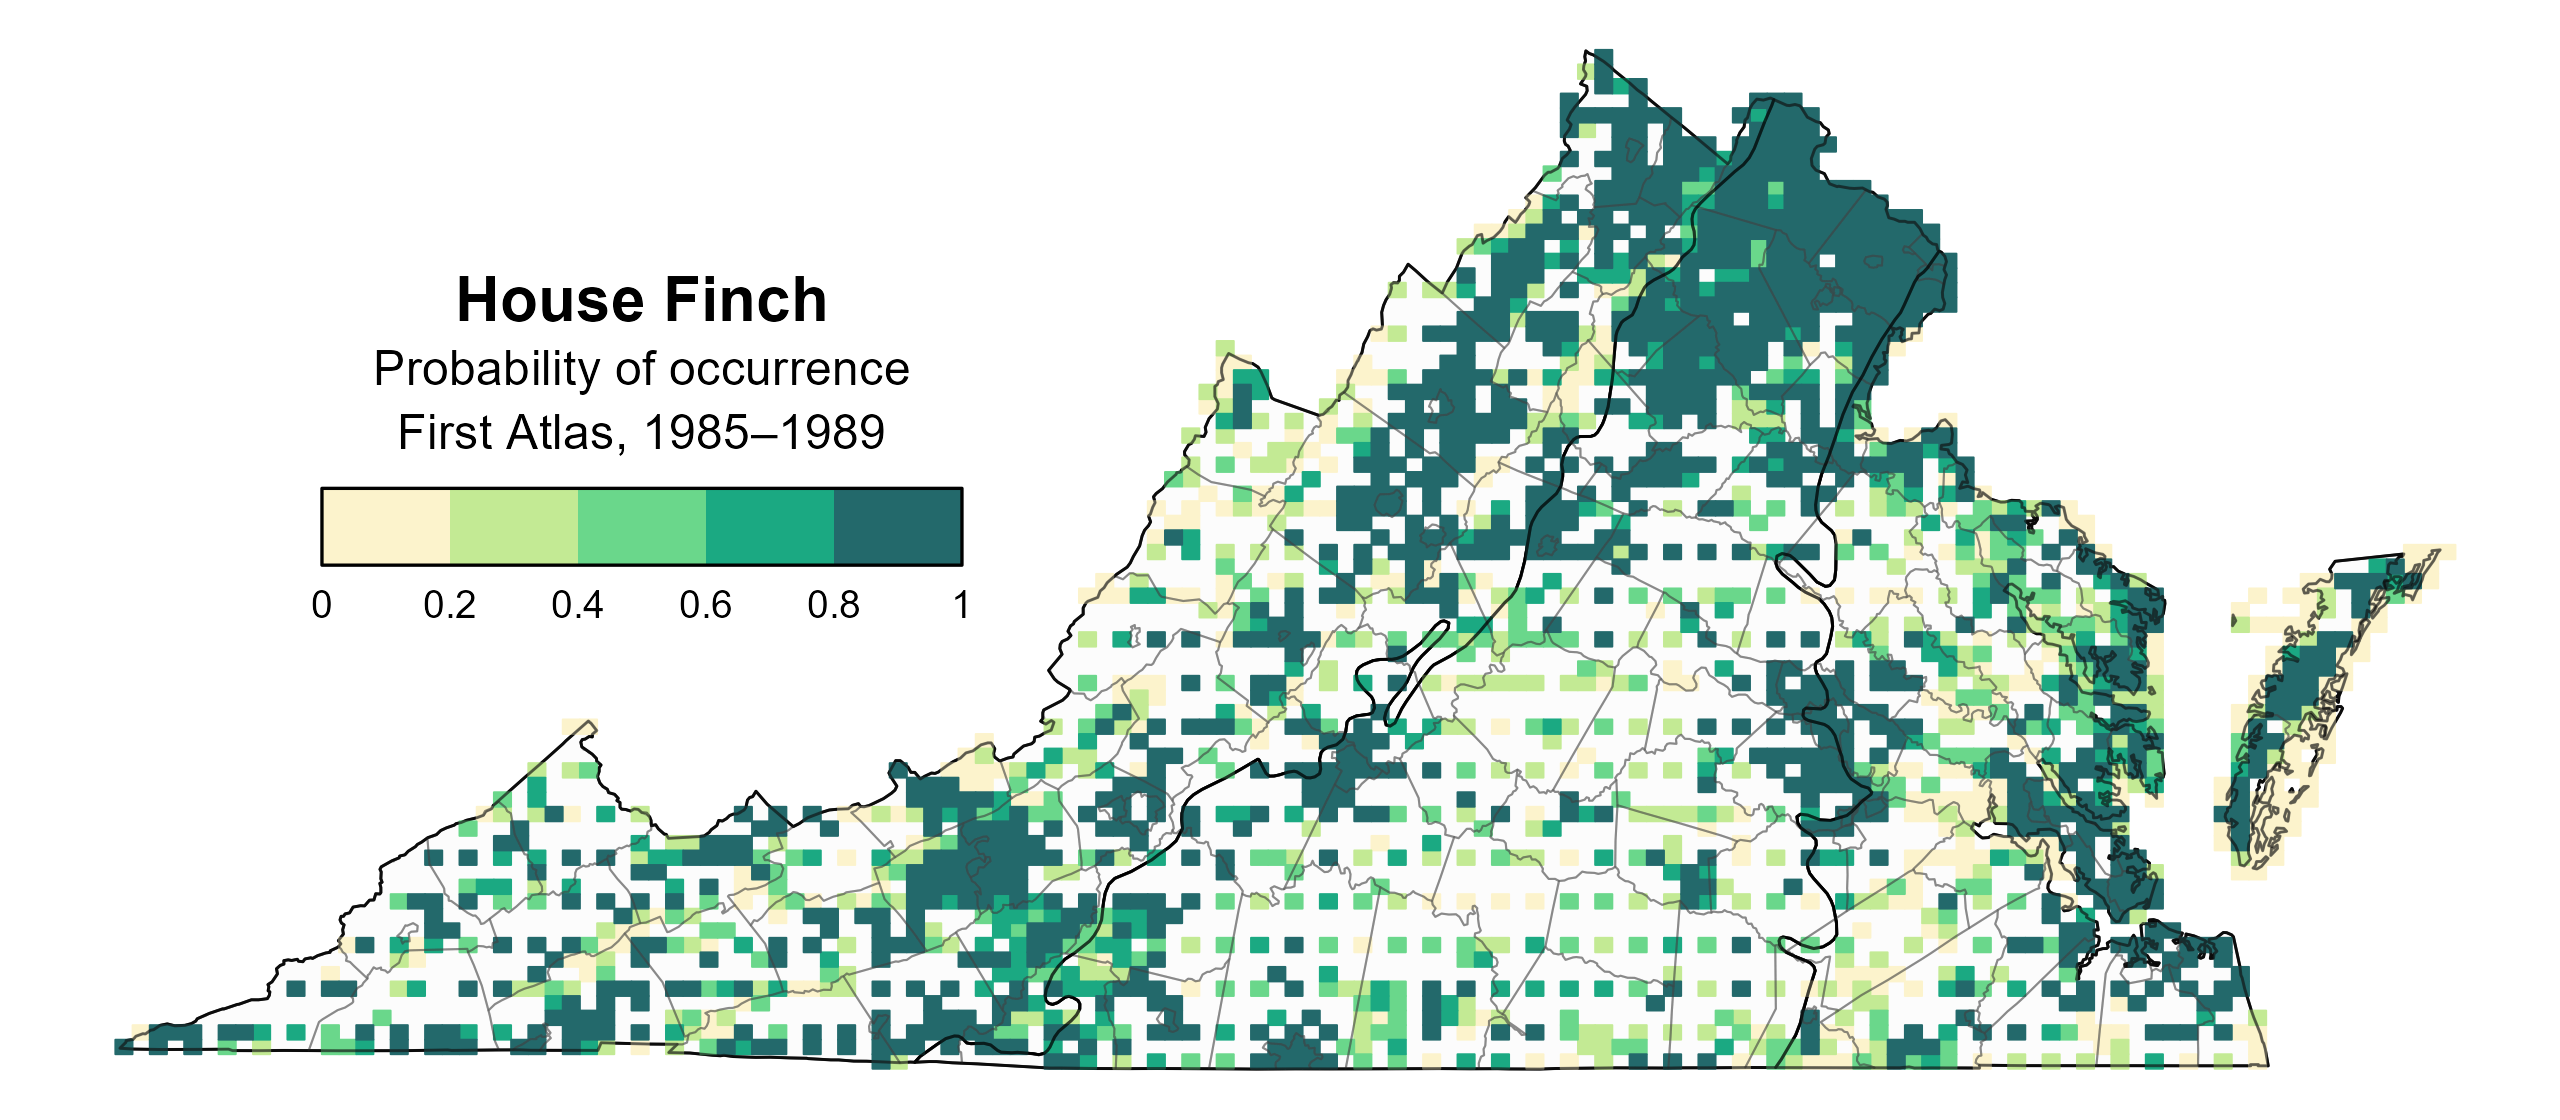
Figure 2: House Finch breeding distribution based on probability of occurrence (First Atlas, 1985–1989). This map indicates the probability that this species will occur in an Atlas block (an approximately 10 mi2 [26 km2] survey unit) based on environmental (including habitat) factors and after adjusting for the probability of detection (variation in survey effort among blocks). Blocks in white were not surveyed during the First Atlas and were not modeled.
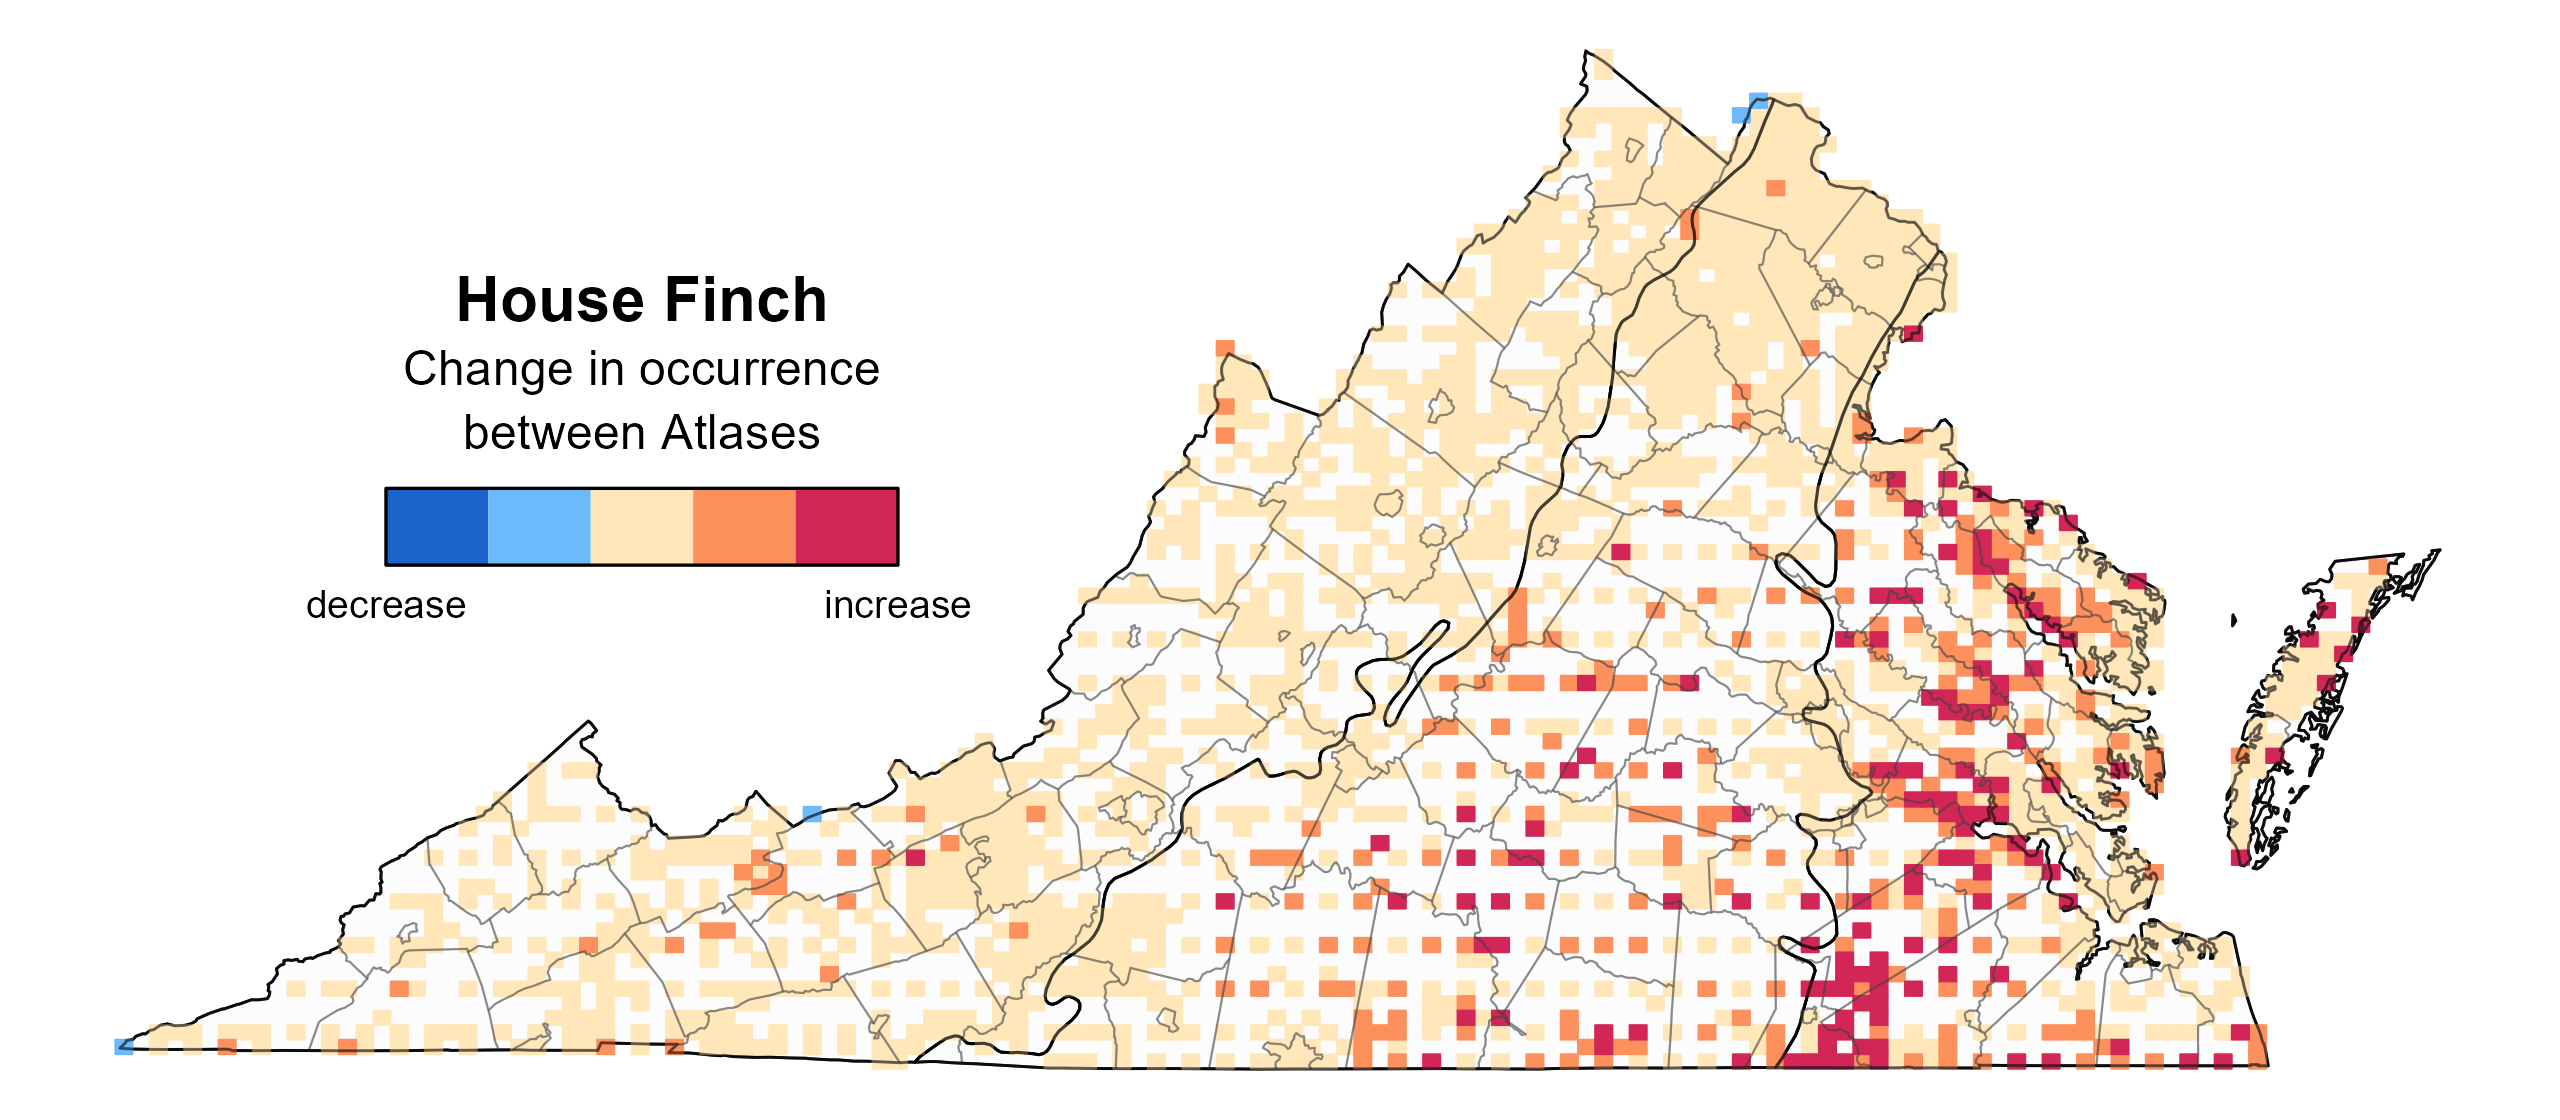
Figure 3: House Finch change in breeding distribution between Atlases (1985–1989 and 2016–2020) based on probability of occurrence. This map indicates the change in the probability that this species will occur in a block (an approximately 10 mi2 [26 km2] survey unit) between Atlas periods. Blocks with no change (tan) may have constant presence or constant absence. Blocks in white were not surveyed during the First Atlas and were not modeled.
Breeding Evidence
House Finches were confirmed breeders in 598 blocks and 108 counties and probable breeders in an additional 18 counties (Figure 4). The number of breeding observations was highest near developed areas, such as Blacksburg, Fairfax, Richmond, Roanoke, and Virginia Beach. Breeding observations were recorded in all regions of the state during the First Atlas, although there were substantially fewer records (Figure 5).
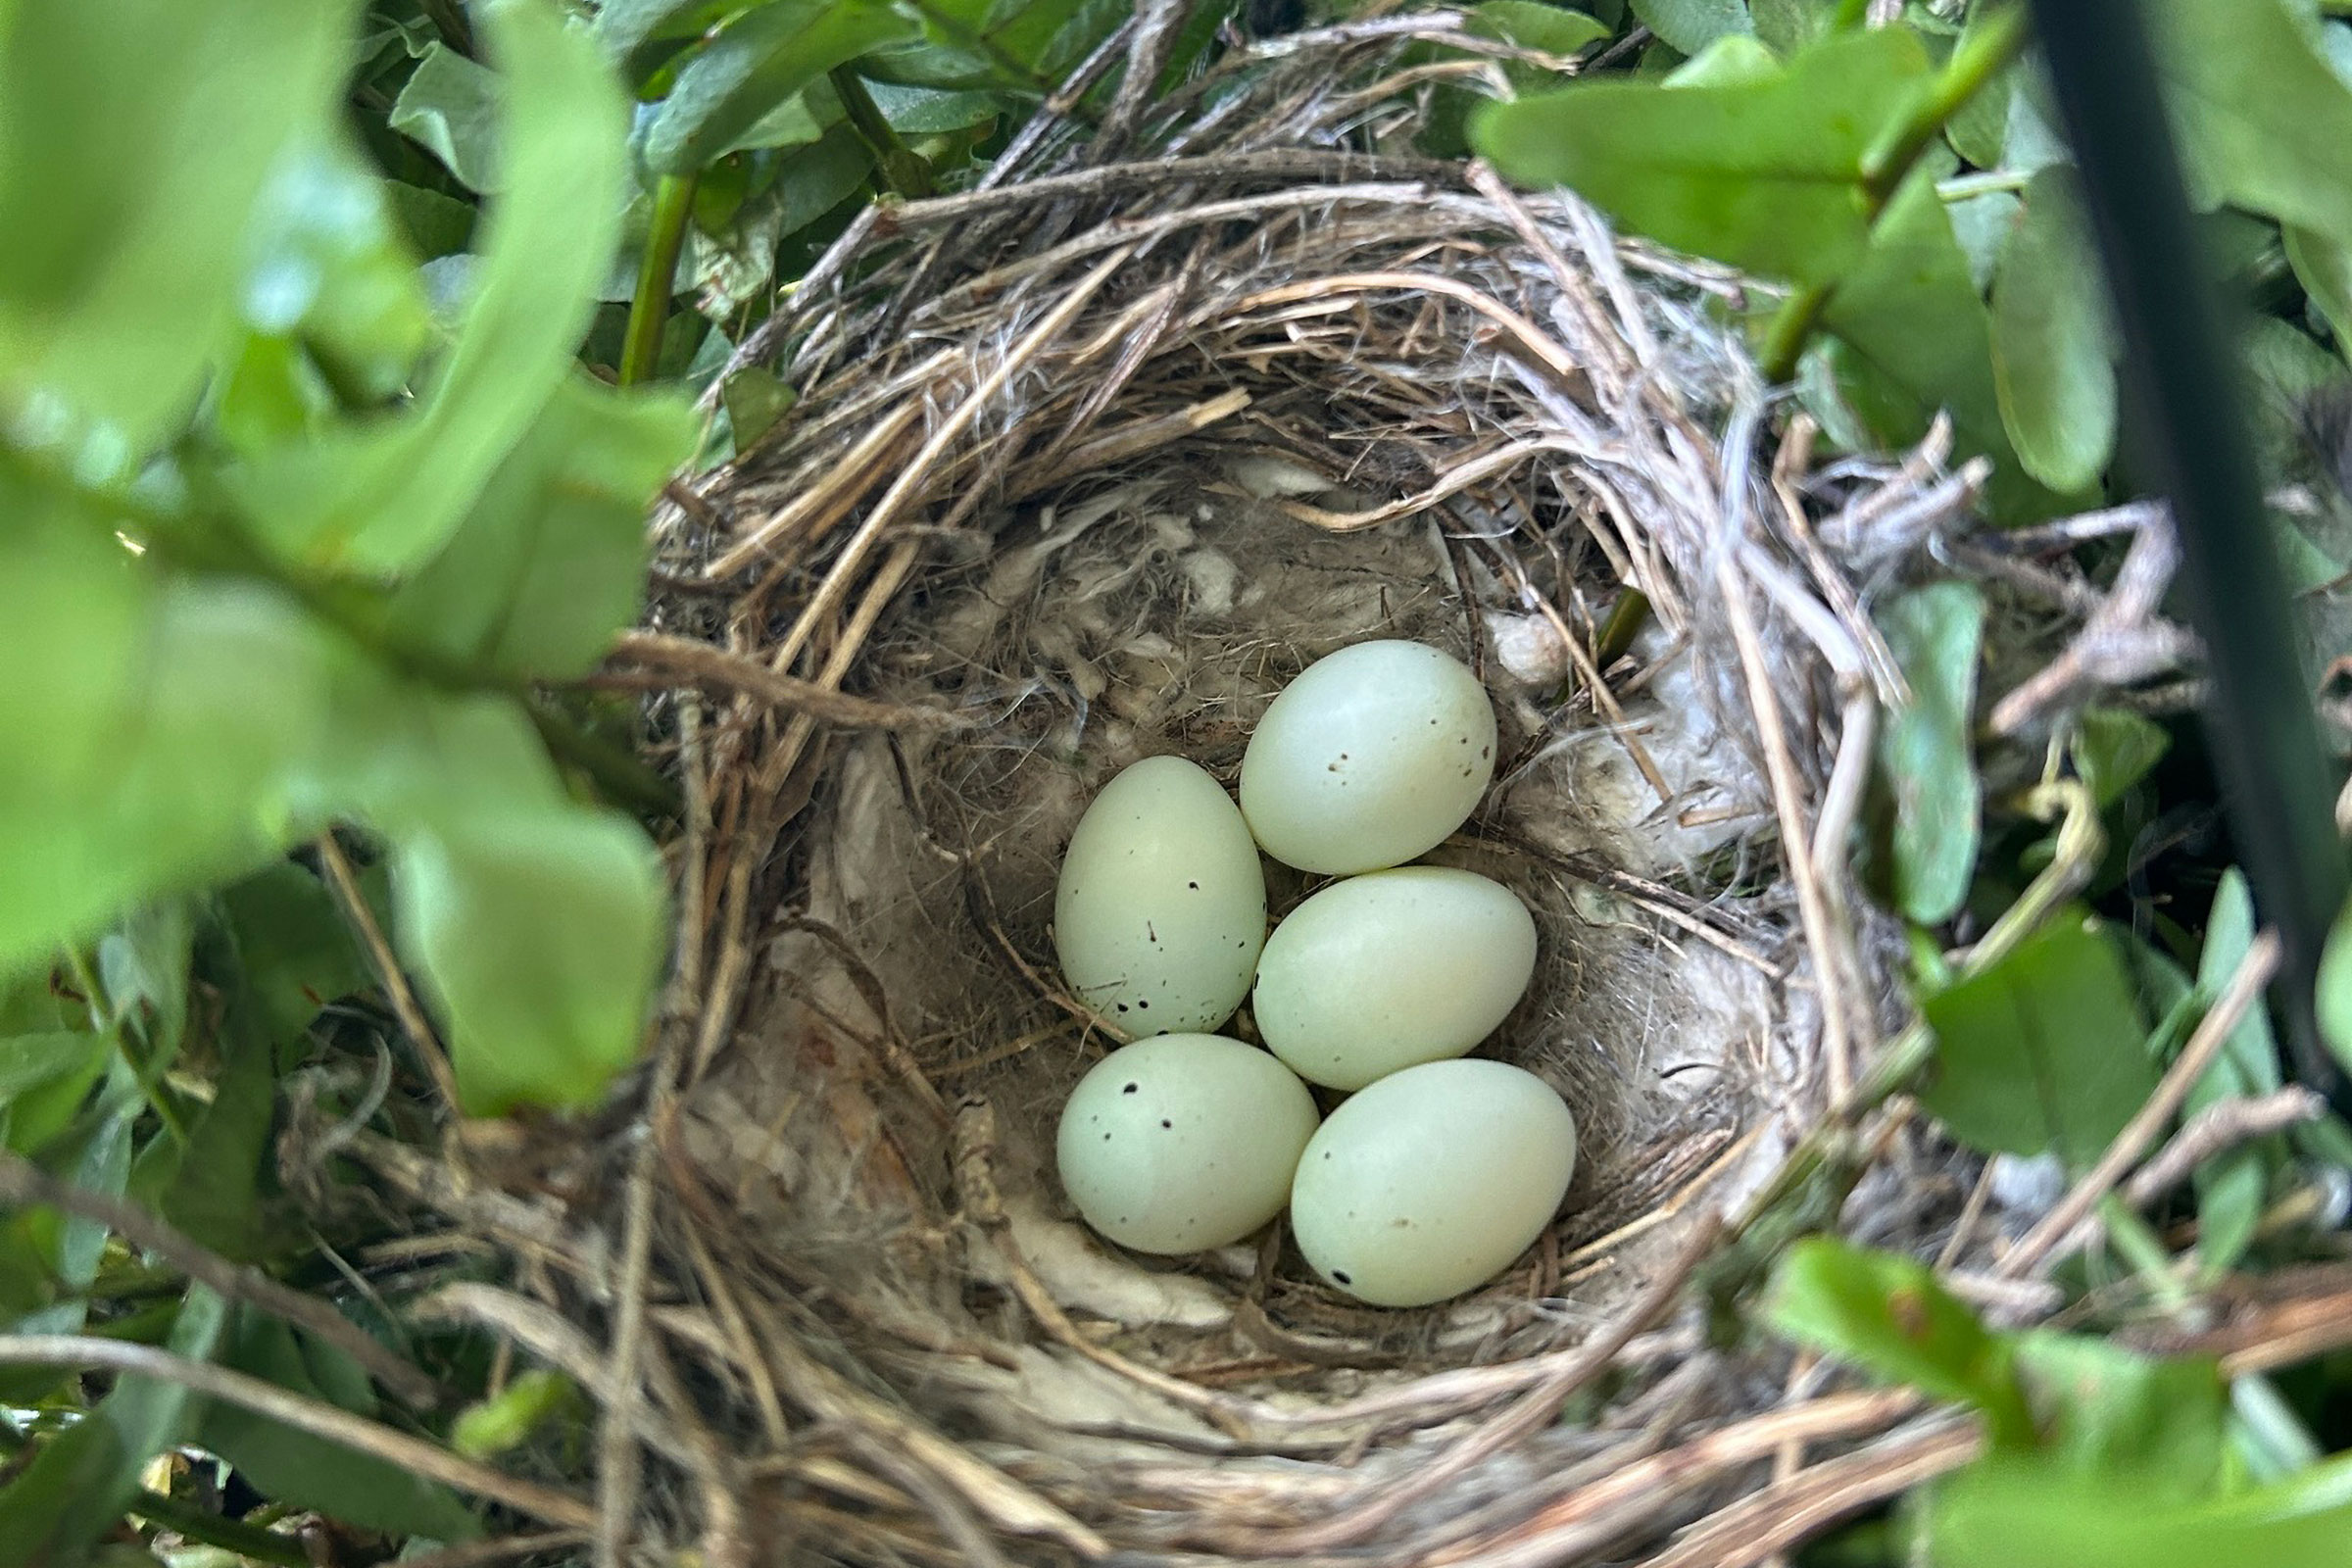
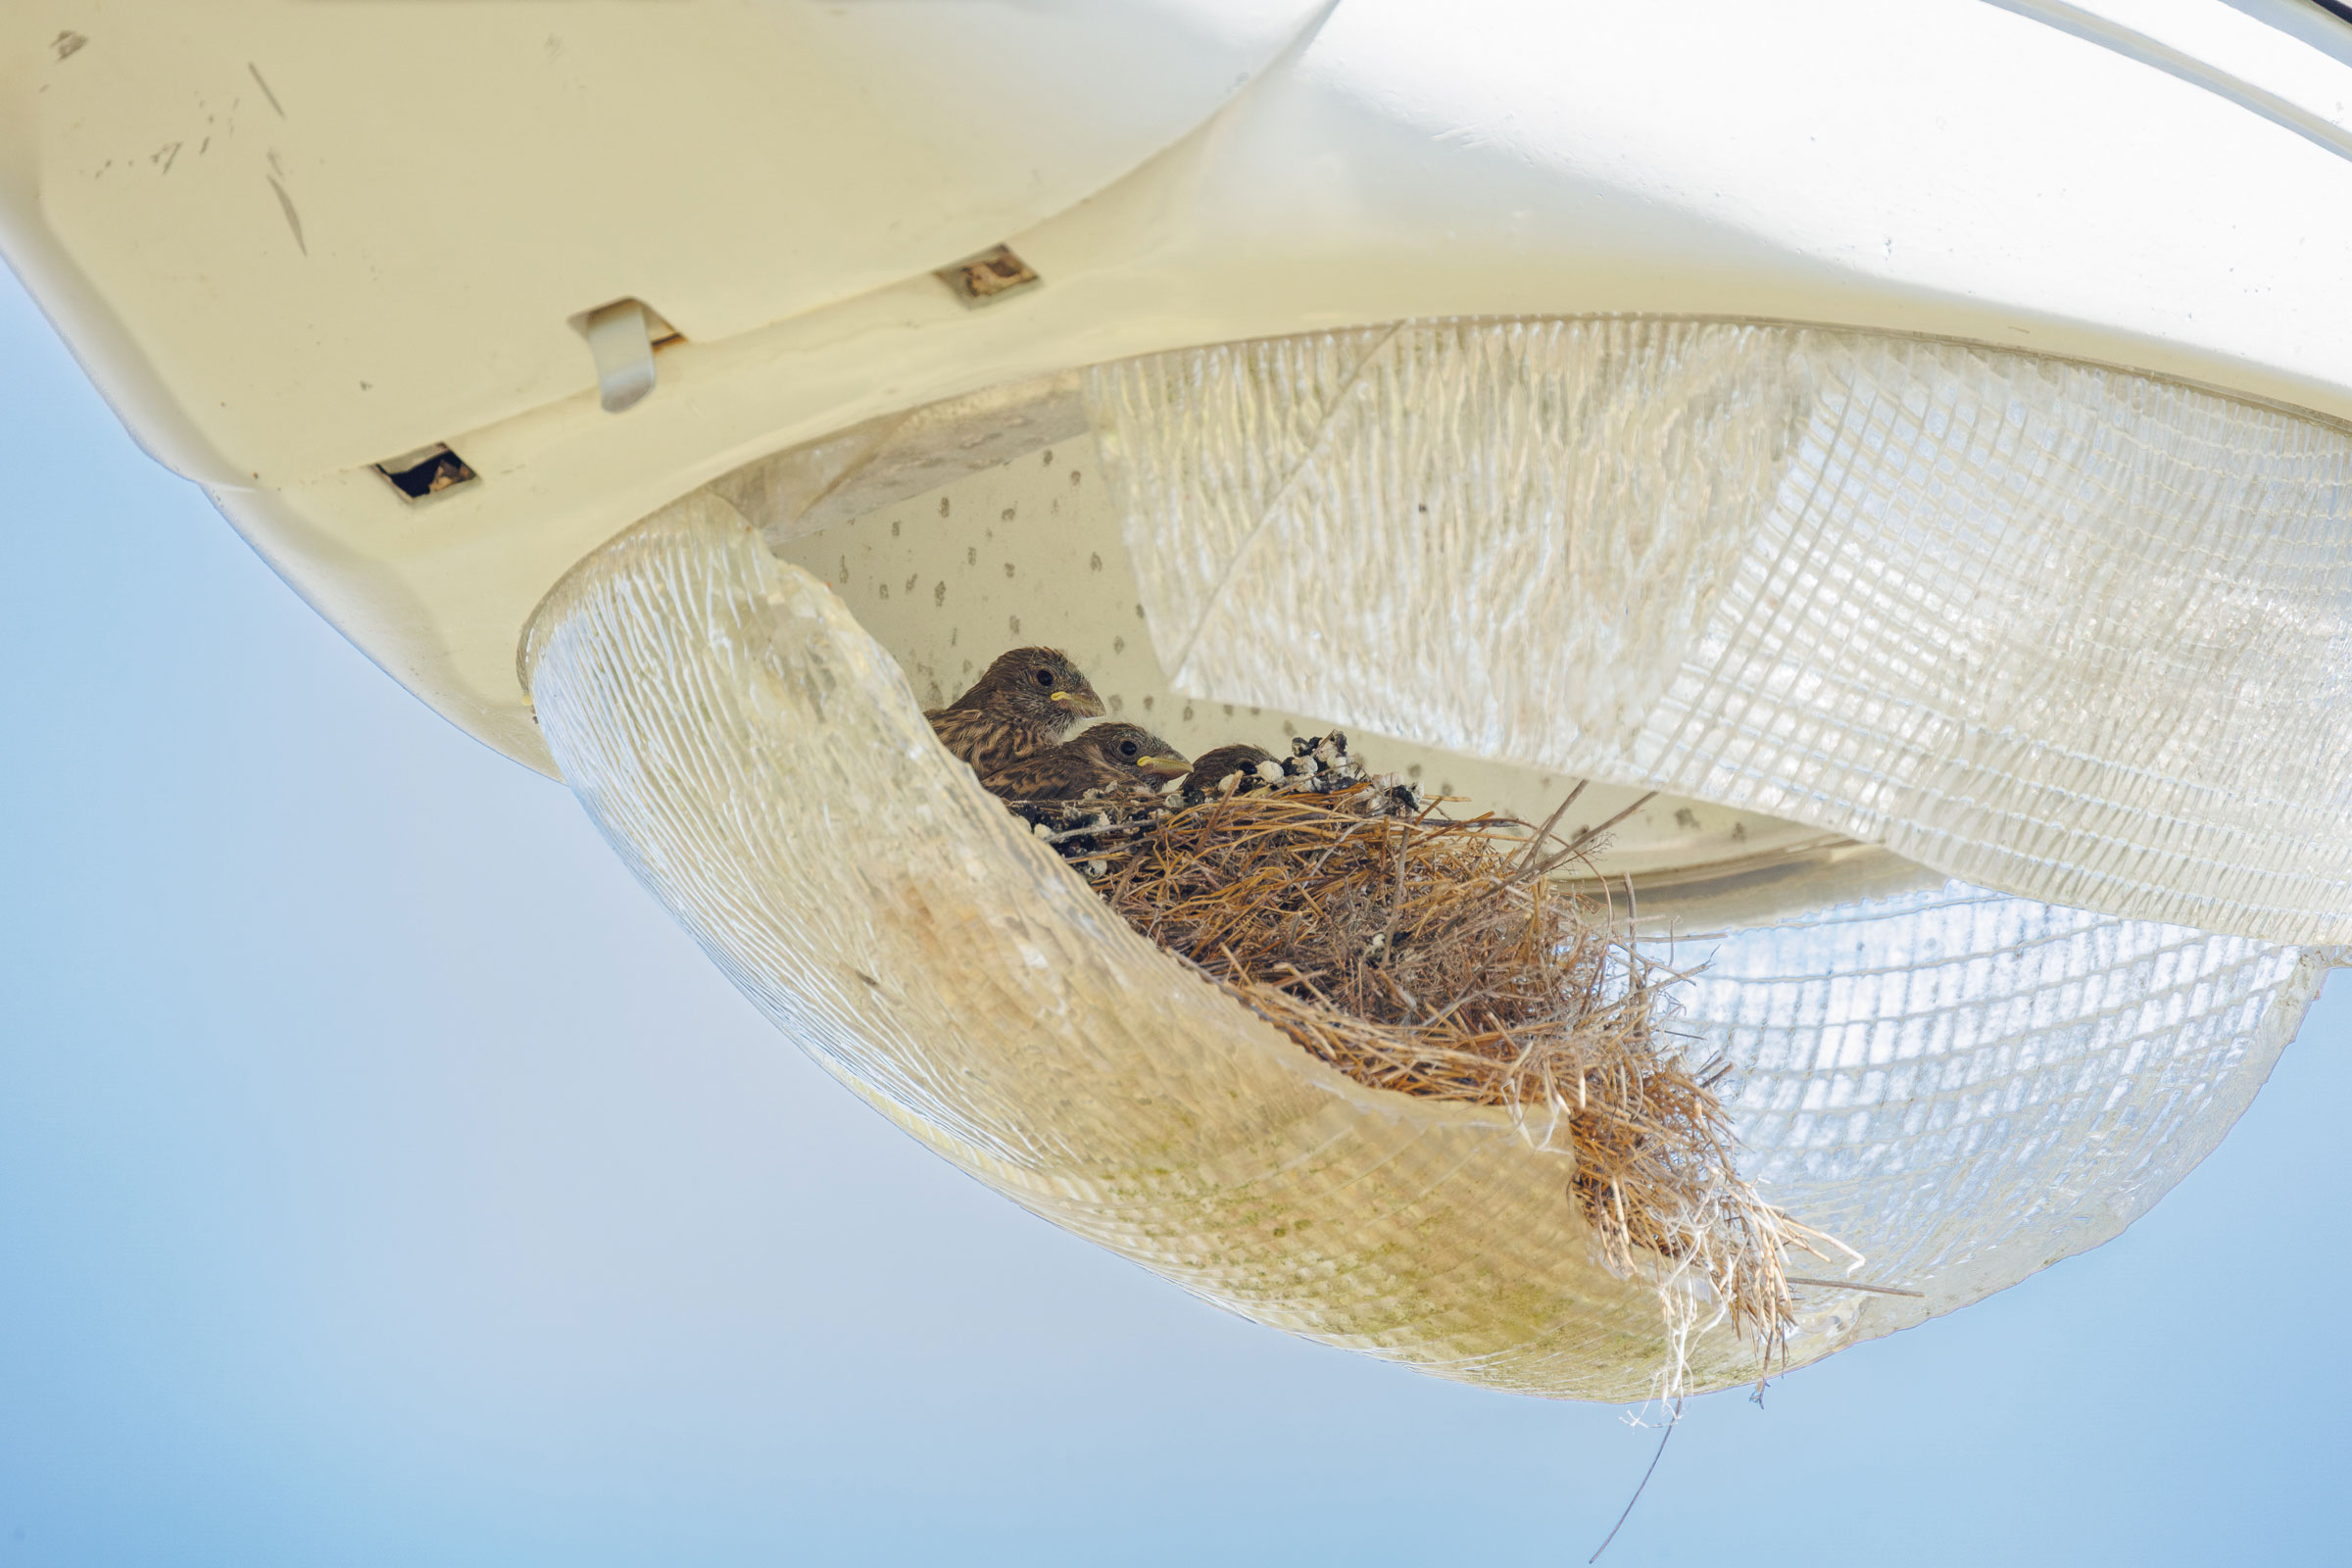
Breeding occurs over a long period and was confirmed primarily through observations of recently fledged young (February 5 – September 4), adults feeding young (February 7 – September 4), and occupied nests (March 21 – August 15) (Figure 6).
For more general information on the breeding habits of this species, please refer to All About Birds.
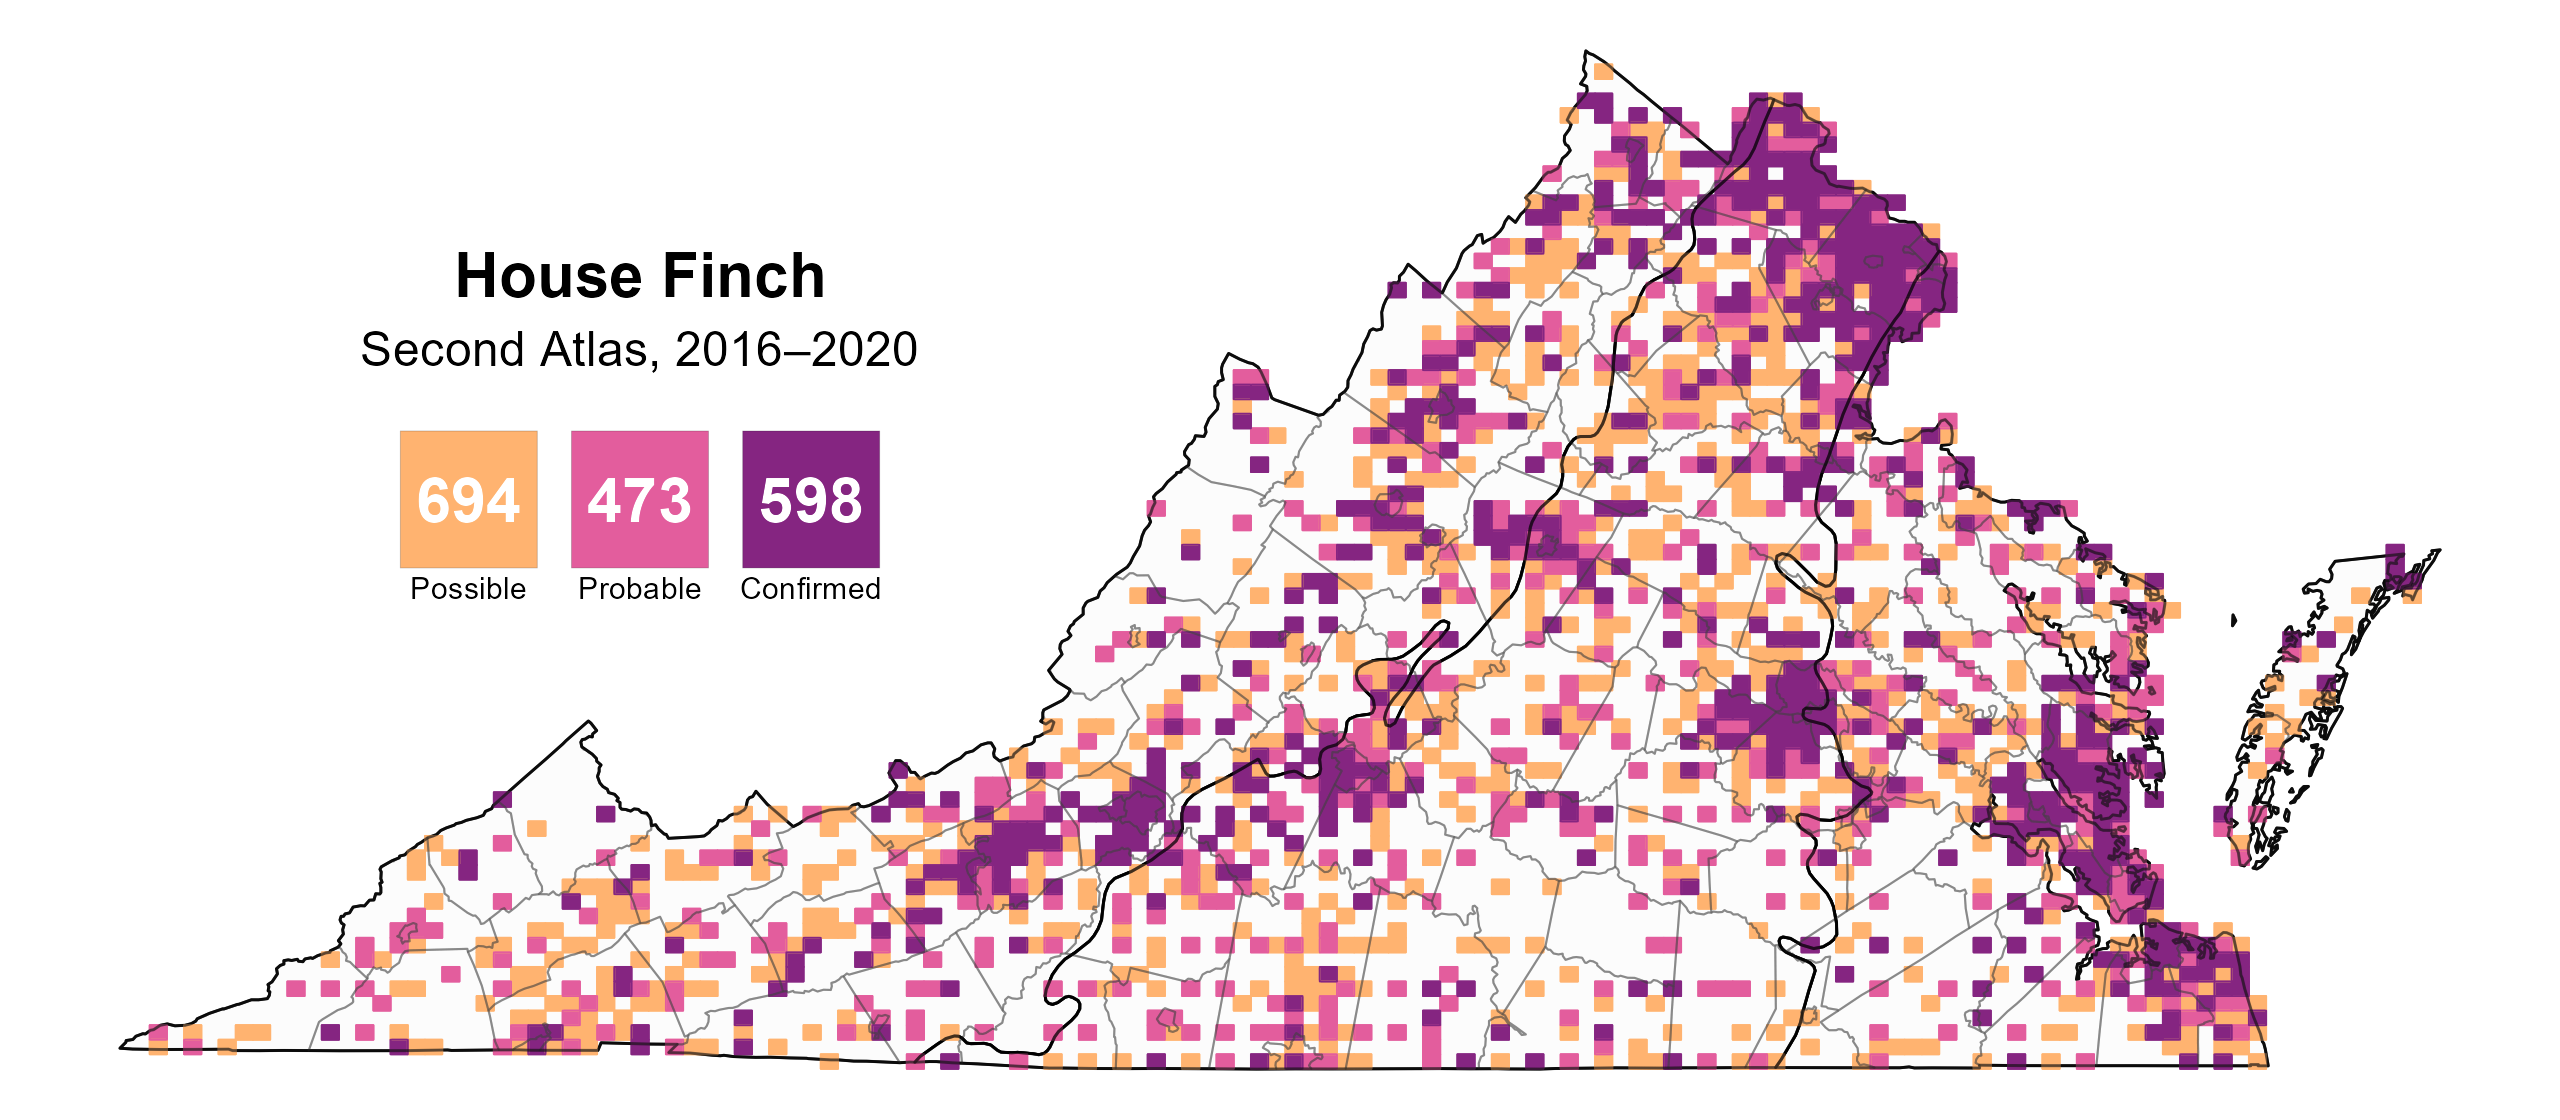
Figure 4: House Finch breeding observations from the Second Atlas (2016–2020). The colored boxes illustrate Atlas blocks (approximately 10 mi2 [26 km2] survey units) where the species was detected. The colors show the highest breeding category recorded in a block. The numbers within the colors in the legend correspond to the number of blocks with that breeding evidence category.
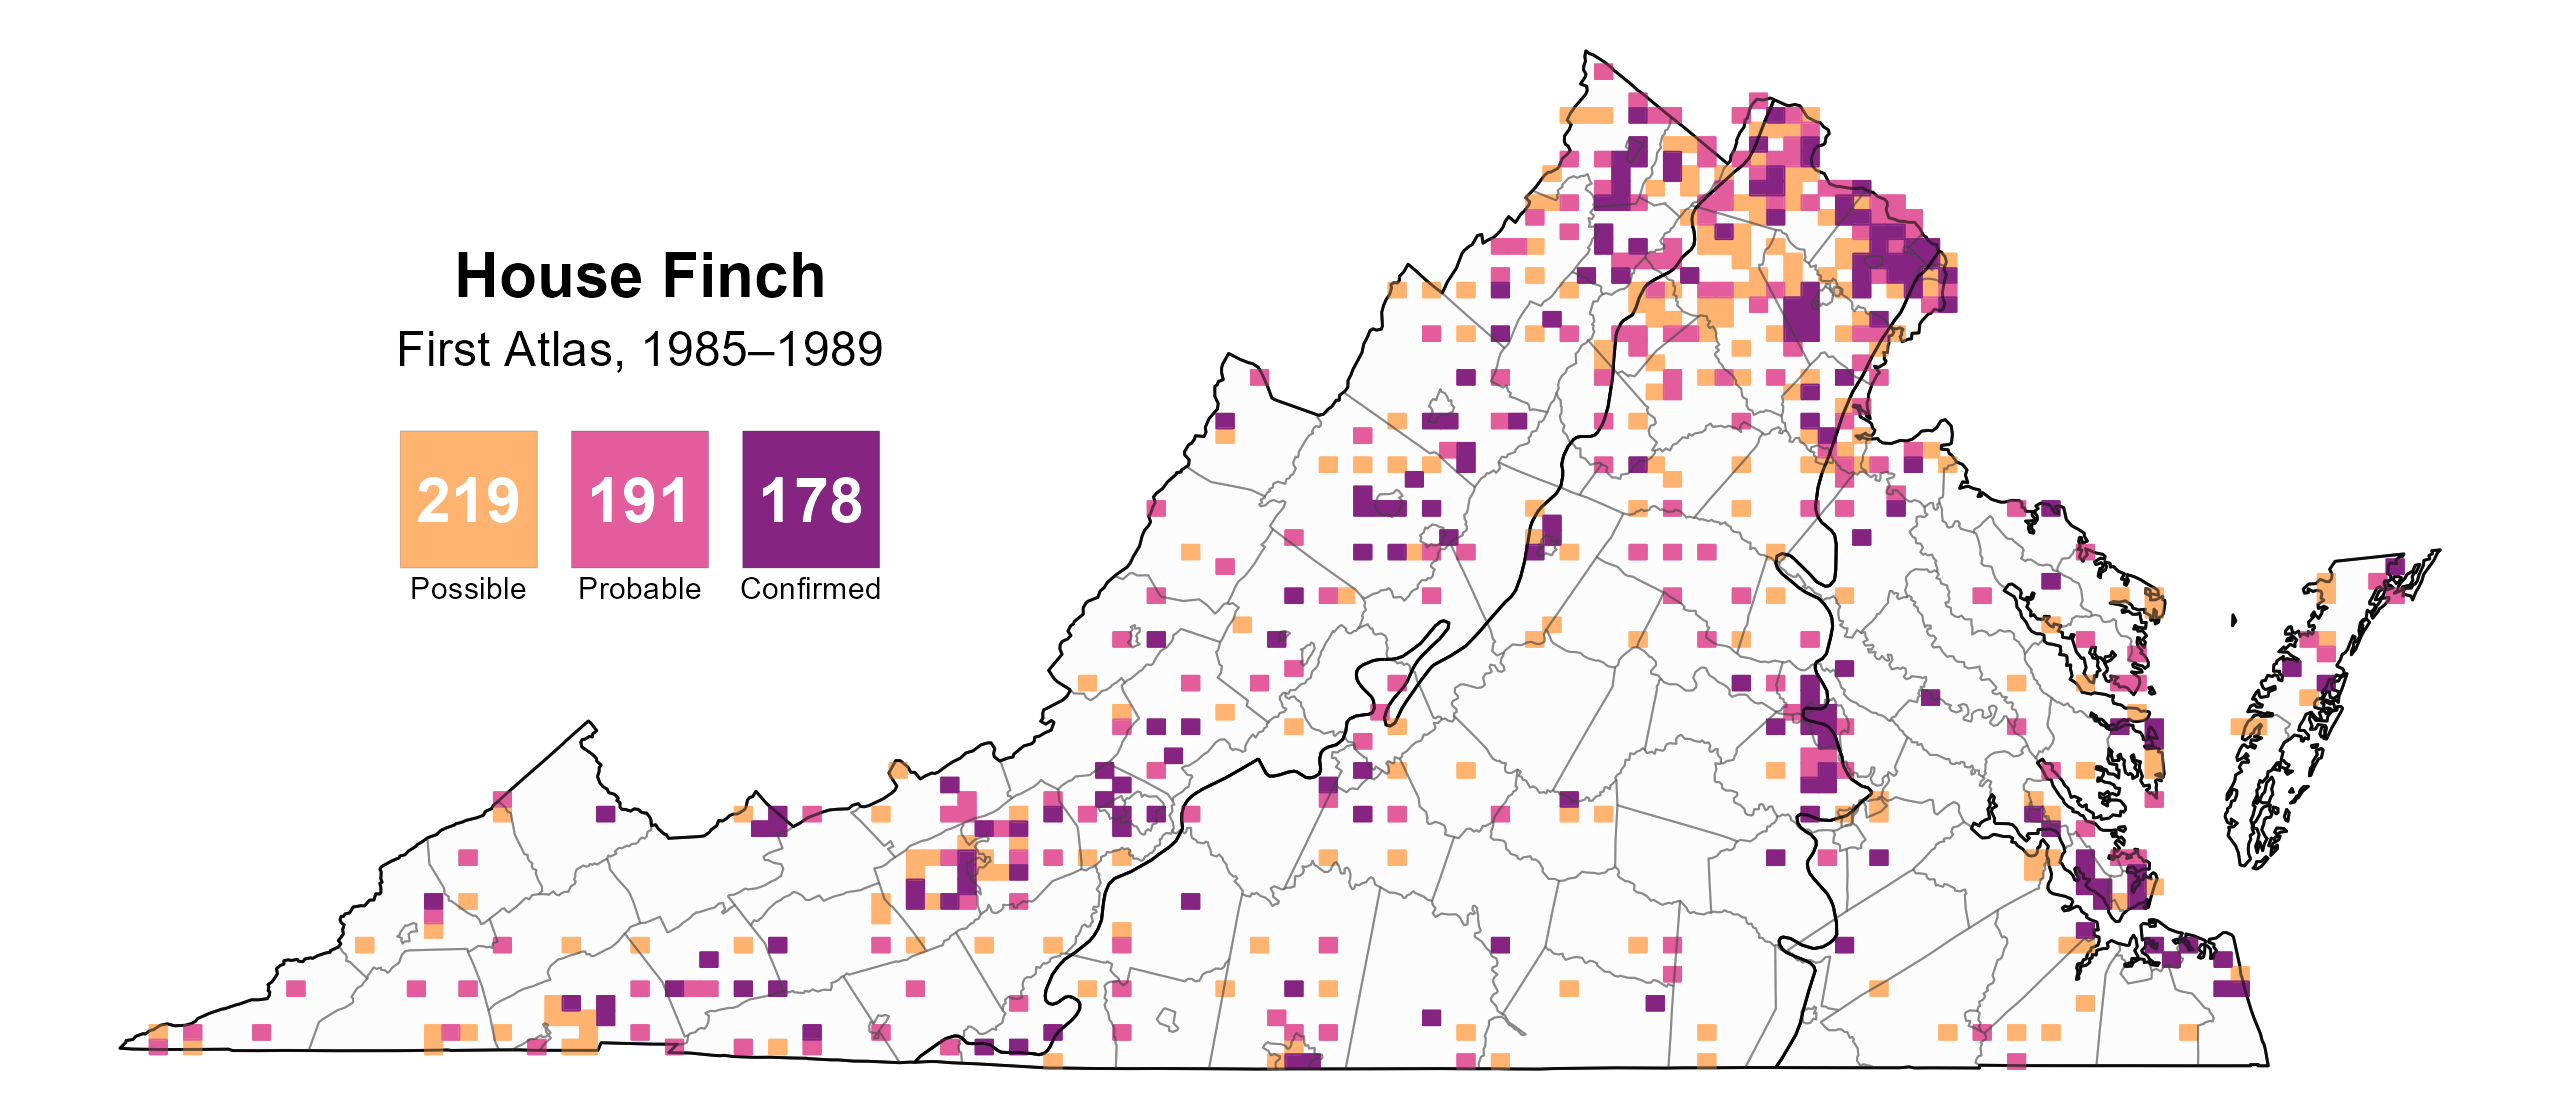
Figure 5: House Finch breeding observations from the First Atlas (1985–1989). The colored boxes illustrate Atlas blocks (approximately 10 mi2 [26 km2] survey units) where the species was detected. The colors show the highest breeding category recorded in a block. The numbers within the colors in the legend correspond to the number of blocks with that breeding evidence category.
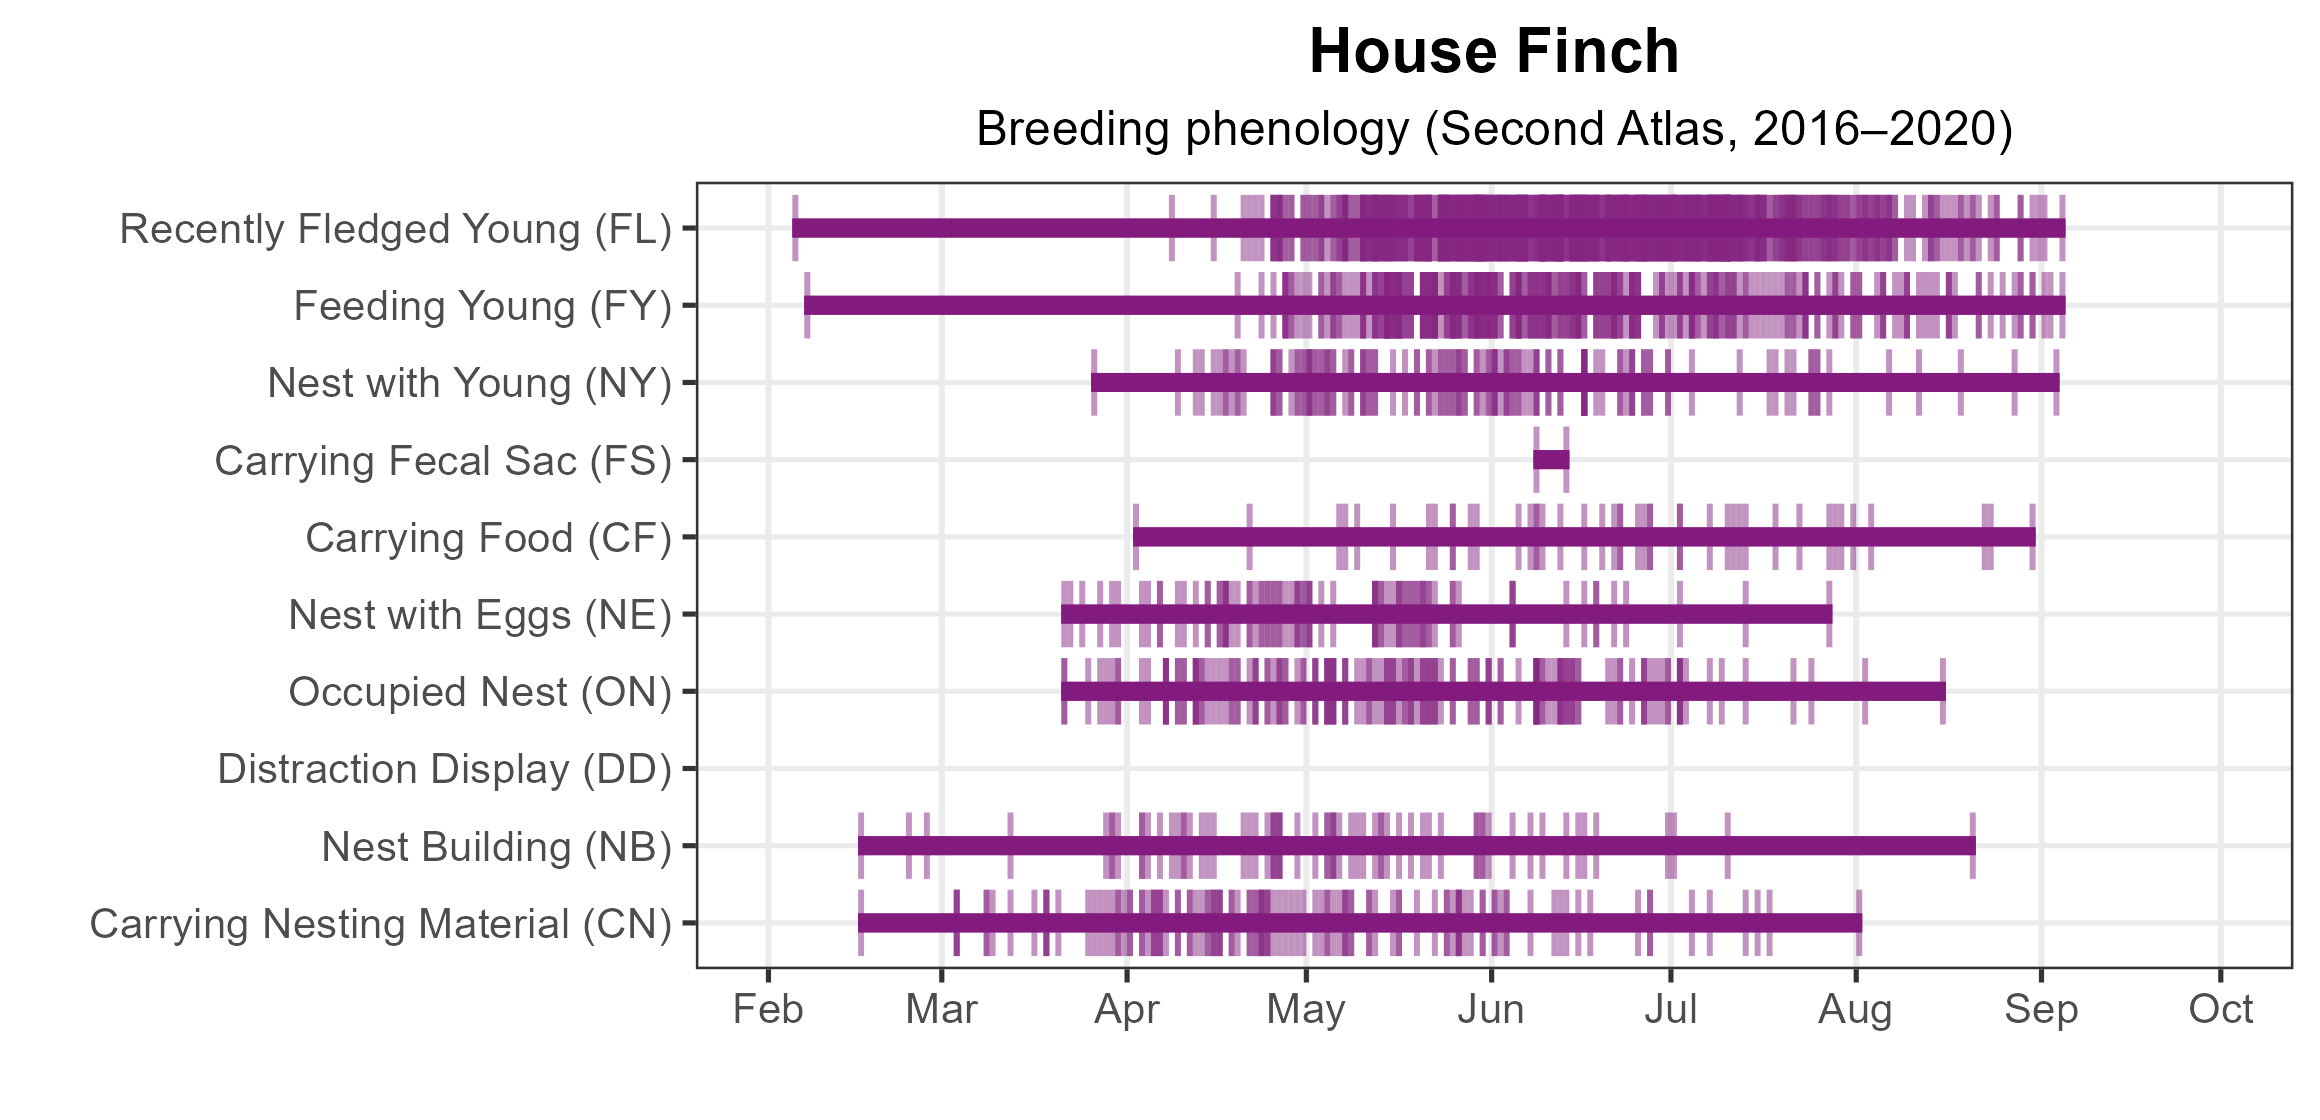
Figure 6: House Finch phenology: confirmed breeding codes. This graph shows a timeline of confirmed breeding behaviors. Tick marks represent individual observations of the behavior
Population Status
House Finch relative abundance was estimated to be the highest near developed areas in the Coastal Plain and Piedmont regions and in the valleys of the Mountains and Valleys region (Figure 7).
The total estimated House Finch population in the state is approximately 731,000 detectable individuals (with a range between 554,000 and 967,000). Based on the North American Breeding Bird Survey (BBS) for the Atlantic Flyway (data for Virginia were not credible), the House Finch population showed a significant increase of 8.13% annually from 1966–2022; however, between Atlases, it showed a nonsignificant decrease of 0.4% (Hostetler et al. 2023; Figure 8).
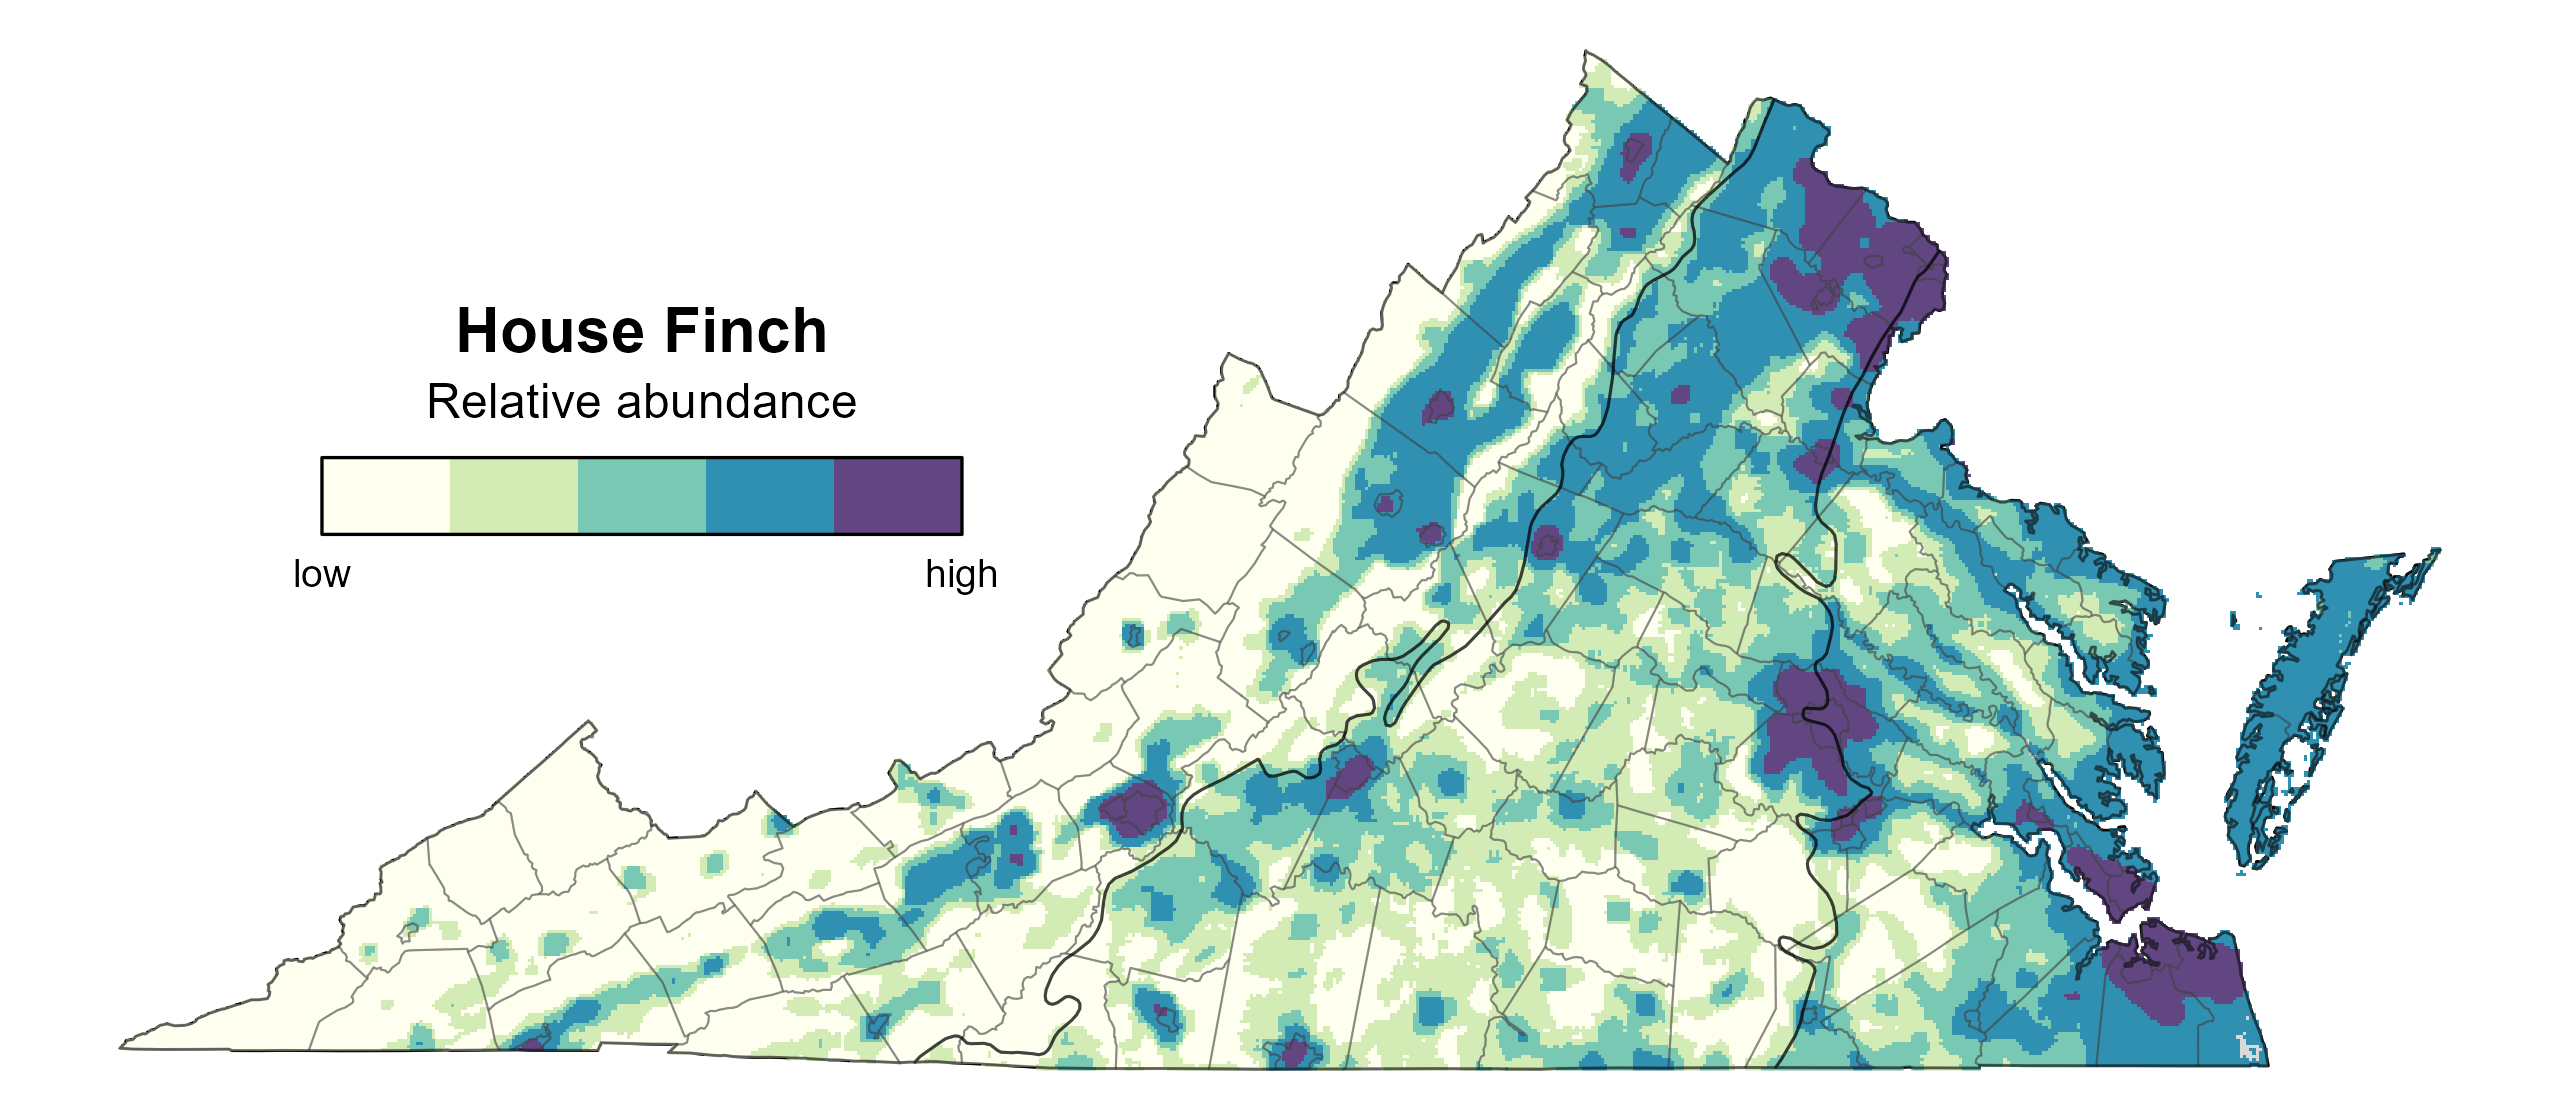
Figure 7: House Finch relative abundance (Second Atlas, 2016–2020). This map indicates the predicted abundance of this species at a 0.4 mi2 (1 km2) scale based on environmental (including habitat) factors. Abundance values are presented on a relative scale of low to high.
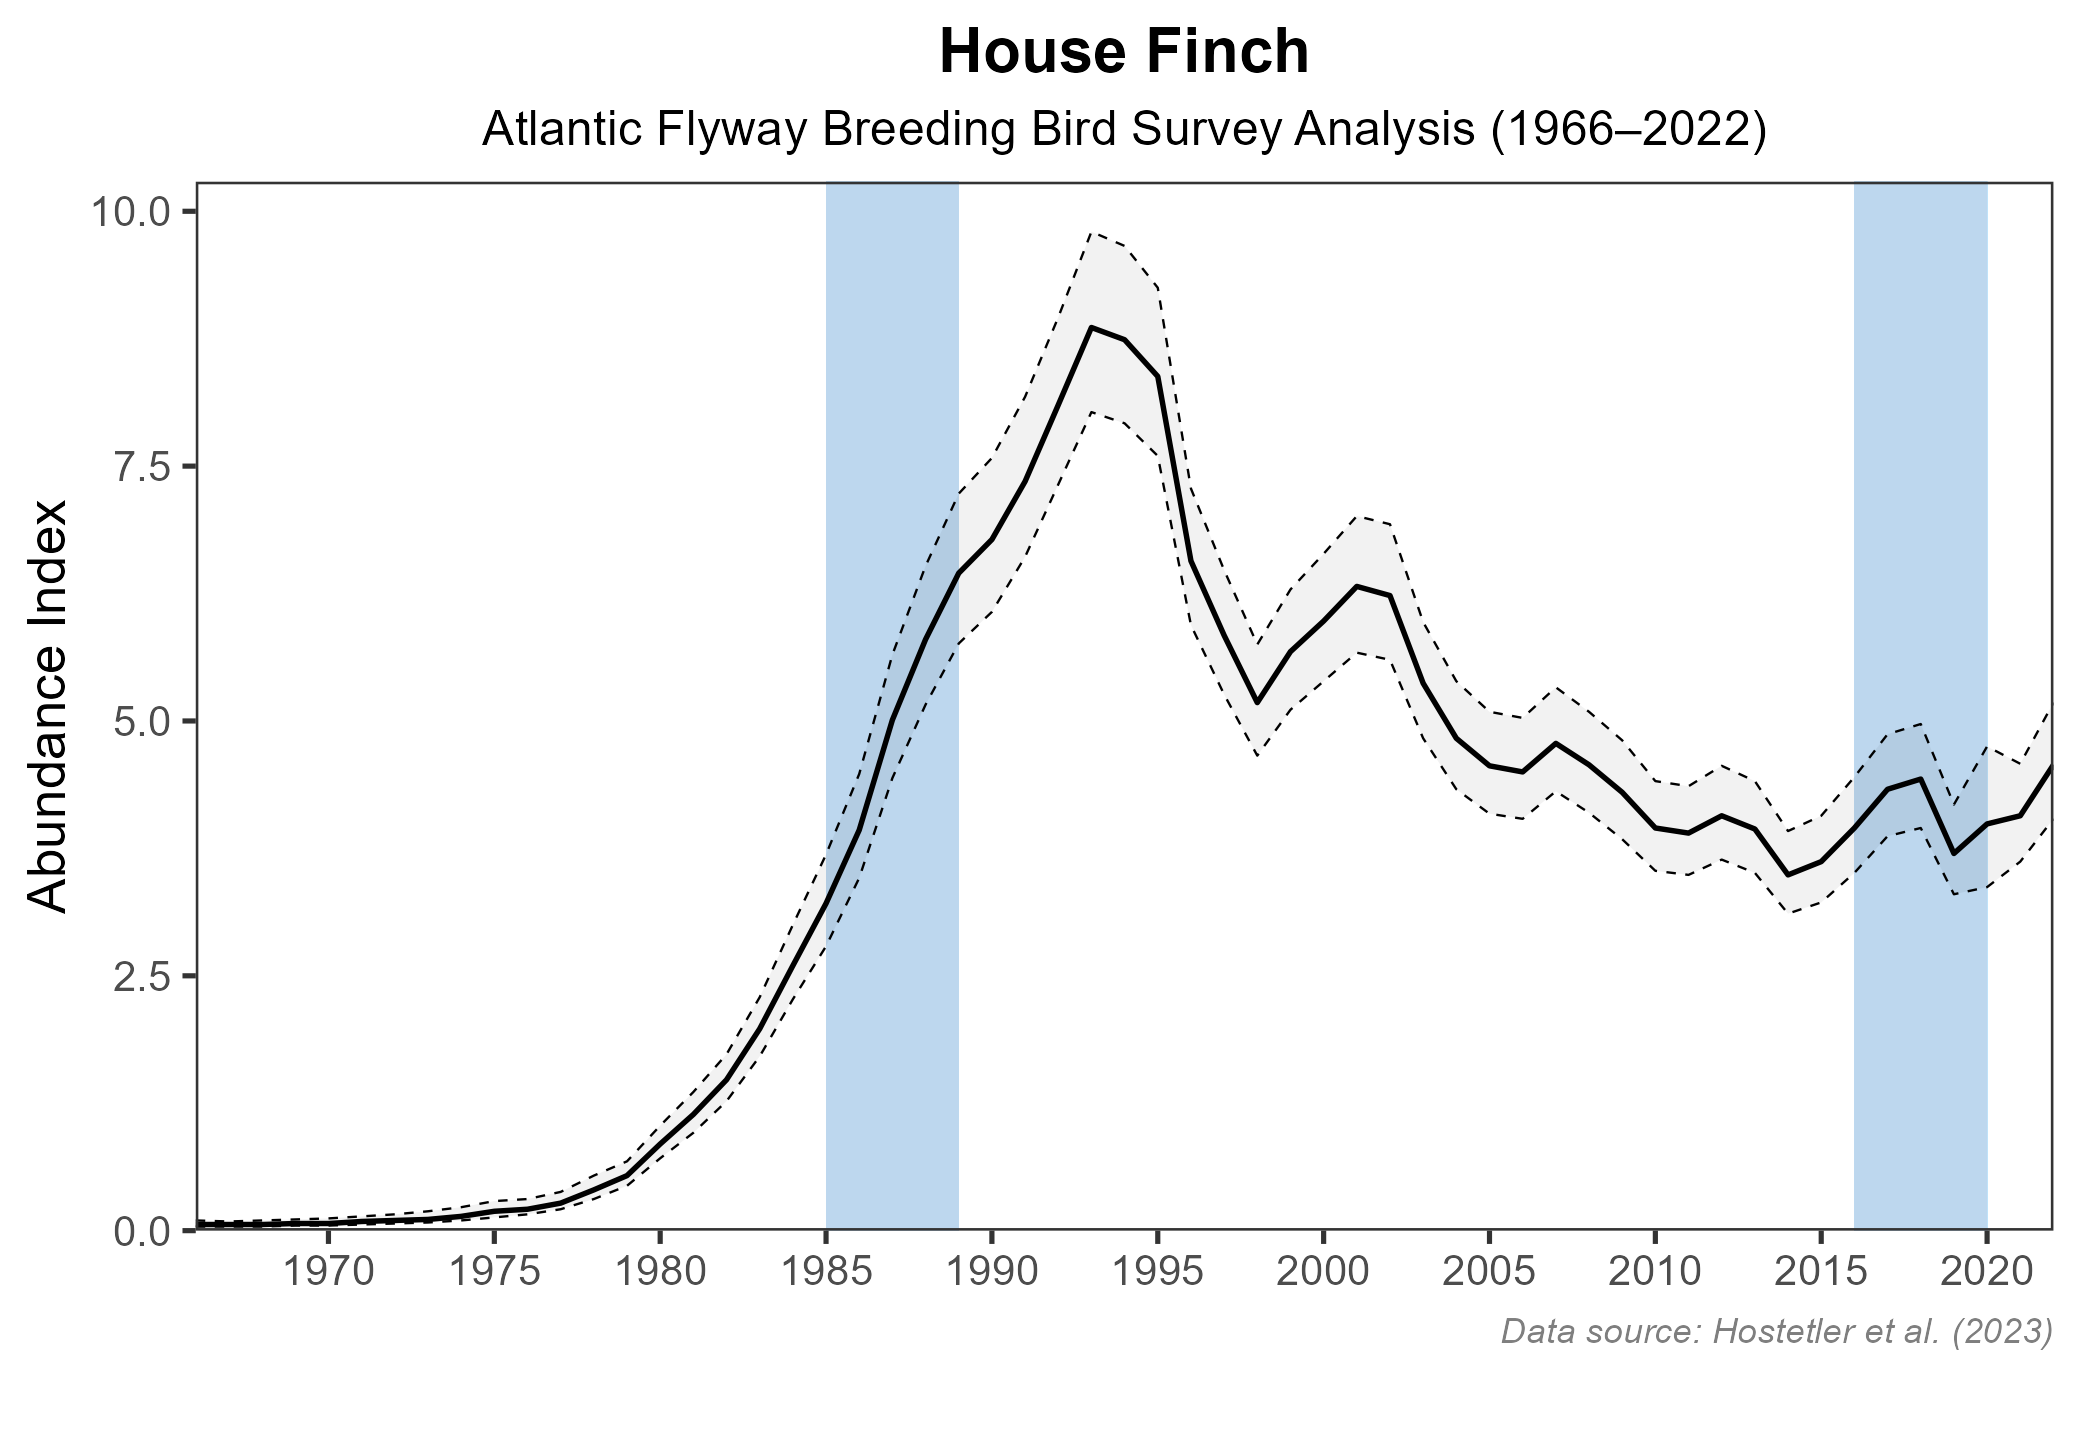
Figure 8: House Finch population trend for the Atlantic Flyway as estimated by the North American Breeding Bird Survey. The vertical axis shows species abundance; the horizontal axis shows the year. The solid line indicates the estimated population trend; there is a 97.5% probability that the true population trend falls between the dashed lines. The shaded bars indicate the First and Second Atlas periods.
Conservation
In 1994, mycoplasmal conjunctivitis was documented in House Finches near Washington, D.C. Although the typical seasonal epidemics of mycoplasmal conjunctivitis (highest number of infected individuals in fall/winter) fall outside of the breeding season (Altizer et al. 2004), having conjunctivitis reduces anti-predator behaviors (Adelman et al. 2017), which could be leading to a decrease in adult breeders going into the breeding season in Virginia. Notably, since detection of the disease, House Finch populations in Virginia and elsewhere have declined to some degree and become more cyclical (Hochachka and Dhondt 2000; Altizier et al. 2004; Dhondt et al. 2006). However, the species remains widespread and abundant in much of its range (Hochachka and Dhondt 2000; Altizer et al. 2004), and it appears to be evolving strategies to tolerate the disease, possibly reducing negative population impacts (Henschen et al. 2023).
Interactive Map
The interactive map contains up to six Atlas layers (probability of occurrence for the First and Second Atlases, change in probability of occurrence between Atlases, breeding evidence for the First and Second Atlases, and abundance for the Second Atlas) that can be viewed one at a time. To view an Atlas map layer, mouse over the layer box in the upper left. County lines and physiographic regional boundaries (Mountains and Valleys, Piedmont, and Coastal Plain) can be turned on and off by checking or unchecking the box below the layer box. Within the map window, users can hover on a block to see its value for each layer and pan and zoom to see roads, towns, and other features of interest that are visible beneath a selected layer.
View Interactive Map in Full Screen
References
Altizer, S., Hochachka, W. M., & Dhondt, A. A. (2004). Seasonal dynamics of mycoplasmal conjunctivitis in Eastern North American House Finches. Journal of Animal Ecology 73: 309–322. http://www.jstor.org/stable/3505566.
Badyaev, A. V., V. Belloni, and G. E. Hill (2020). House Finch (Haemorhous mexicanus), version 1.0. In Birds of the World (A. F. Poole, Editor). Cornell Lab of Ornithology, Ithaca, NY, USA. https://doi.org/10.2173/bow.houfin.01.
Dhondt, A. A., A. V. Badyaev, A. P. Dobson, D. M. Hawley, M. J. L. Driscoll, W. M. Hochachka and D. H. Ley. (2006). Dynamics of mycoplasmal conjunctivitis in the native and introduced range of the host. EcoHealth 3:95-102.
Henschen, A. E., M. Vinkler, M. M. Langager, A. A. Rowley, R. A. Dalloul, D. M. Hawley, and J. S. Adelman (2023) Rapid adaptation to a novel pathogen through disease tolerance in a wild songbird. PLOS Pathogen 19: e1011408. https://doi.org/10.1371/journal.ppat.1011408.
Hochachka, W. M., and A. A. Dhondt (2000). Density-dependent decline of host abundance resulting from a new infectious disease, Proceedings of the National Academy of Science 97:5303– 5306. https://doi.org/10.1073/pnas.080551197.
Hostetler, J. A., J. R. Sauer, J. E. Hines, D. Ziolkowski, and M. Lutmerding (2023). The North American breeding bird survey, analysis results 1966–2022. U.S. Geological Survey, Laurel, MD, USA. https://doi.org/10.5066/P9SC7T11.
Shedd, D. (1990). Aggressive interactions in wintering House Finches and Purple Finches. The Wilson Bulletin 102: 174–78. http://www.jstor.org/stable/4162842.
Veit, R. R., and M. A. Lewis (1996). Dispersal, population growth, and the Allee Effect: dynamics of the House Finch invasion of Eastern North America. The American Naturalist 148:255–274.