Introduction
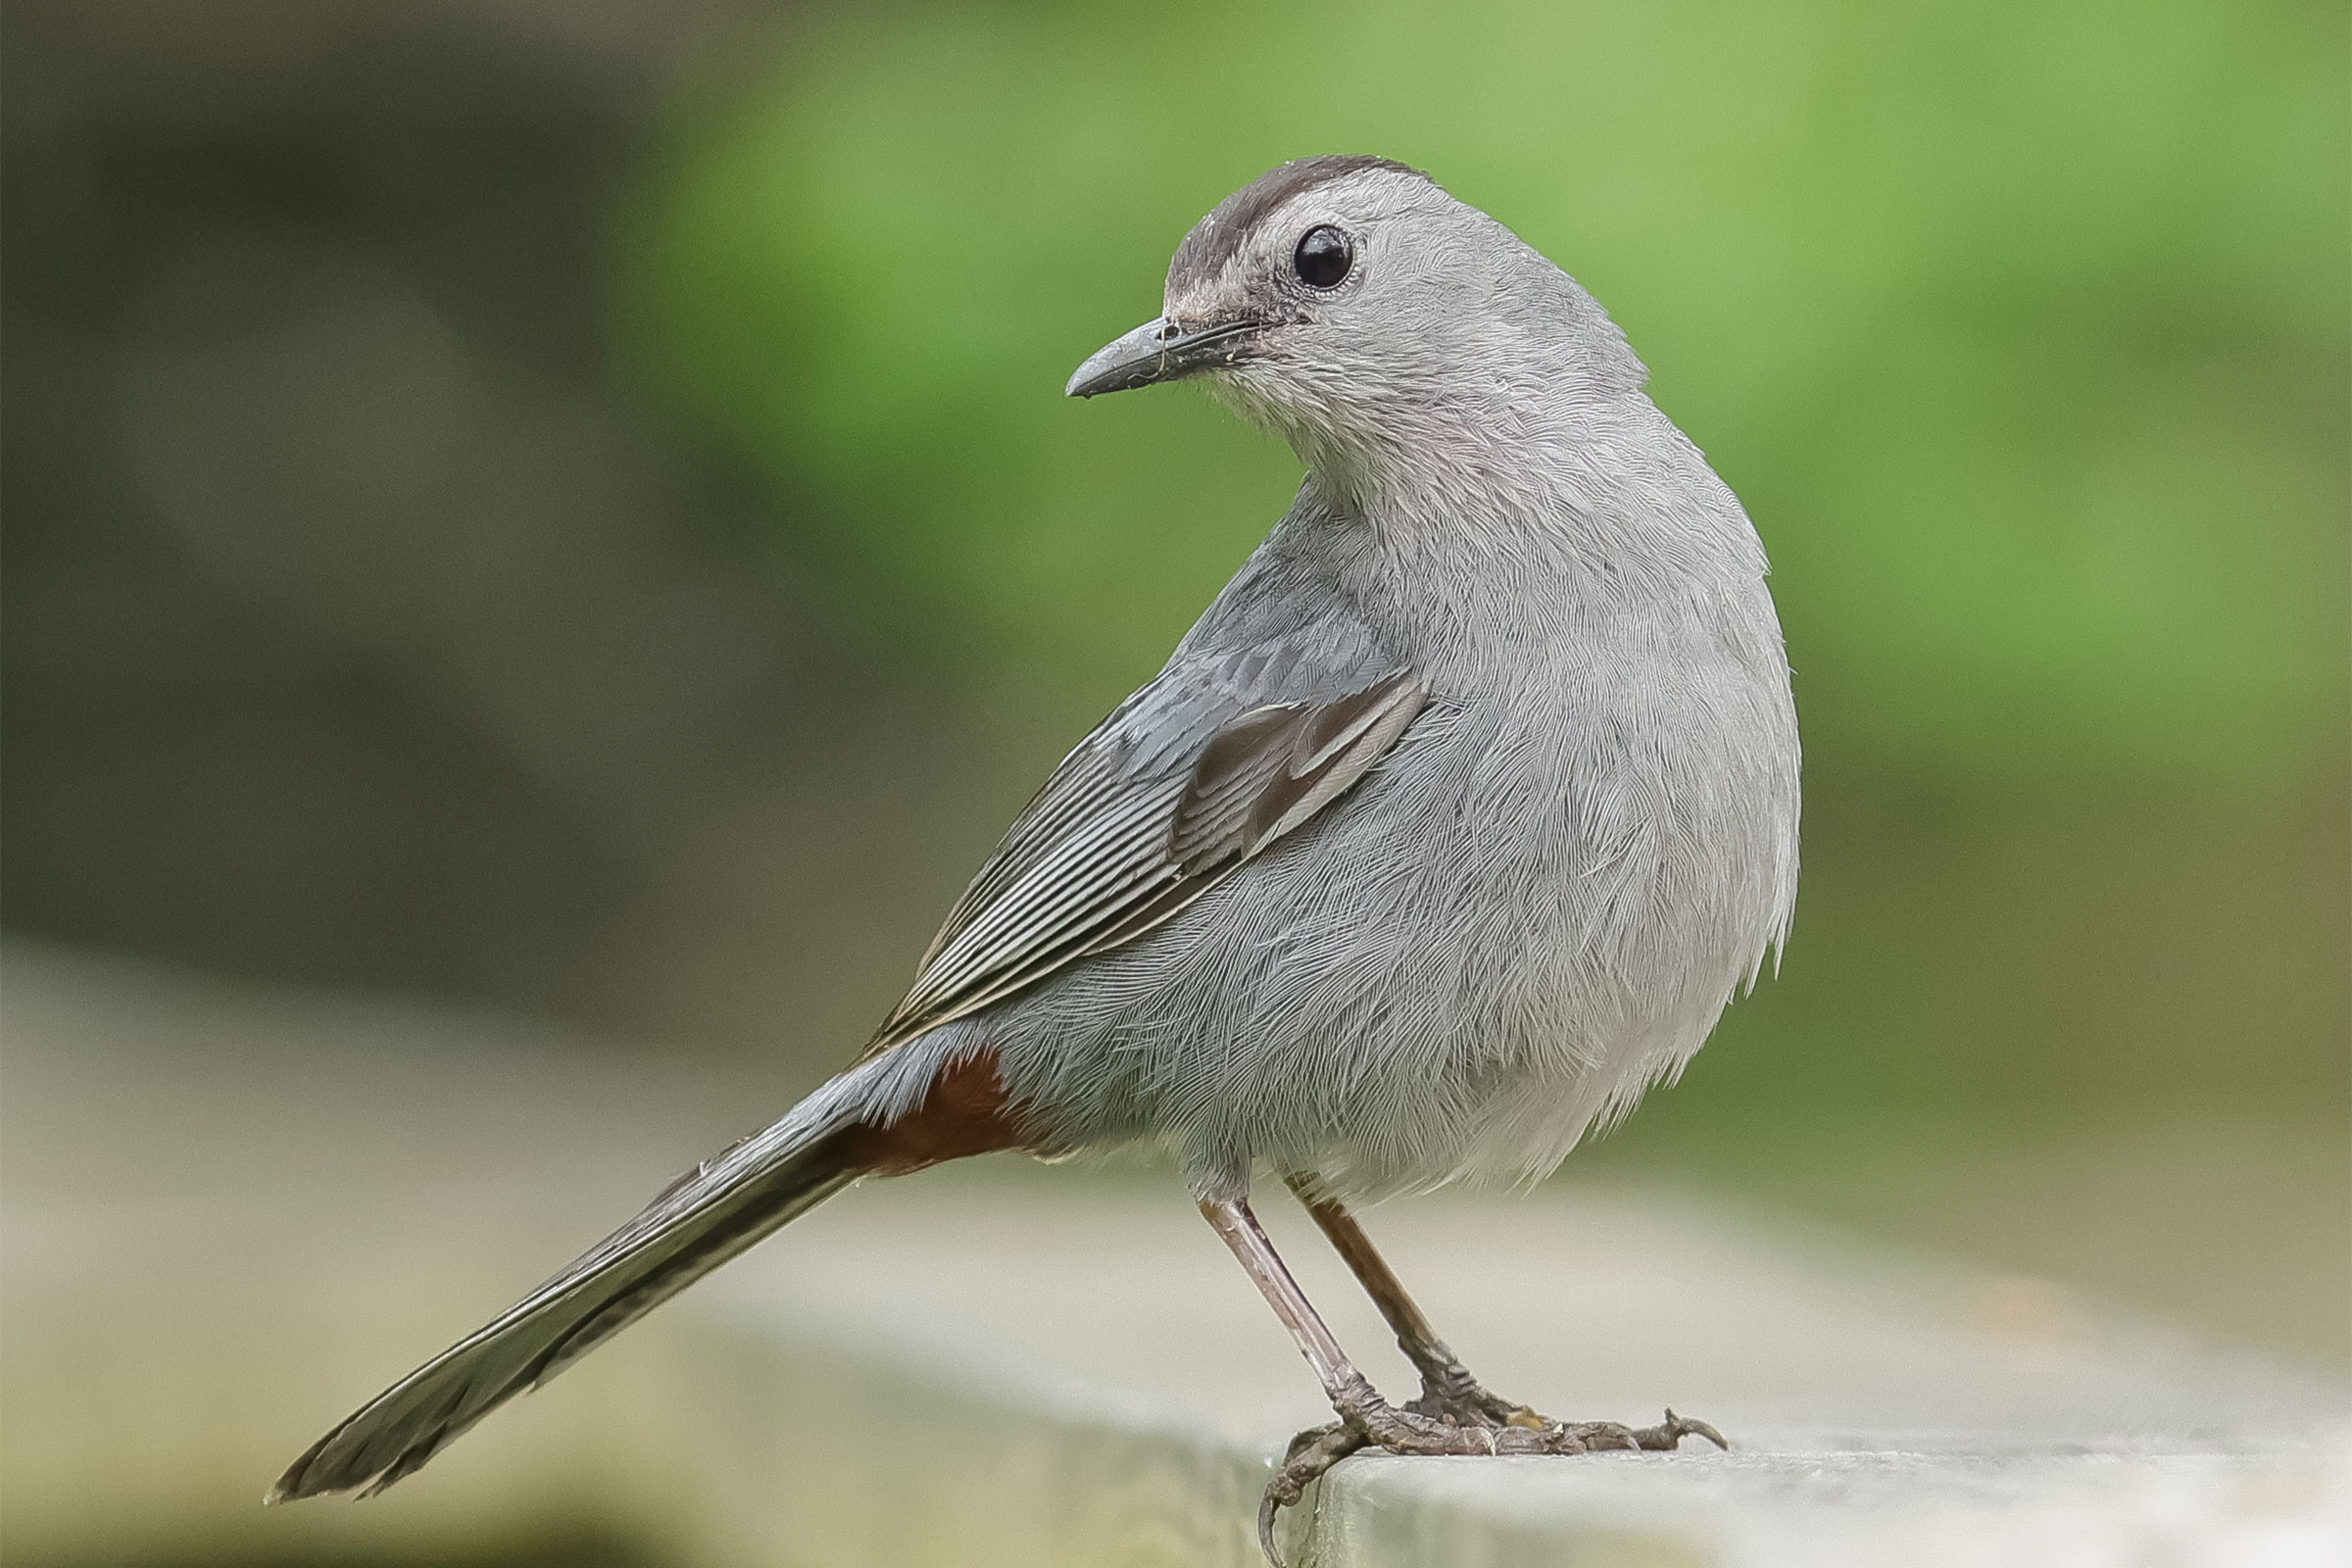
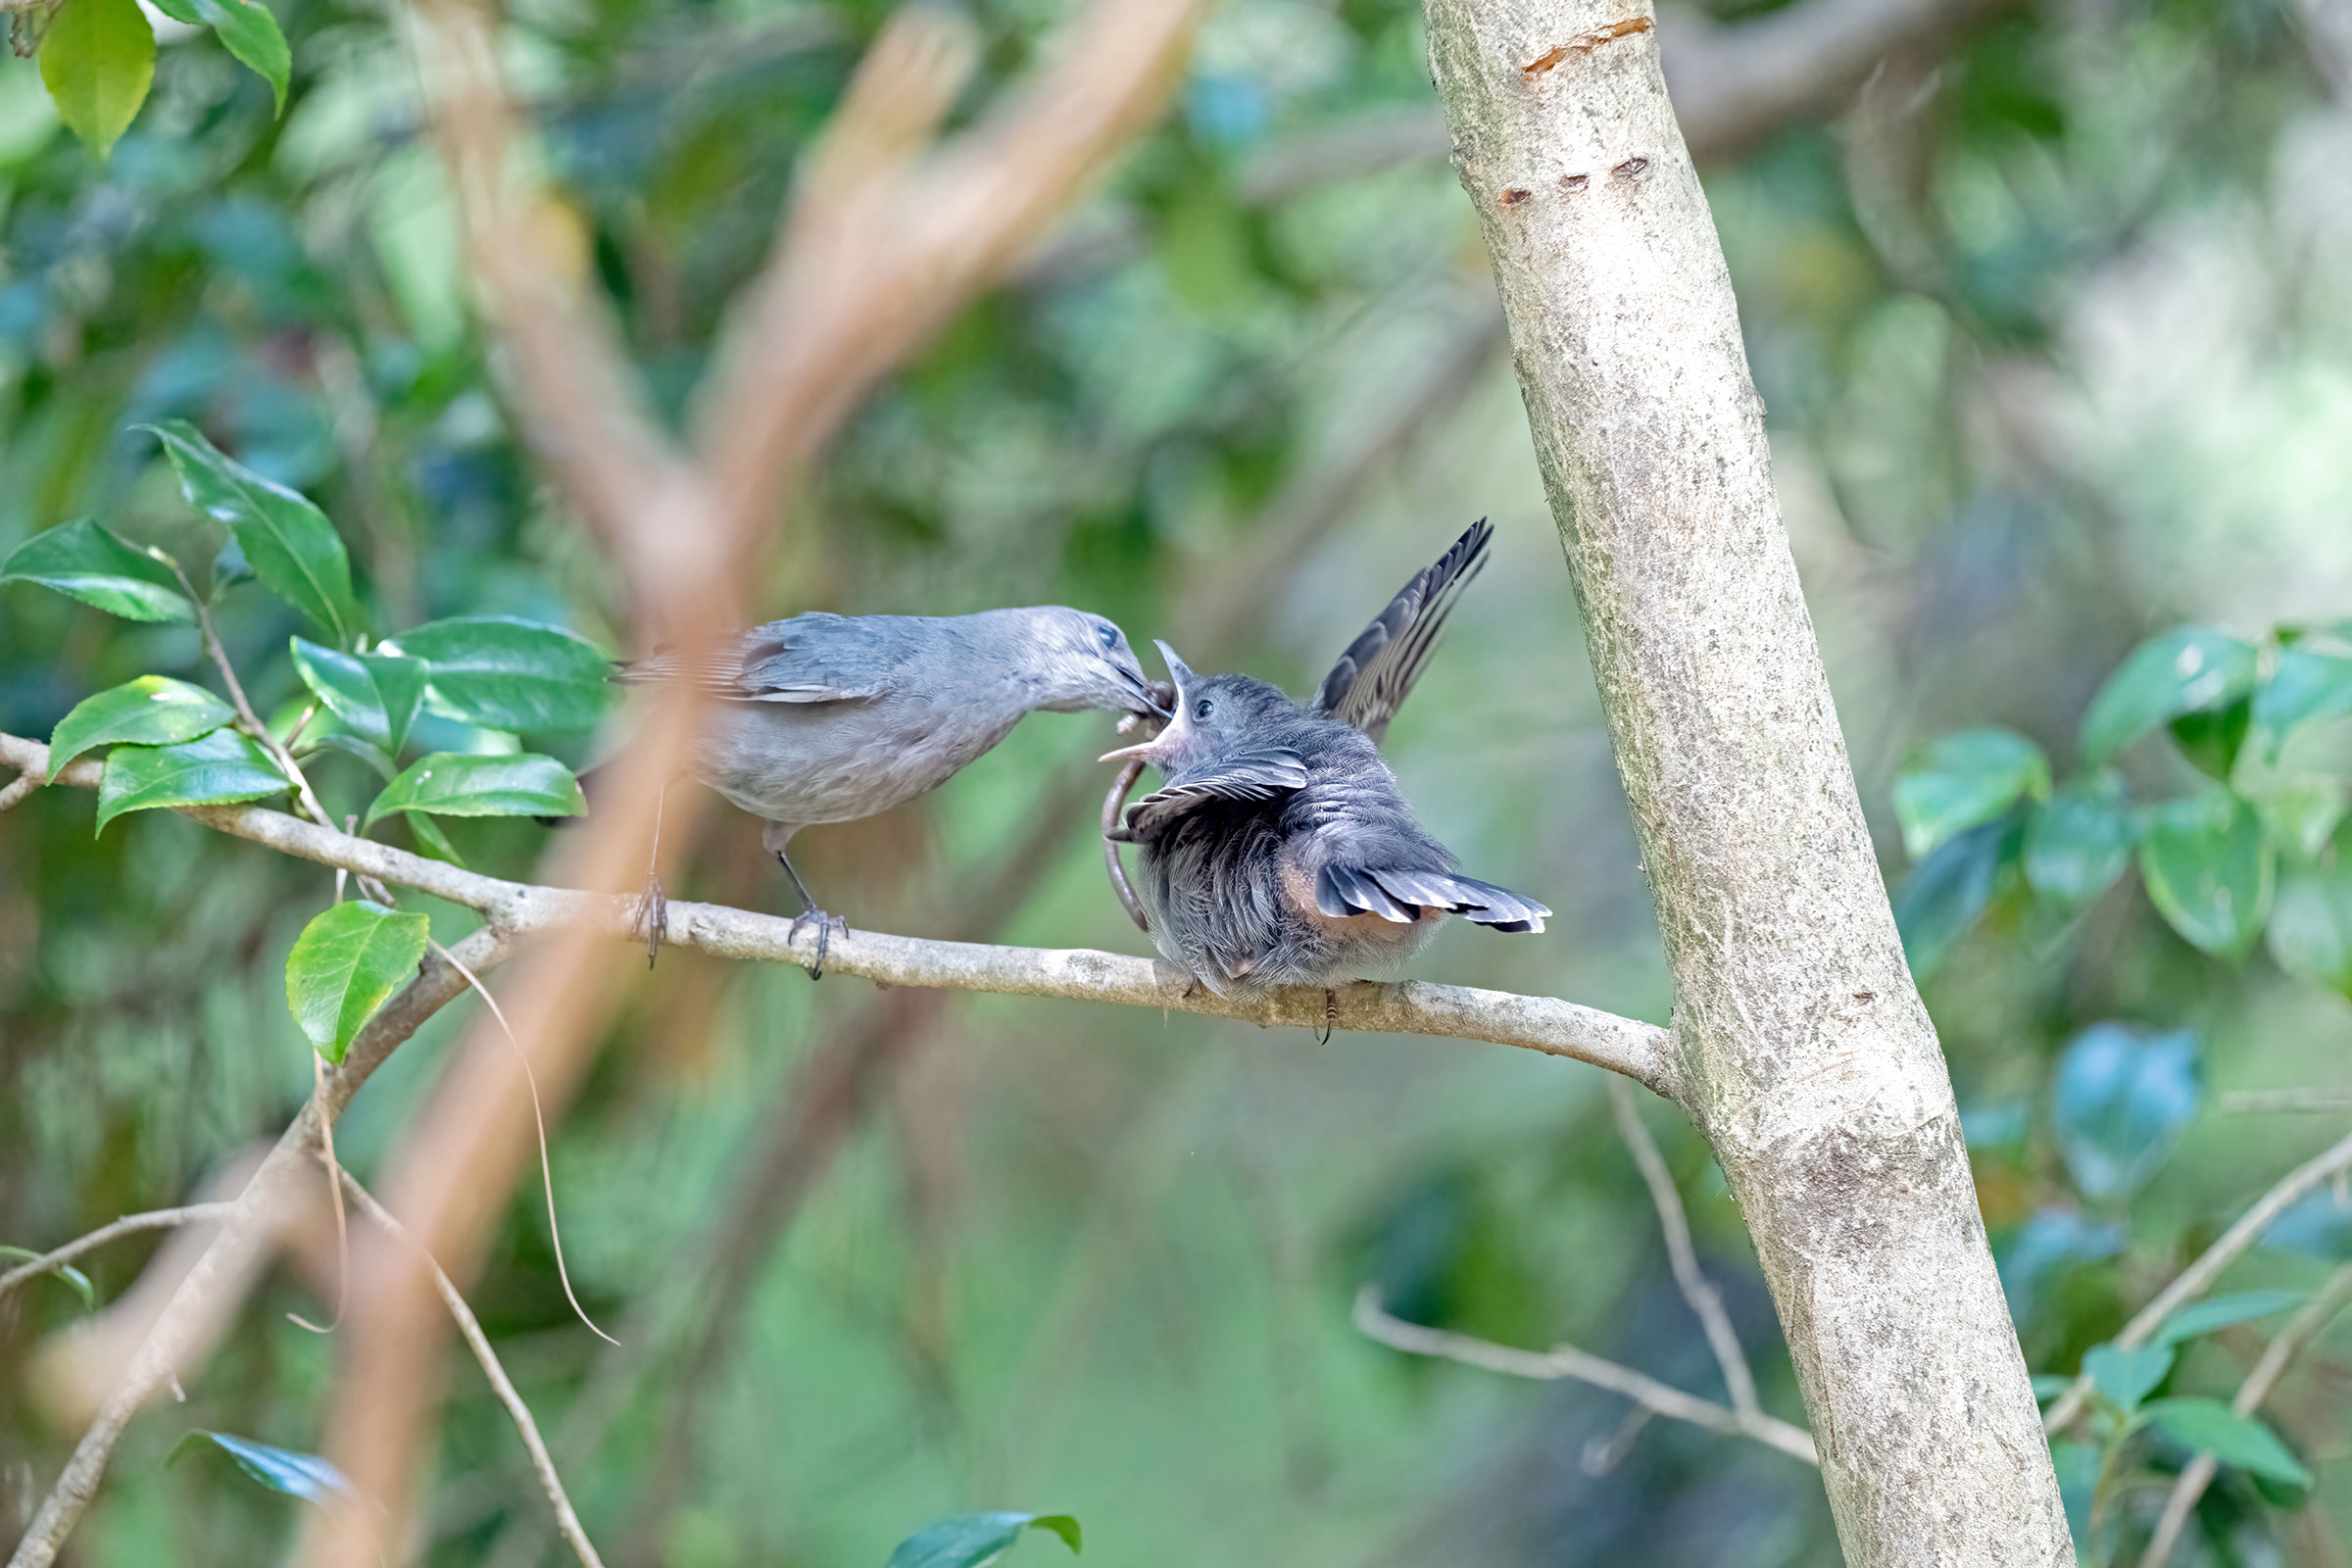
The Gray Catbird, with its clean gray body plumage, black cap, and rusty undertail coverts, is one of three thrushes that mimic other birds’ songs in Virginia. It tends to skulk among shrubs in backyards and overgrown fields, where its frequent calling sounds like a cat’s meow. Unlike Northern Mockingbirds (Mimus polyglottos) and Brown Thrashers (Toxostoma rufum), Gray Catbirds usually do not repeat a phrase within a song (Smith et al. 2020).
Breeding Distribution
The Gray Catbird is found throughout Virginia and is most likely to occur in the Mountains and Valleys region, the northern Piedmont region, and near the urban centers of Richmond and Virginia Beach (Figure 1). Given that Gray Catbirds occur in a range of habitats from forest edges to abandoned farmland to urban areas (Smith et al. 2020), the likelihood Gray Catbirds occur in a block increases as the percentage of forest cover, agricultural (pasture/hay and row crops) areas, and developed lands increases. Its likely occurrence decreases as the number of habitat types increases in a block.
Between the First and Second Atlases, Gray Catbird likelihood of occurrence decreased throughout the southern Piedmont region and much of the Coastal Plain region. It remained constant in the northern portion of the Piedmont region and throughout the Mountains and Valleys region (Figure 3).
View Environmental Associations
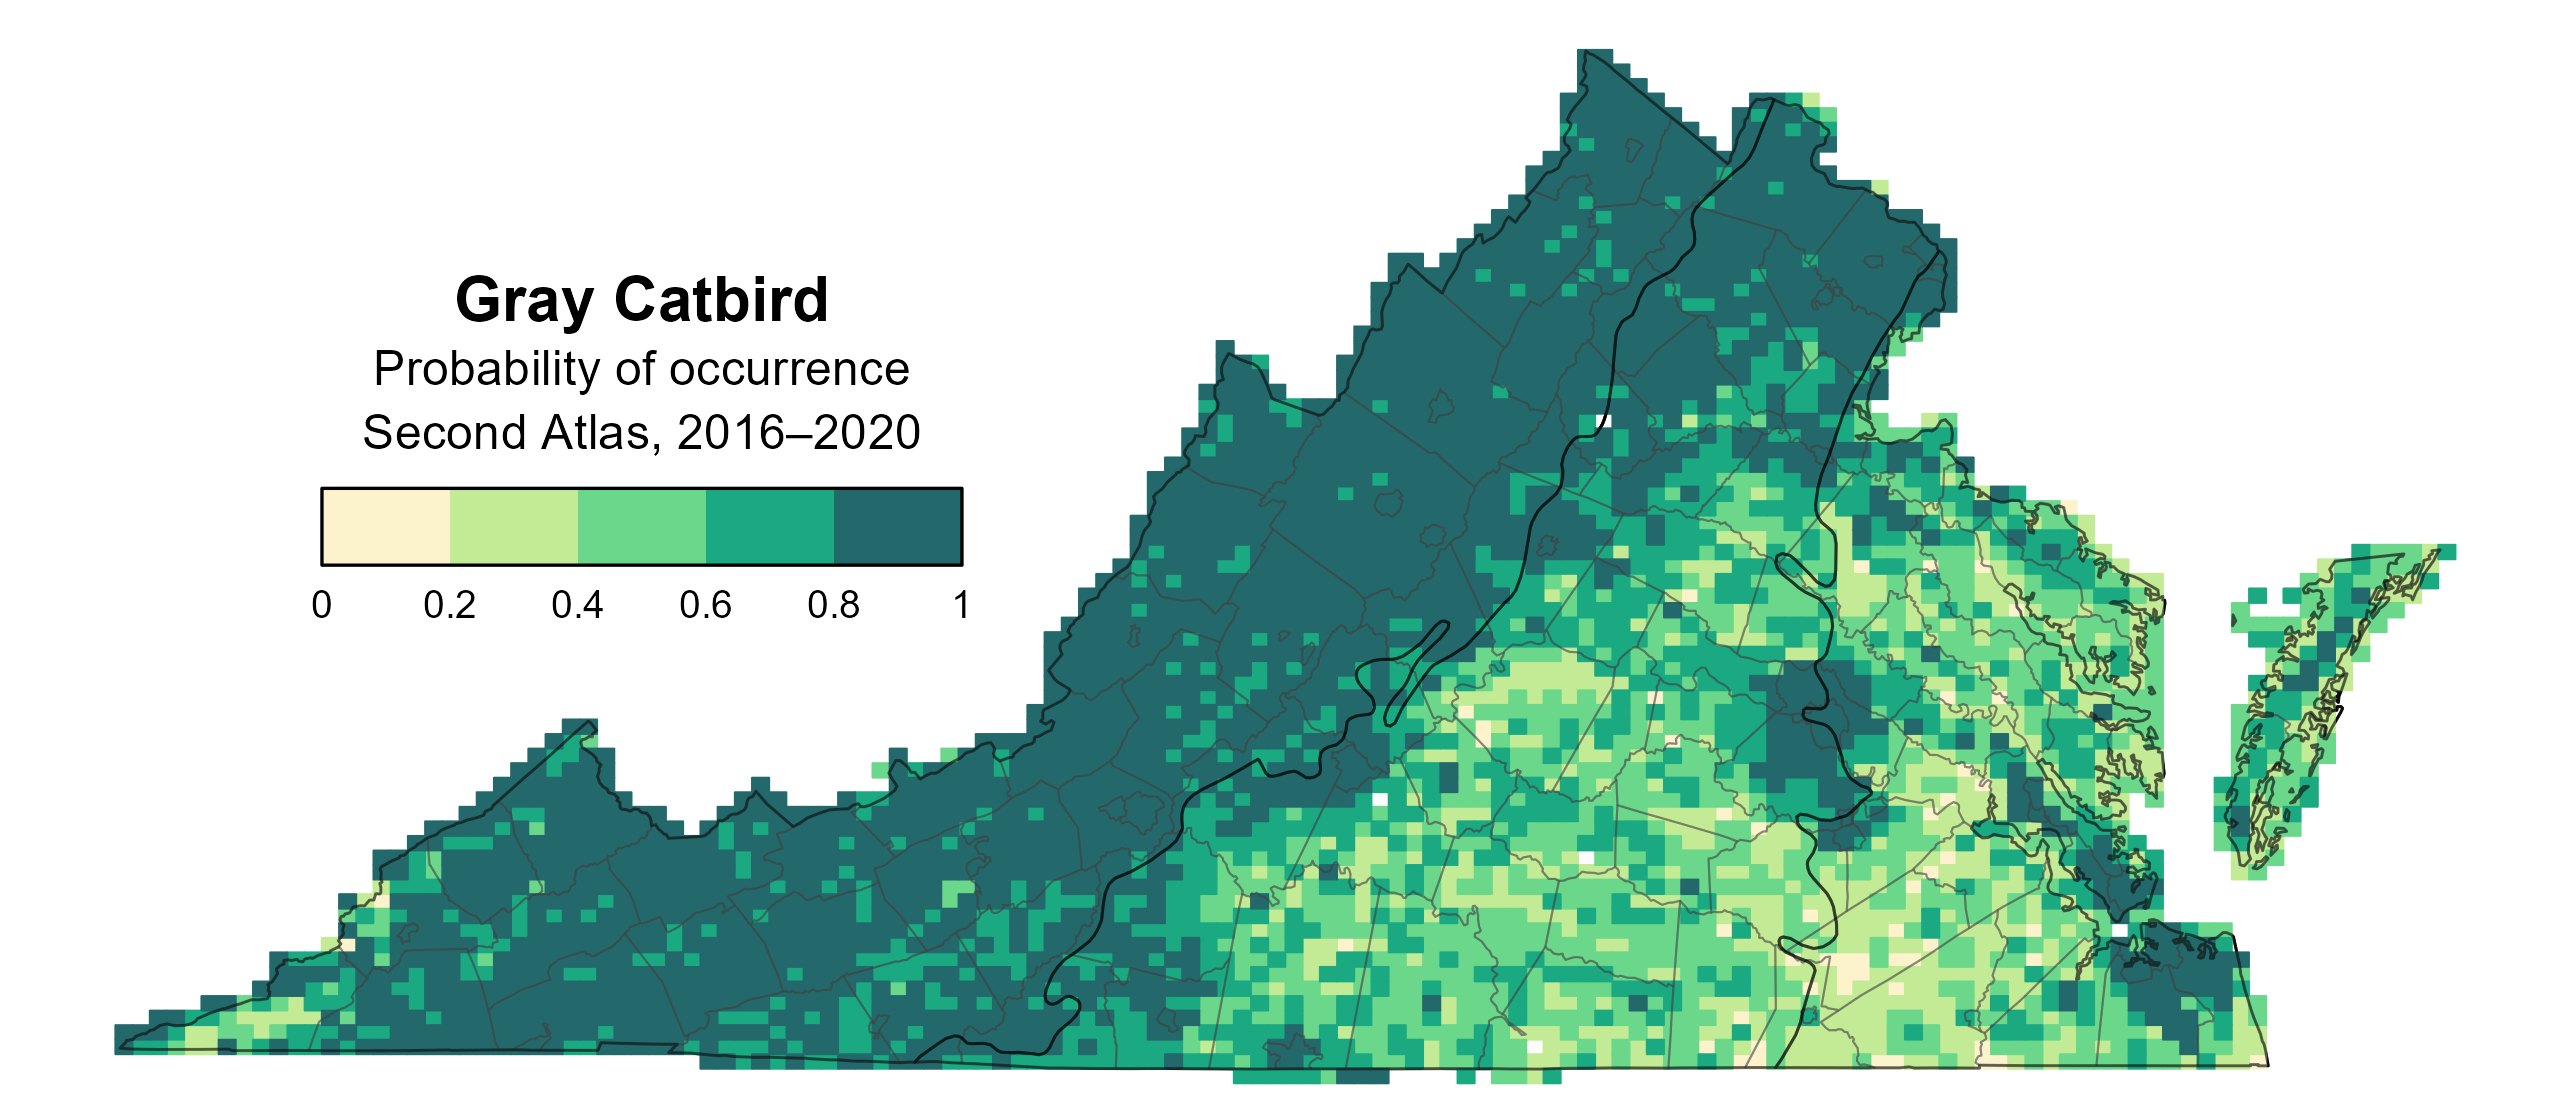
Figure 1: Gray Catbird breeding distribution based on probability of occurrence (Second Atlas, 2016–2020). This map indicates the probability that this species will occur in an Atlas block (an approximately 10 mi2 [26 km2] survey unit) based on environmental (including habitat) factors and after adjusting for the probability of detection (variation in survey effort among blocks).
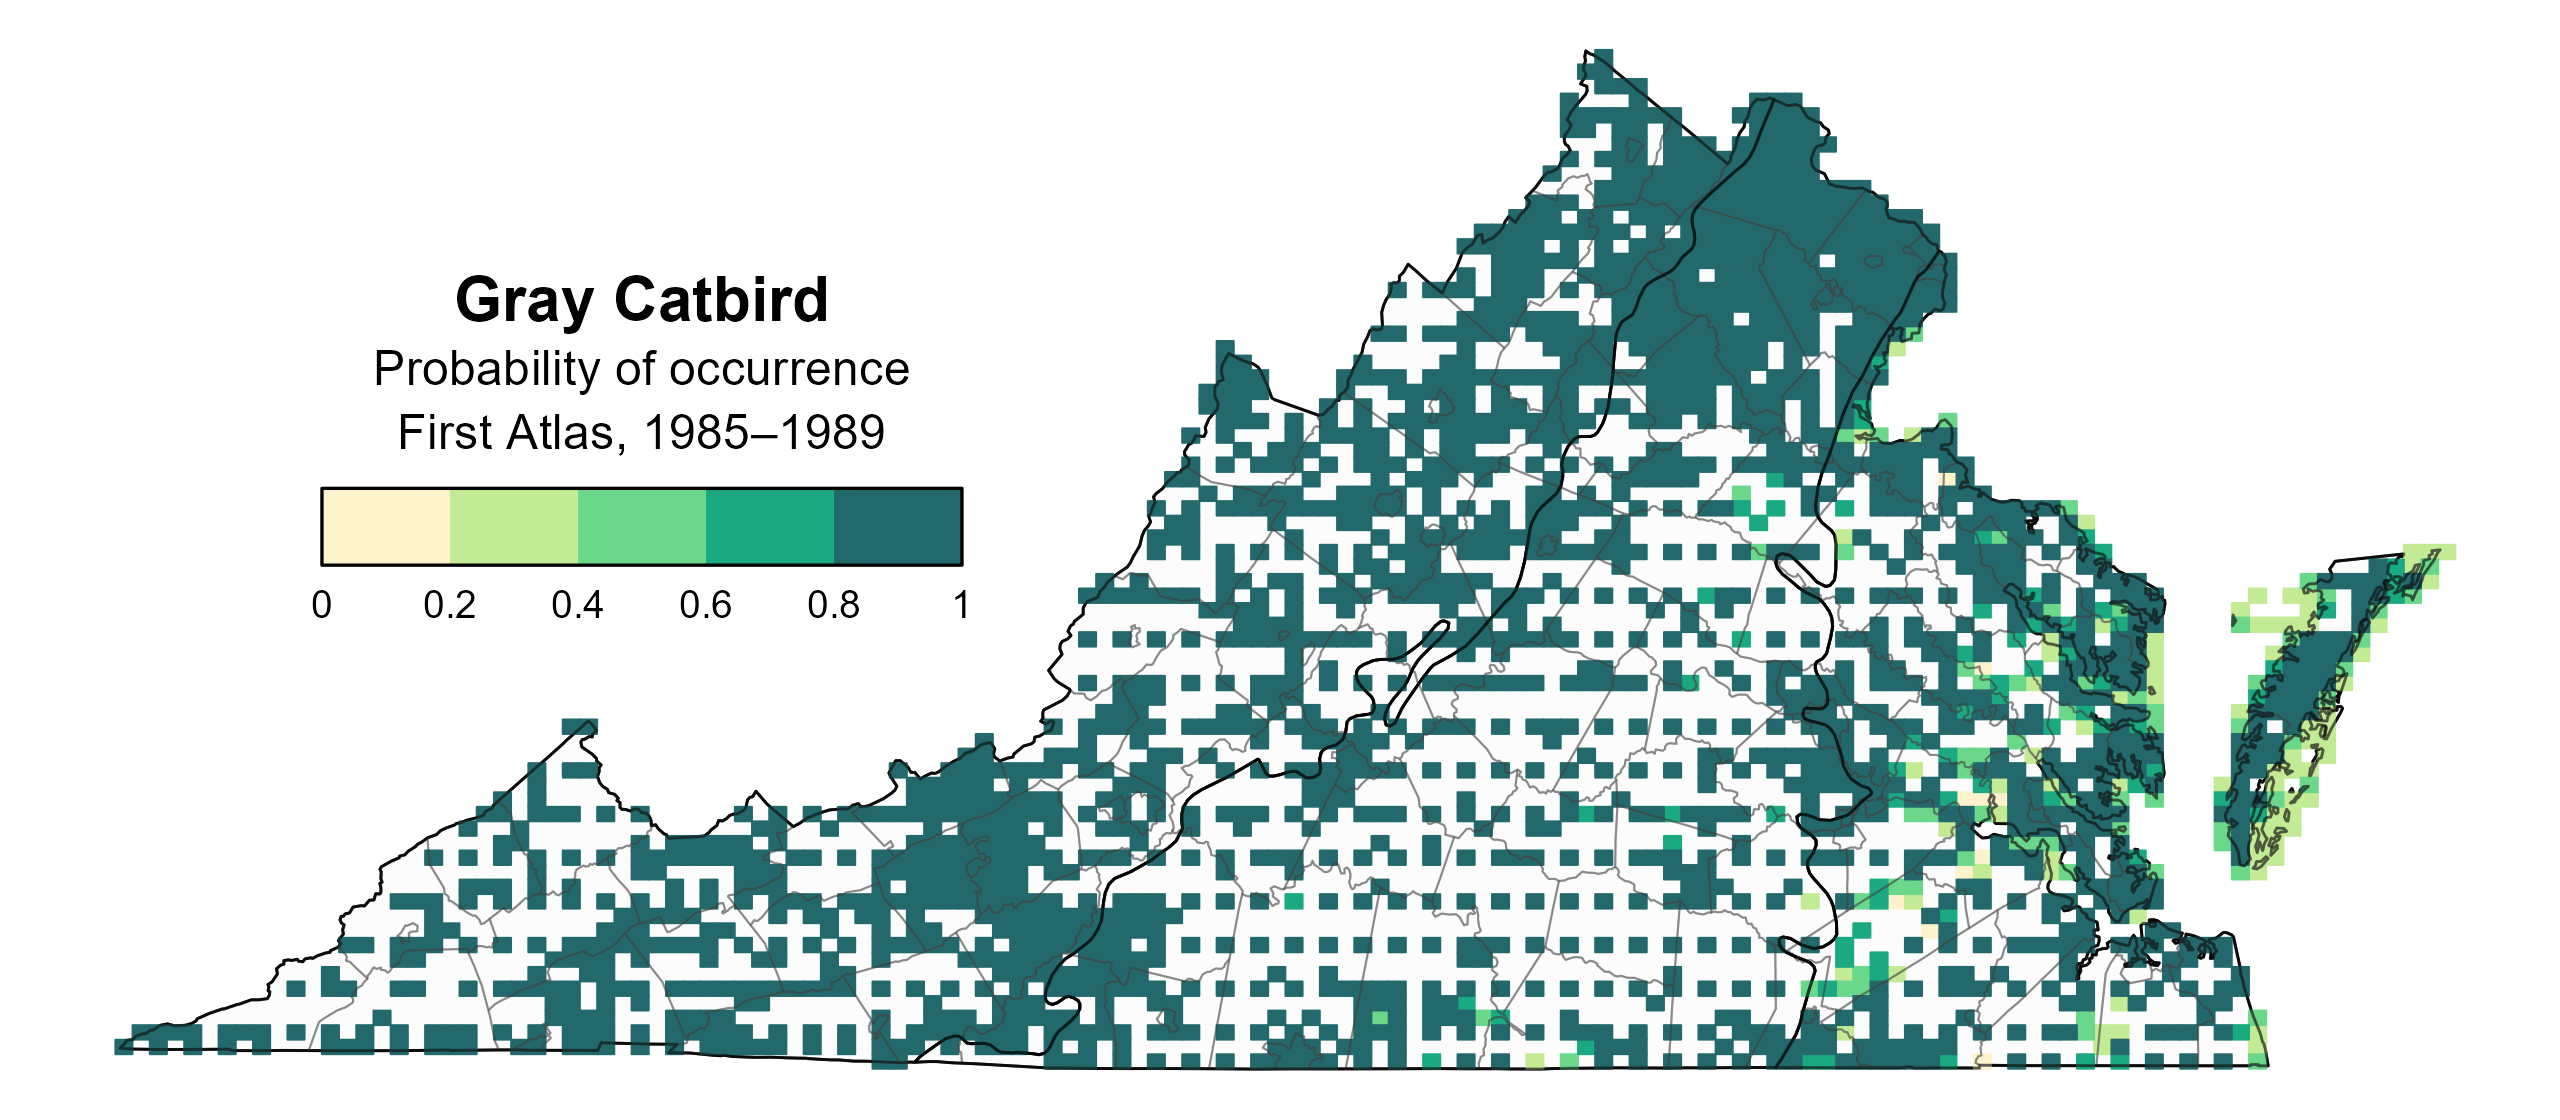
Figure 2: Gray Catbird breeding distribution based on probability of occurrence (First Atlas, 1985–1989). This map indicates the probability that this species will occur in an Atlas block (an approximately 10 mi2 [26 km2] survey unit) based on environmental (including habitat) factors and after adjusting for the probability of detection (variation in survey effort among blocks). Blocks in white were not surveyed during the First Atlas and were not modeled.

Figure 3: Gray Catbird change in breeding distribution between Atlases (1985–1989 and 2016–2020) based on probability of occurrence. This map indicates the change in the probability that this species will occur in a block (an approximately 10 mi2 [26 km2] survey unit) between Atlas periods. Blocks with no change may have constant presence or constant absence. Blocks in white were not surveyed during the First Atlas and were not modeled.
Breeding Evidence
Gray Catbirds were confirmed breeders in 564 blocks and 108 counties and found to be probable breeders in an additional 13 counties (Figure 4). While survey effort may have been greater during the Second Atlas, there was a pattern of a greater number of observations near major urban areas, such as Northern Virginia, Roanoke, Richmond, and Virginia Beach. Gray Catbirds were confirmed breeders throughout much of the state during the First Atlas as well (Figure 5).
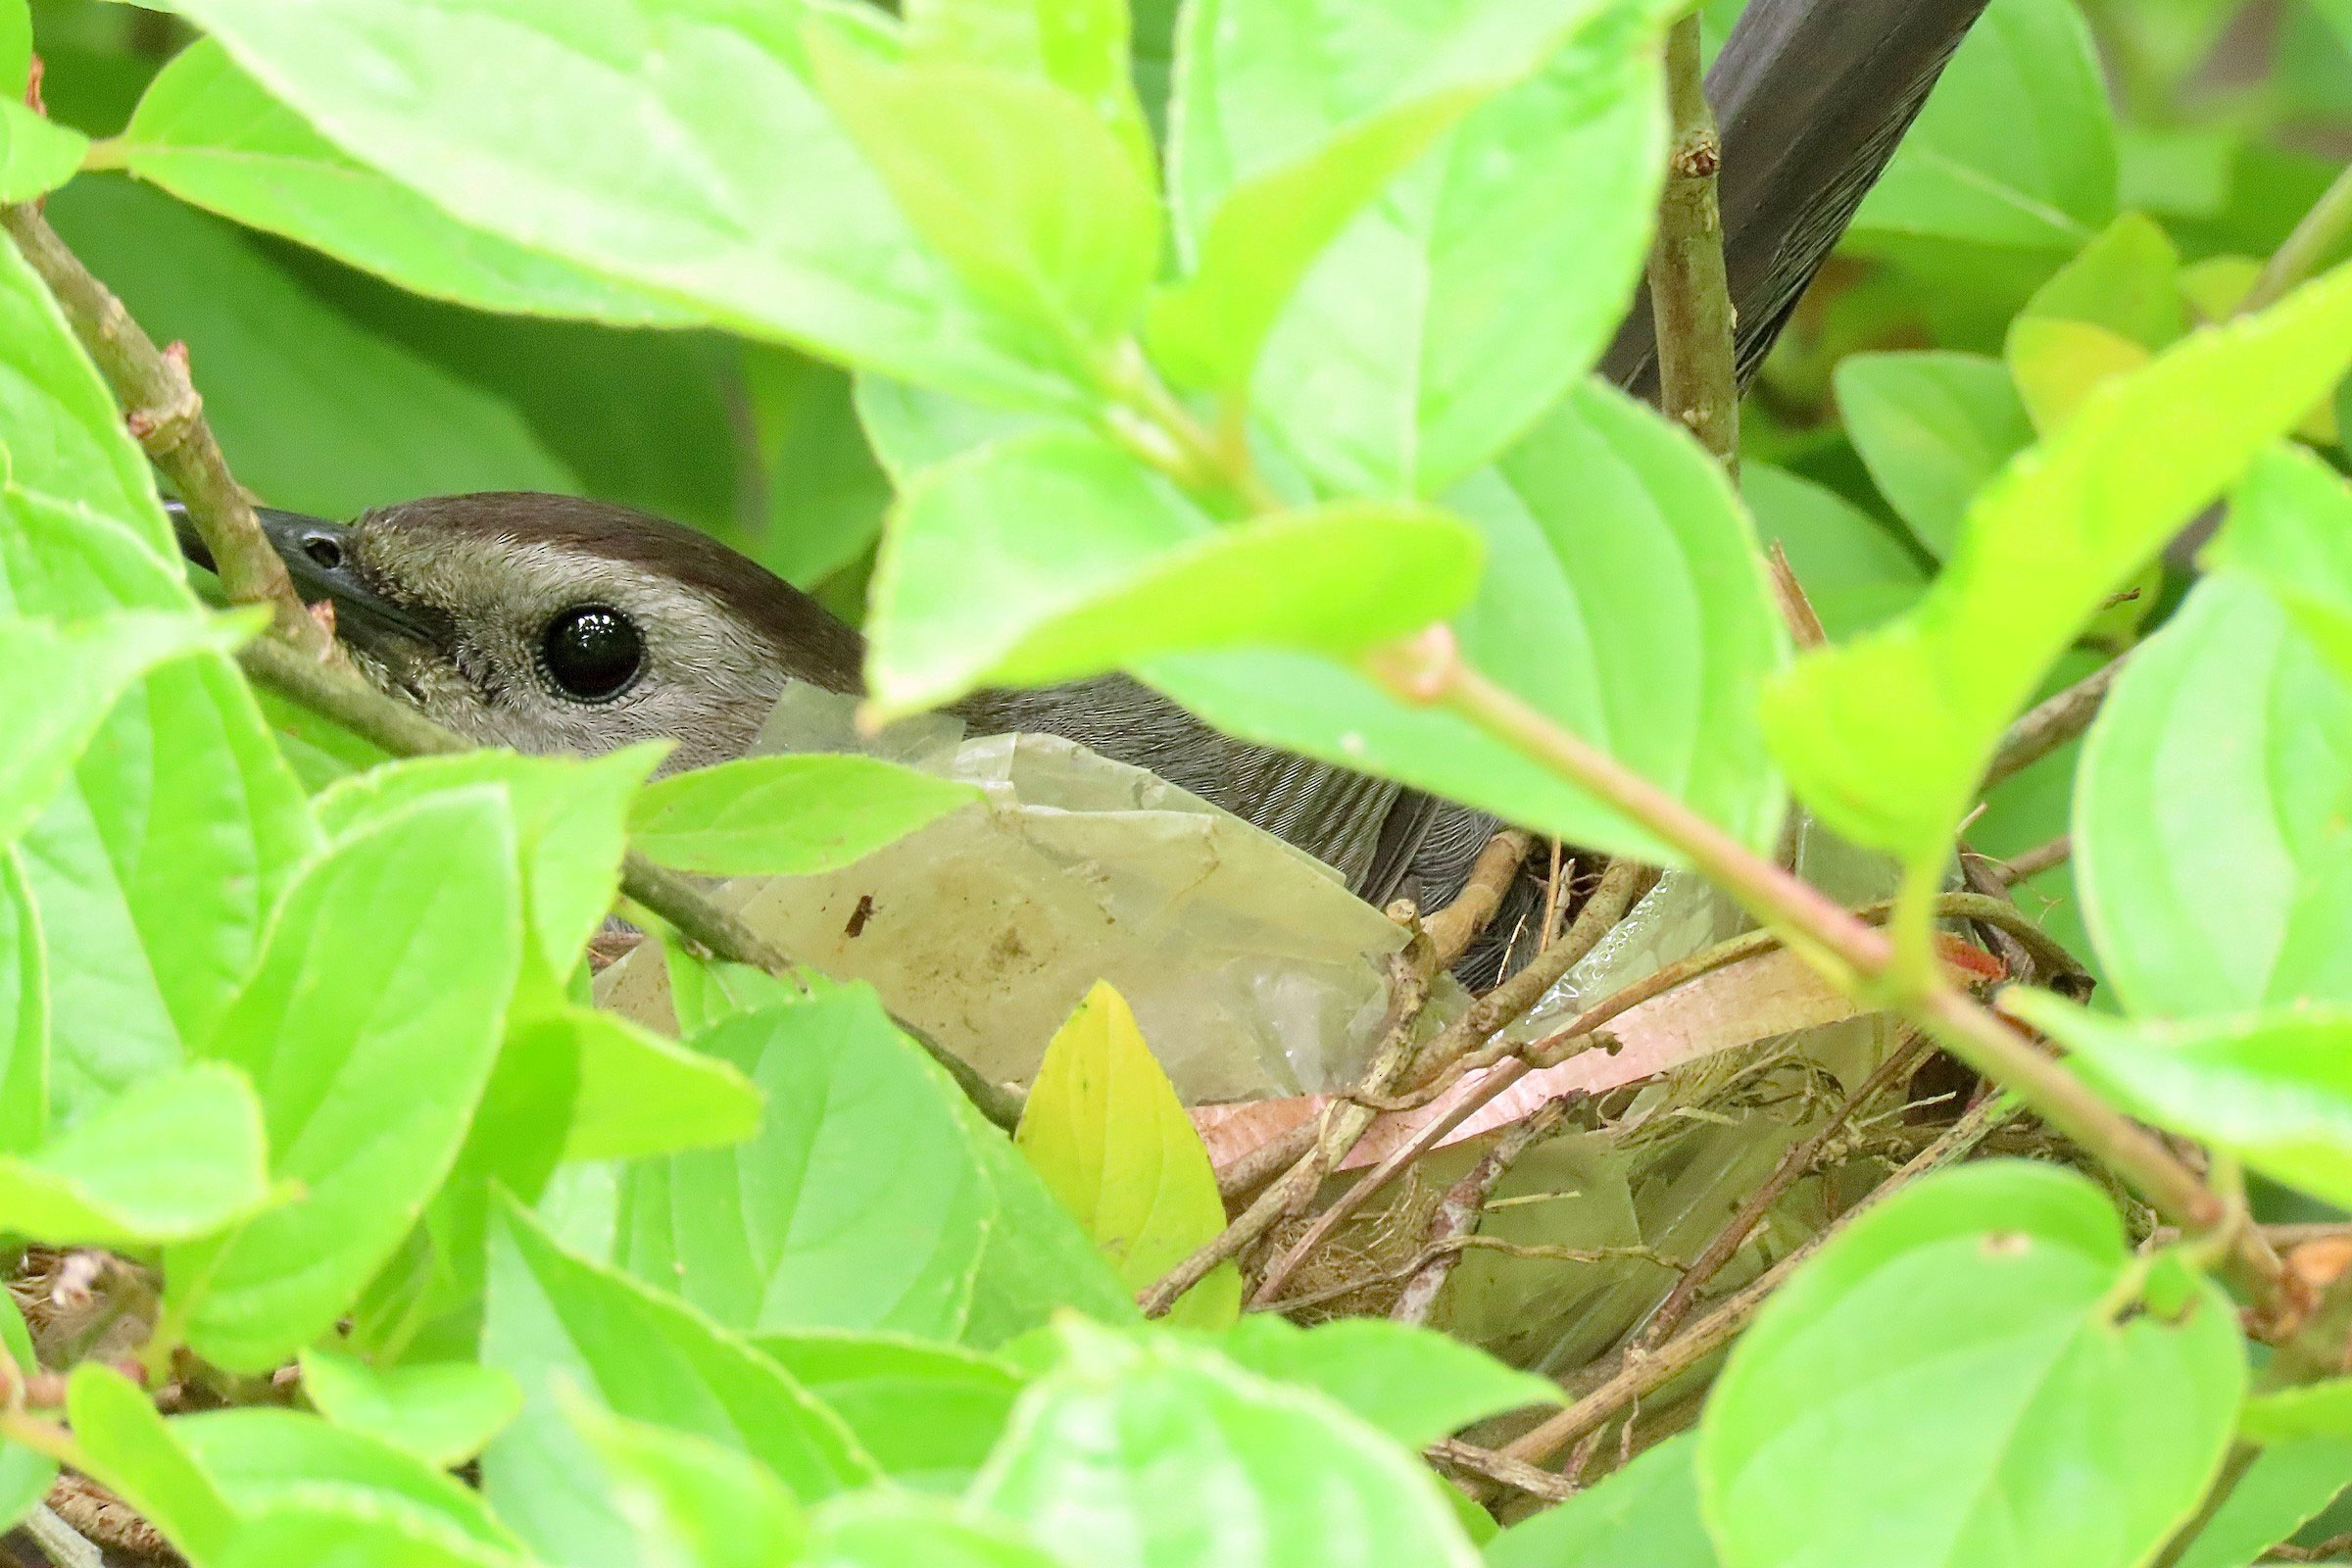
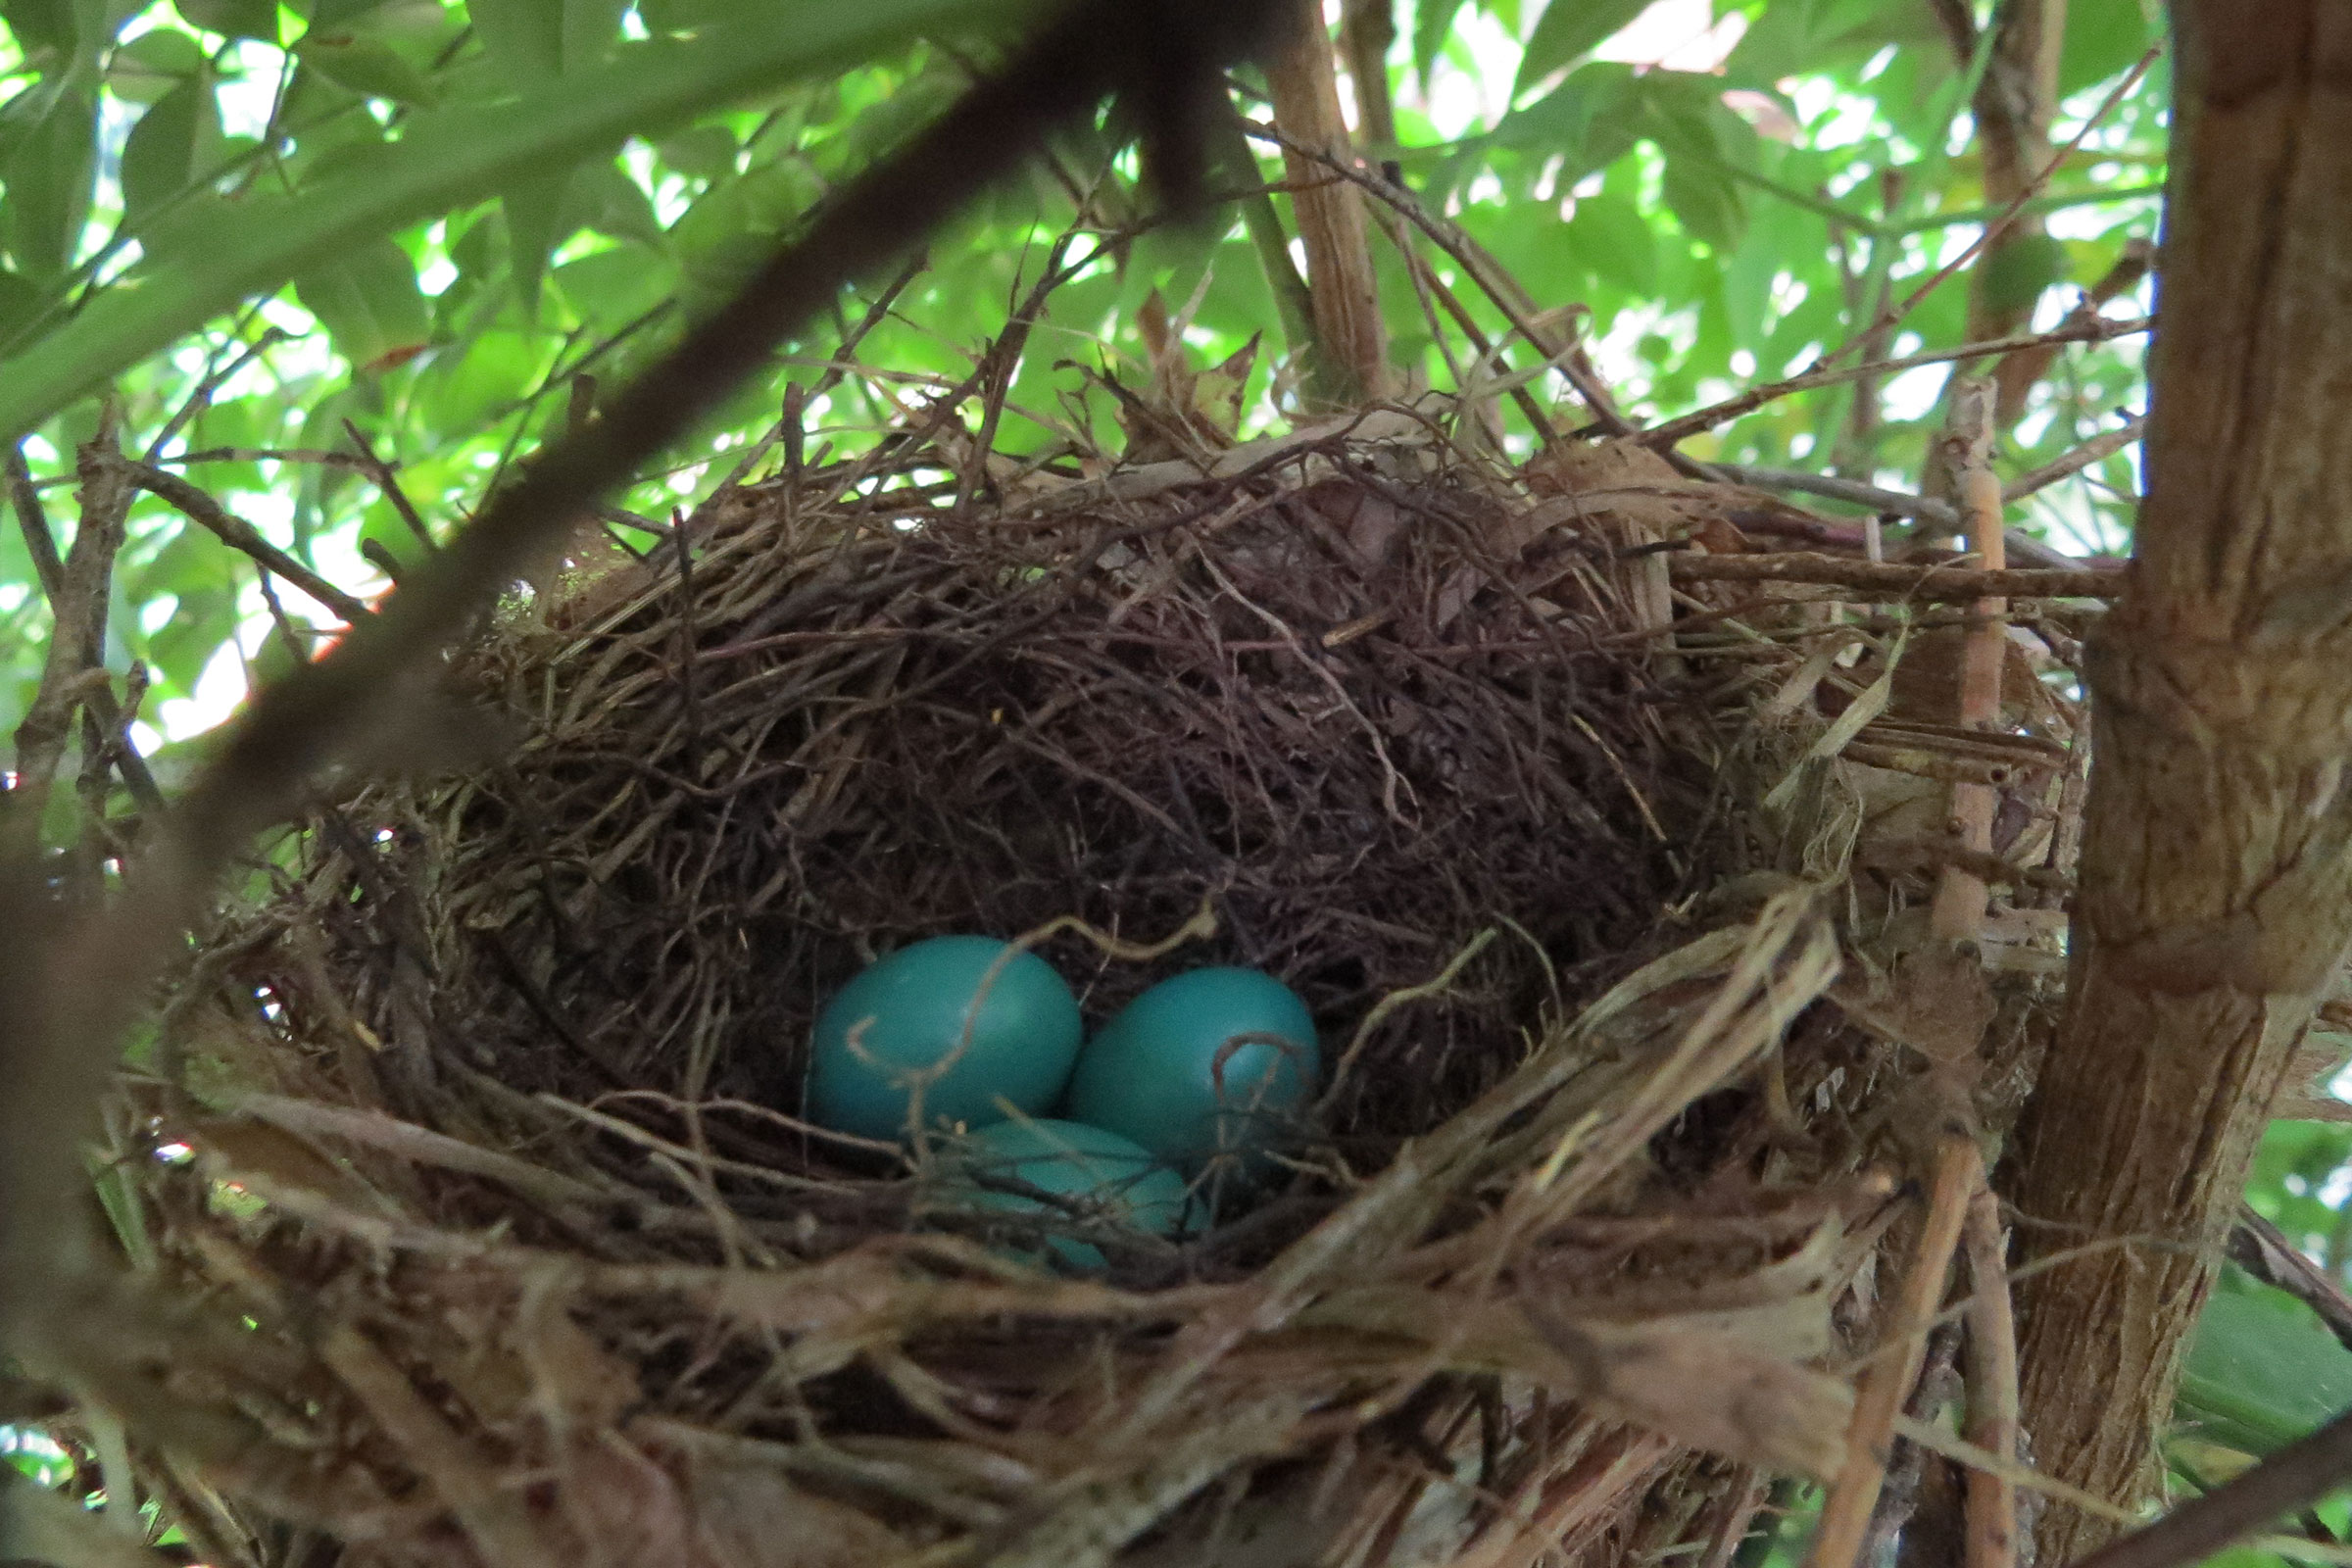
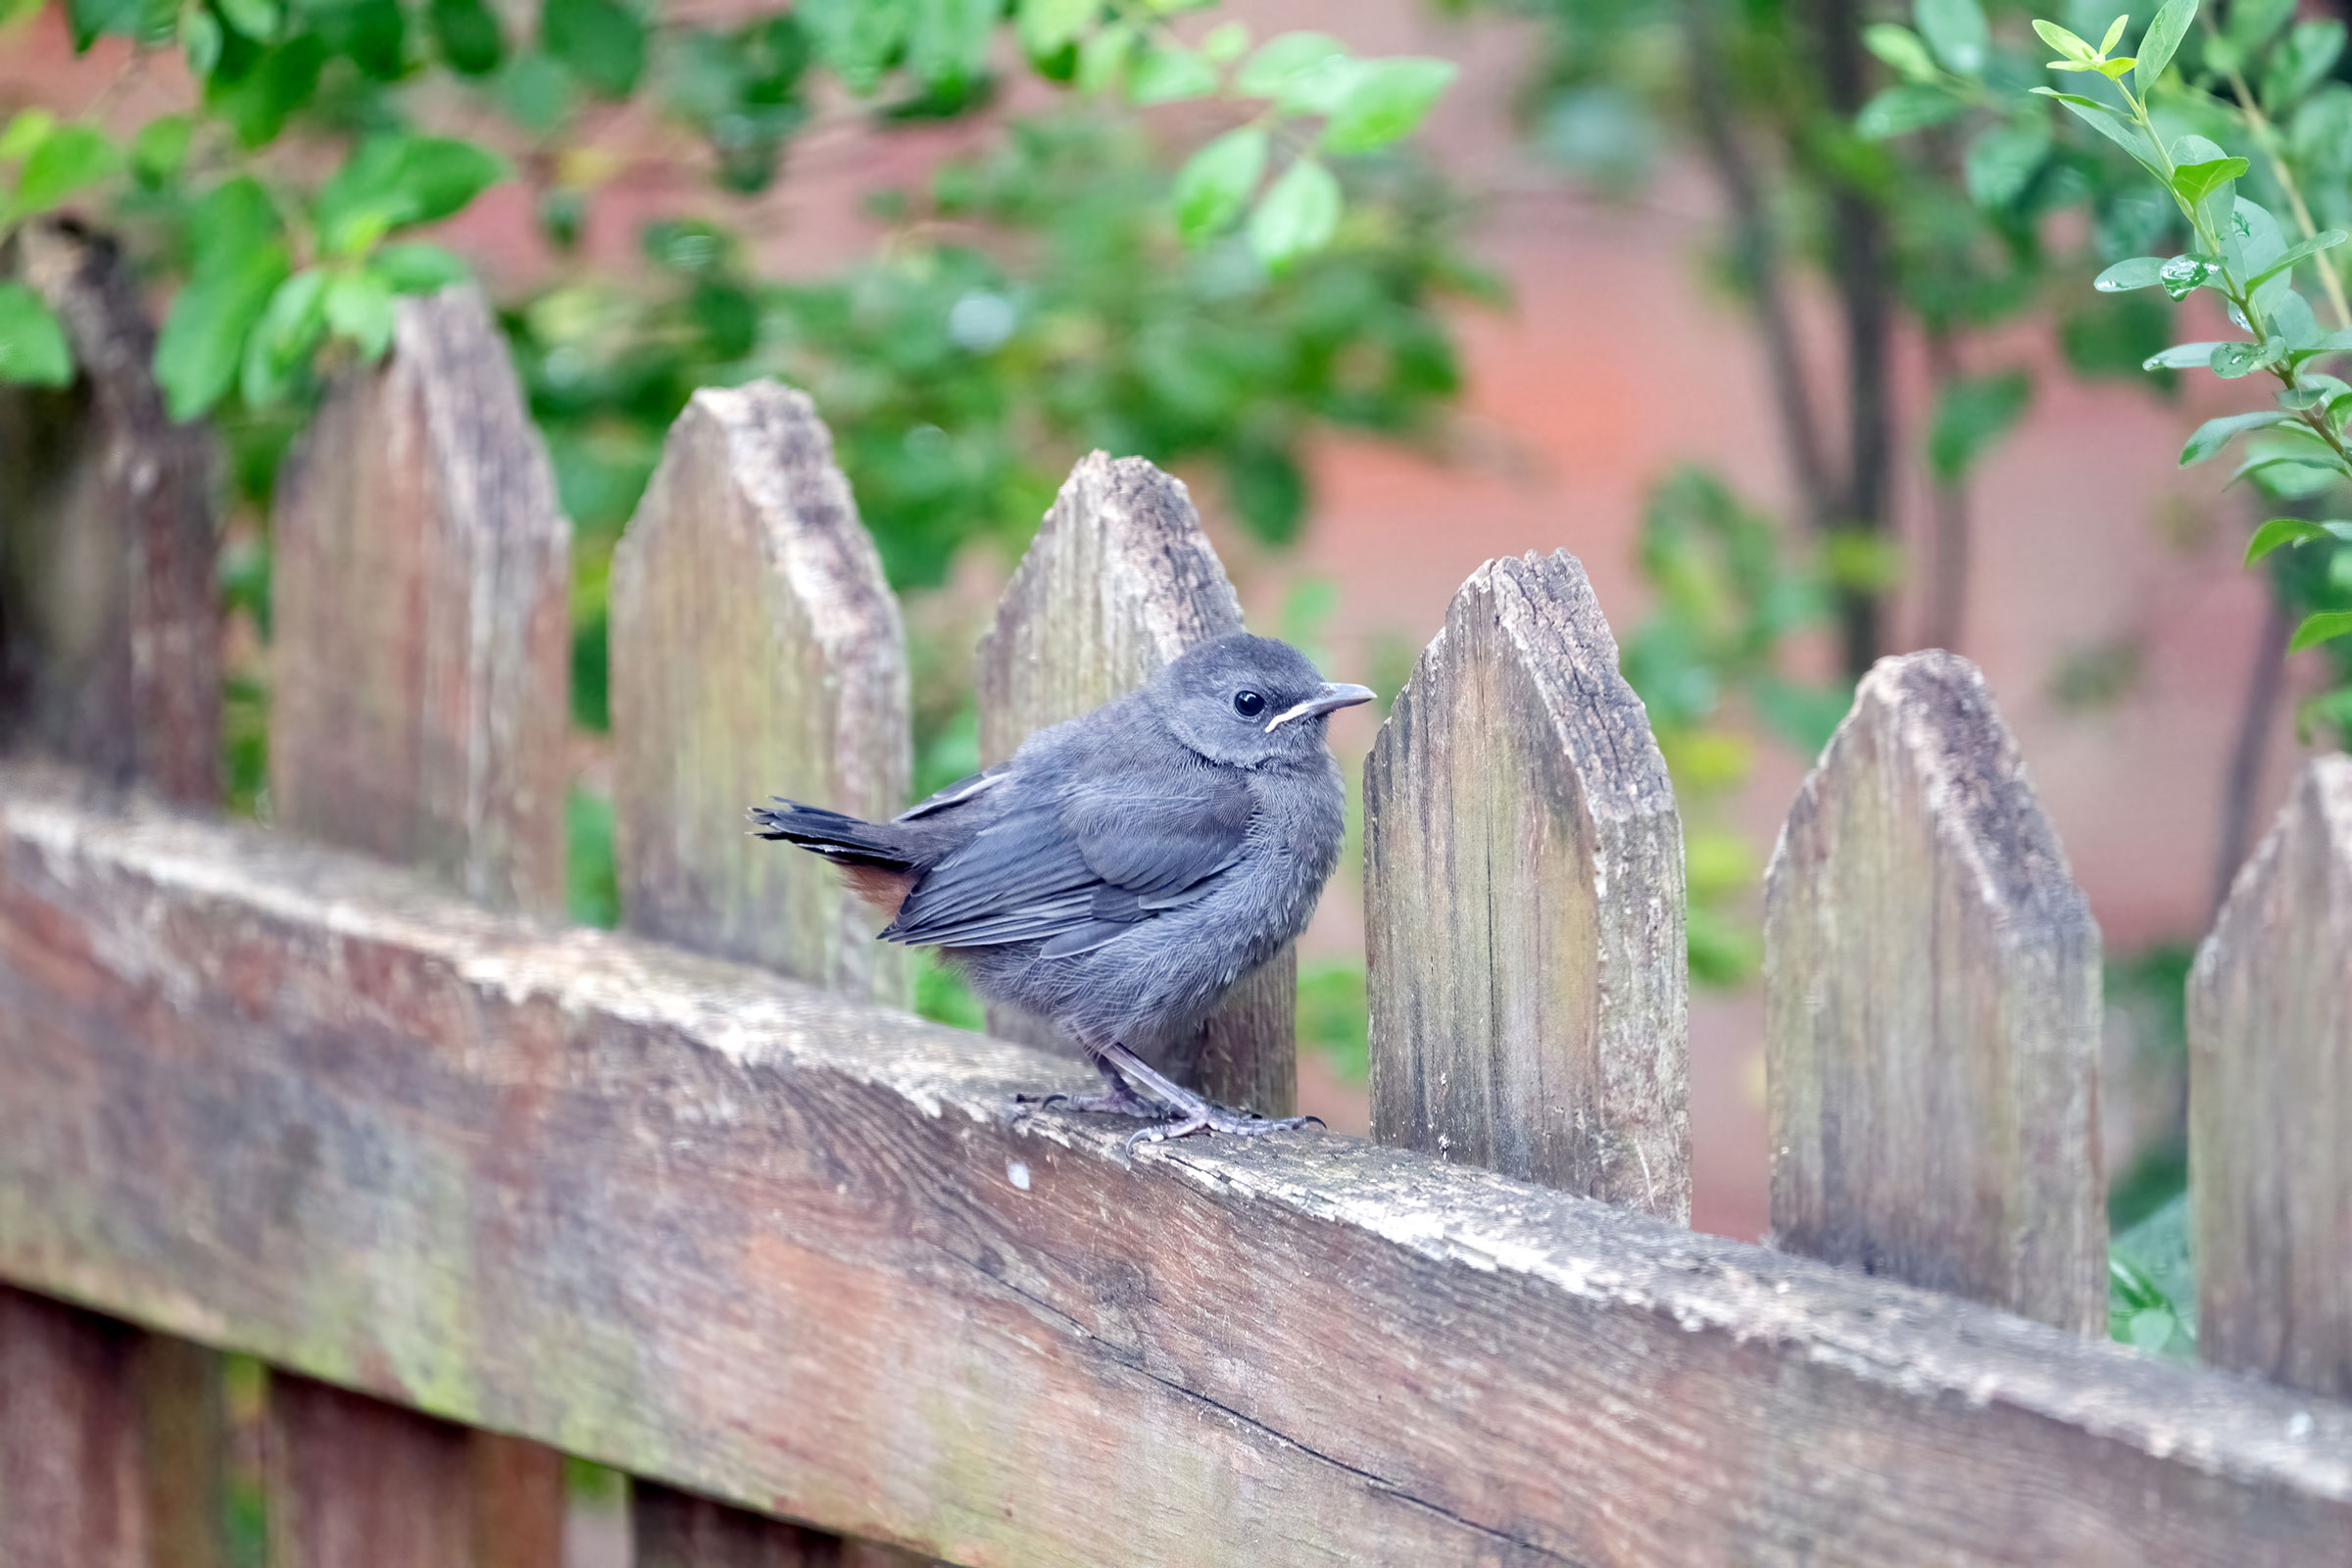
The earliest confirmed breeding behavior was recorded on April 23 and April 25 when birds were observed carrying nest material and nest building, respectively. However, most breeding was confirmed through observations of adults carrying food (May 5 – August 31), recently fledged young (May 14 – September 17), and adults feeding young (May 21 – September 14) (Figure 6).
For more general information on the breeding habits of this species, please refer to All About Birds.

Figure 4: Gray Catbird breeding observations from the Second Atlas (2016–2020). The colored boxes illustrate Atlas blocks (approximately 10 mi2 [26 km2] survey units) where the species was detected. The colors show the highest breeding category recorded in a block. The numbers within the colors in the legend correspond to the number of blocks with that breeding evidence category.
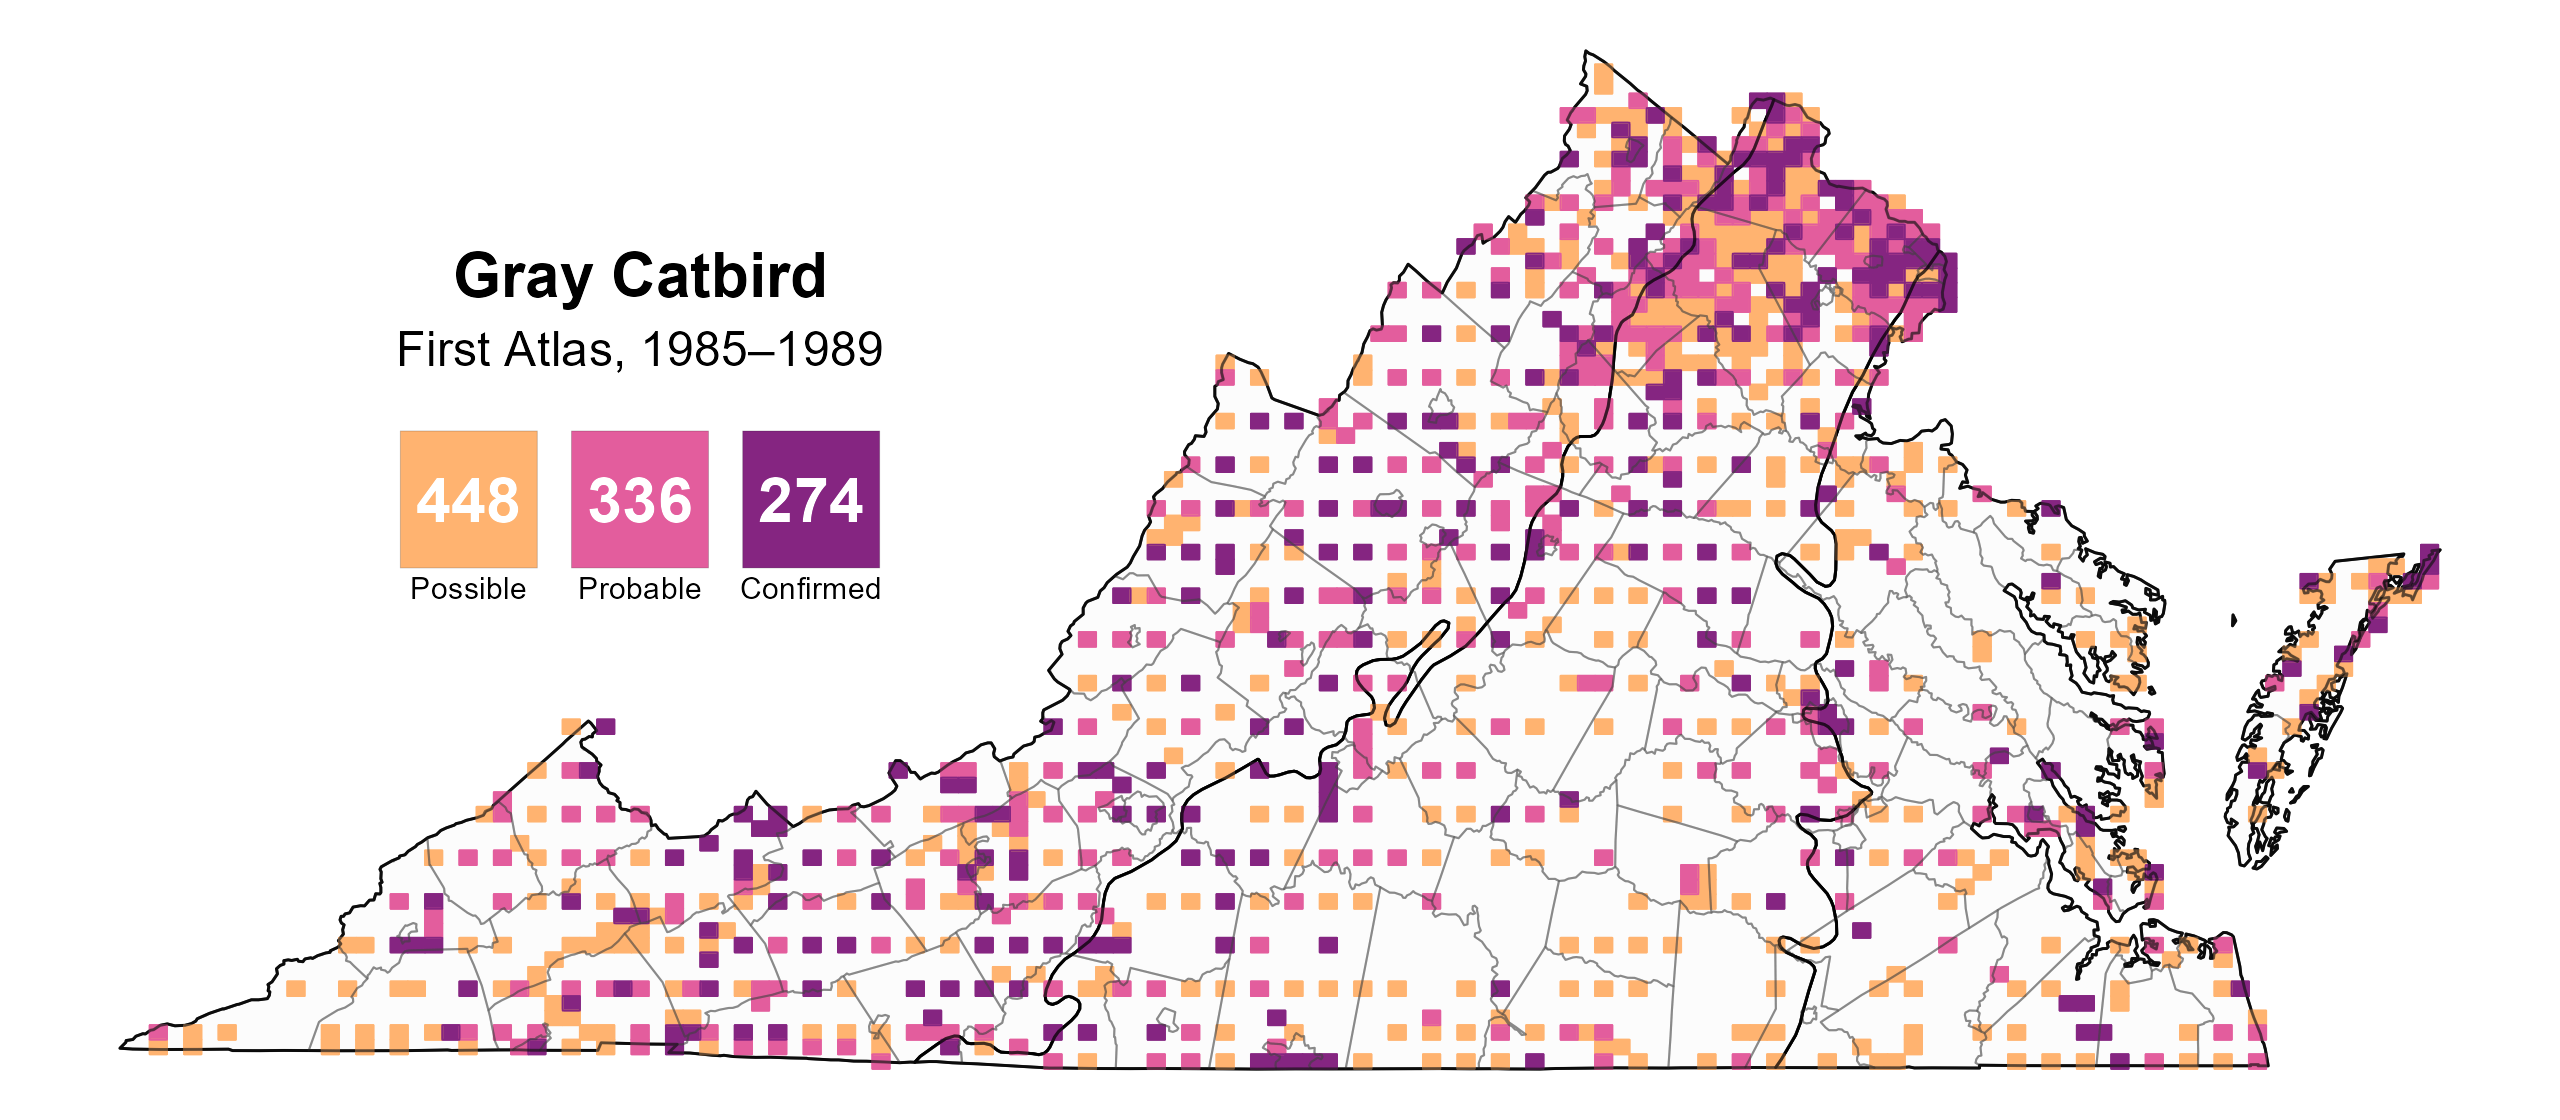
Figure 5: Gray Catbird breeding observations from the First Atlas (1985–1989). The colored boxes illustrate Atlas blocks (approximately 10 mi2 [26 km2] survey units) where the species was detected. The colors show the highest breeding category recorded in a block. The numbers within the colors in the legend correspond to the number of blocks with that breeding evidence category.

Figure 6: Gray Catbird phenology: confirmed breeding codes. This graph shows a timeline of confirmed breeding behaviors. Tick marks represent individual observations of the behavior.
Population Status
Gray Catbird relative abundance was estimated to be highest in the Mountains and Valleys region and near urban areas, such as Northern Virginia, Richmond, and the Hampton Roads-Virginia Beach area (Figure 7).
The total estimated Gray Catbird population in the state is approximately 565,000 individuals (with a range between 436,000 and 736,000). However, its population has experienced a decline in the state. Based on the North American Breeding Bird Survey (BBS), the Gray Catbird population declined by a significant 1.51% annually from 1966–2022 in Virginia, and between Atlases, its population decreased by a significant 1.21% per year from 1987–2018 (Hostetler et al. 2023; Figure 8).

Figure 7: Gray Catbird relative abundance (Second Atlas, 2016–2020). This map indicates the predicted abundance of this species at a 0.4 mi2 (1 km2) scale based on environmental (including habitat) factors. Abundance values are presented on a relative scale of low to high.
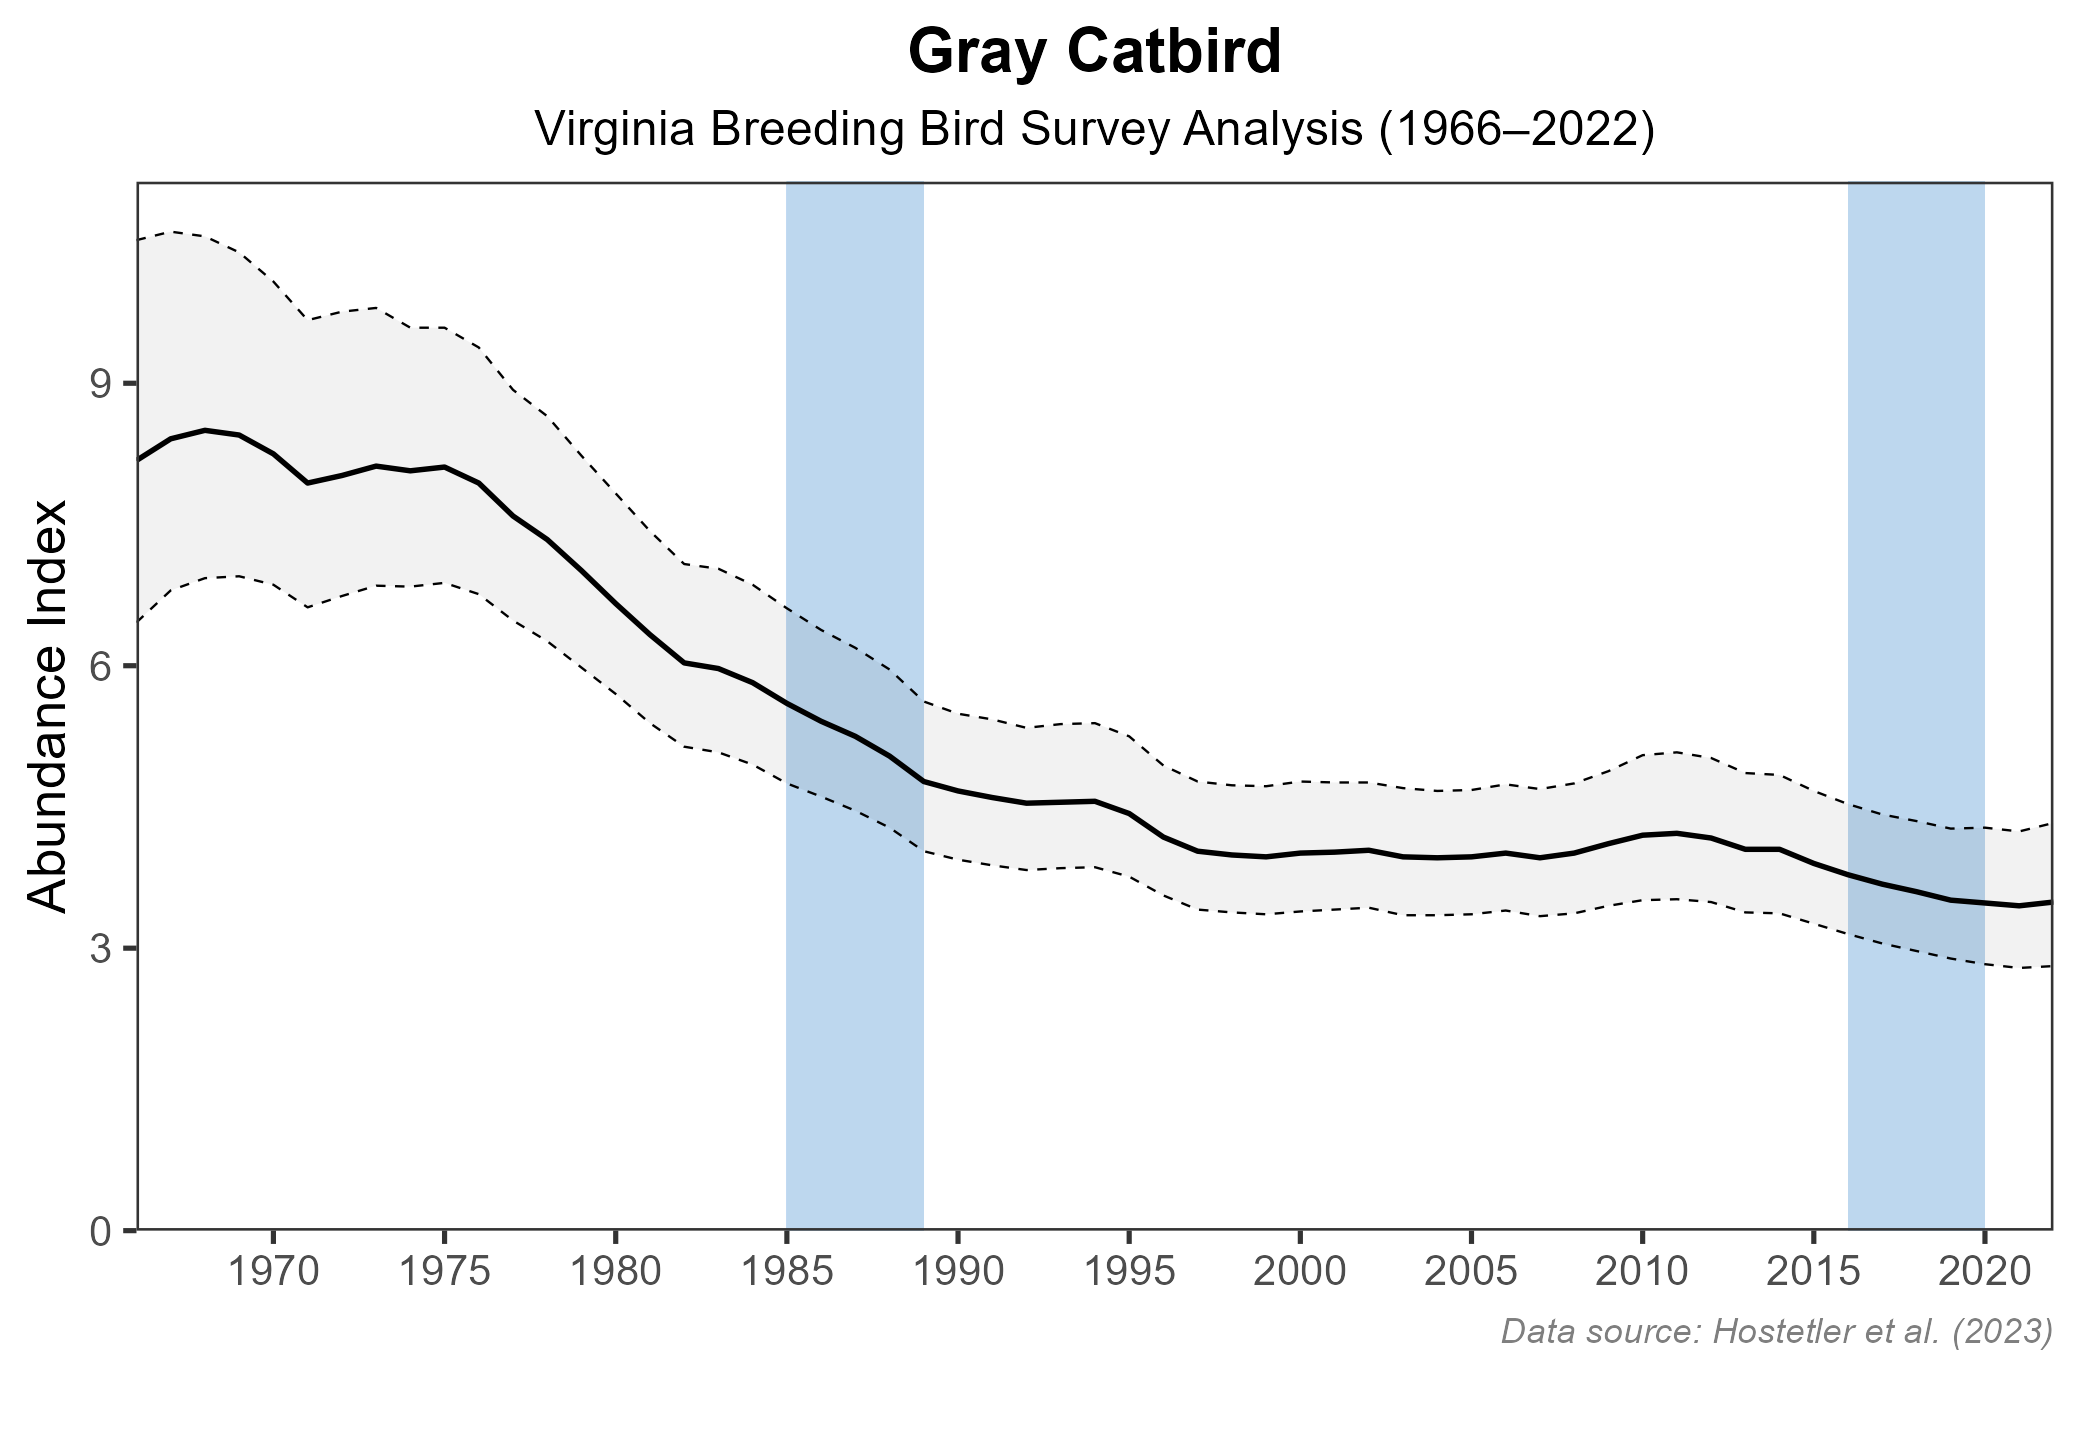
Figure 8: Gray Catbird population trend for Virginia as estimated by the North American Breeding Bird Survey. The vertical axis shows species abundance; the horizontal axis shows the year. The solid line indicates the estimated population trend; there is a 97.5% probability that the true population trend falls between the dashed lines. The shaded bars indicate the First and Second Atlas periods.
Conservation
Due to their decline in the state, Gray Catbirds are listed as Tier IV Species of Greatest Conservation Need in the Virginia 2025 Wildlife Action Plan (Moderate Conservation Need) (VDWR 2025). Actions taken to enhance or create edge habitat in suburban and urban areas such as planting shrubs around homes and buildings or ensuring edge habitat along utility rights-of-way will help provide habitat for the species (Smith et al. 2020).
Interactive Map
The interactive map contains up to six Atlas layers (probability of occurrence for the First and Second Atlases, change in probability of occurrence between Atlases, breeding evidence for the First and Second Atlases, and abundance for the Second Atlas) that can be viewed one at a time. To view an Atlas map layer, mouse over the layer box in the upper left. County lines and physiographic regional boundaries (Mountains and Valleys, Piedmont, and Coastal Plain) can be turned on and off by checking or unchecking the box below the layer box. Within the map window, users can hover on a block to see its value for each layer and pan and zoom to see roads, towns, and other features of interest that are visible beneath a selected layer.
View Interactive Map in Full Screen
References
Smith, R. J., M. I. Hatch, D. A. Cimprich, and F. R. Moore (2020). Gray Catbird (Dumetella carolinensis), version 1.0. In Birds of the World (A. F. Poole, Editor). Cornell Lab of Ornithology, Ithaca, NY, USA. https://doi.org/10.2173/bow.grycat.01.
Hostetler, J. A., J. R. Sauer, J. E. Hines, D. Ziolkowski, and M. Lutmerding (2023). The North American breeding bird survey, analysis results 1966–2022. U.S. Geological Survey, Laurel, MD, USA. https://doi.org/10.5066/P9SC7T11.
Virginia Department of Wildlife Resources (VDWR) (2025). Virginia wildlife action plan. Virginia Department of Wildlife Resources, Henrico, VA, USA. 506 pp.