Introduction
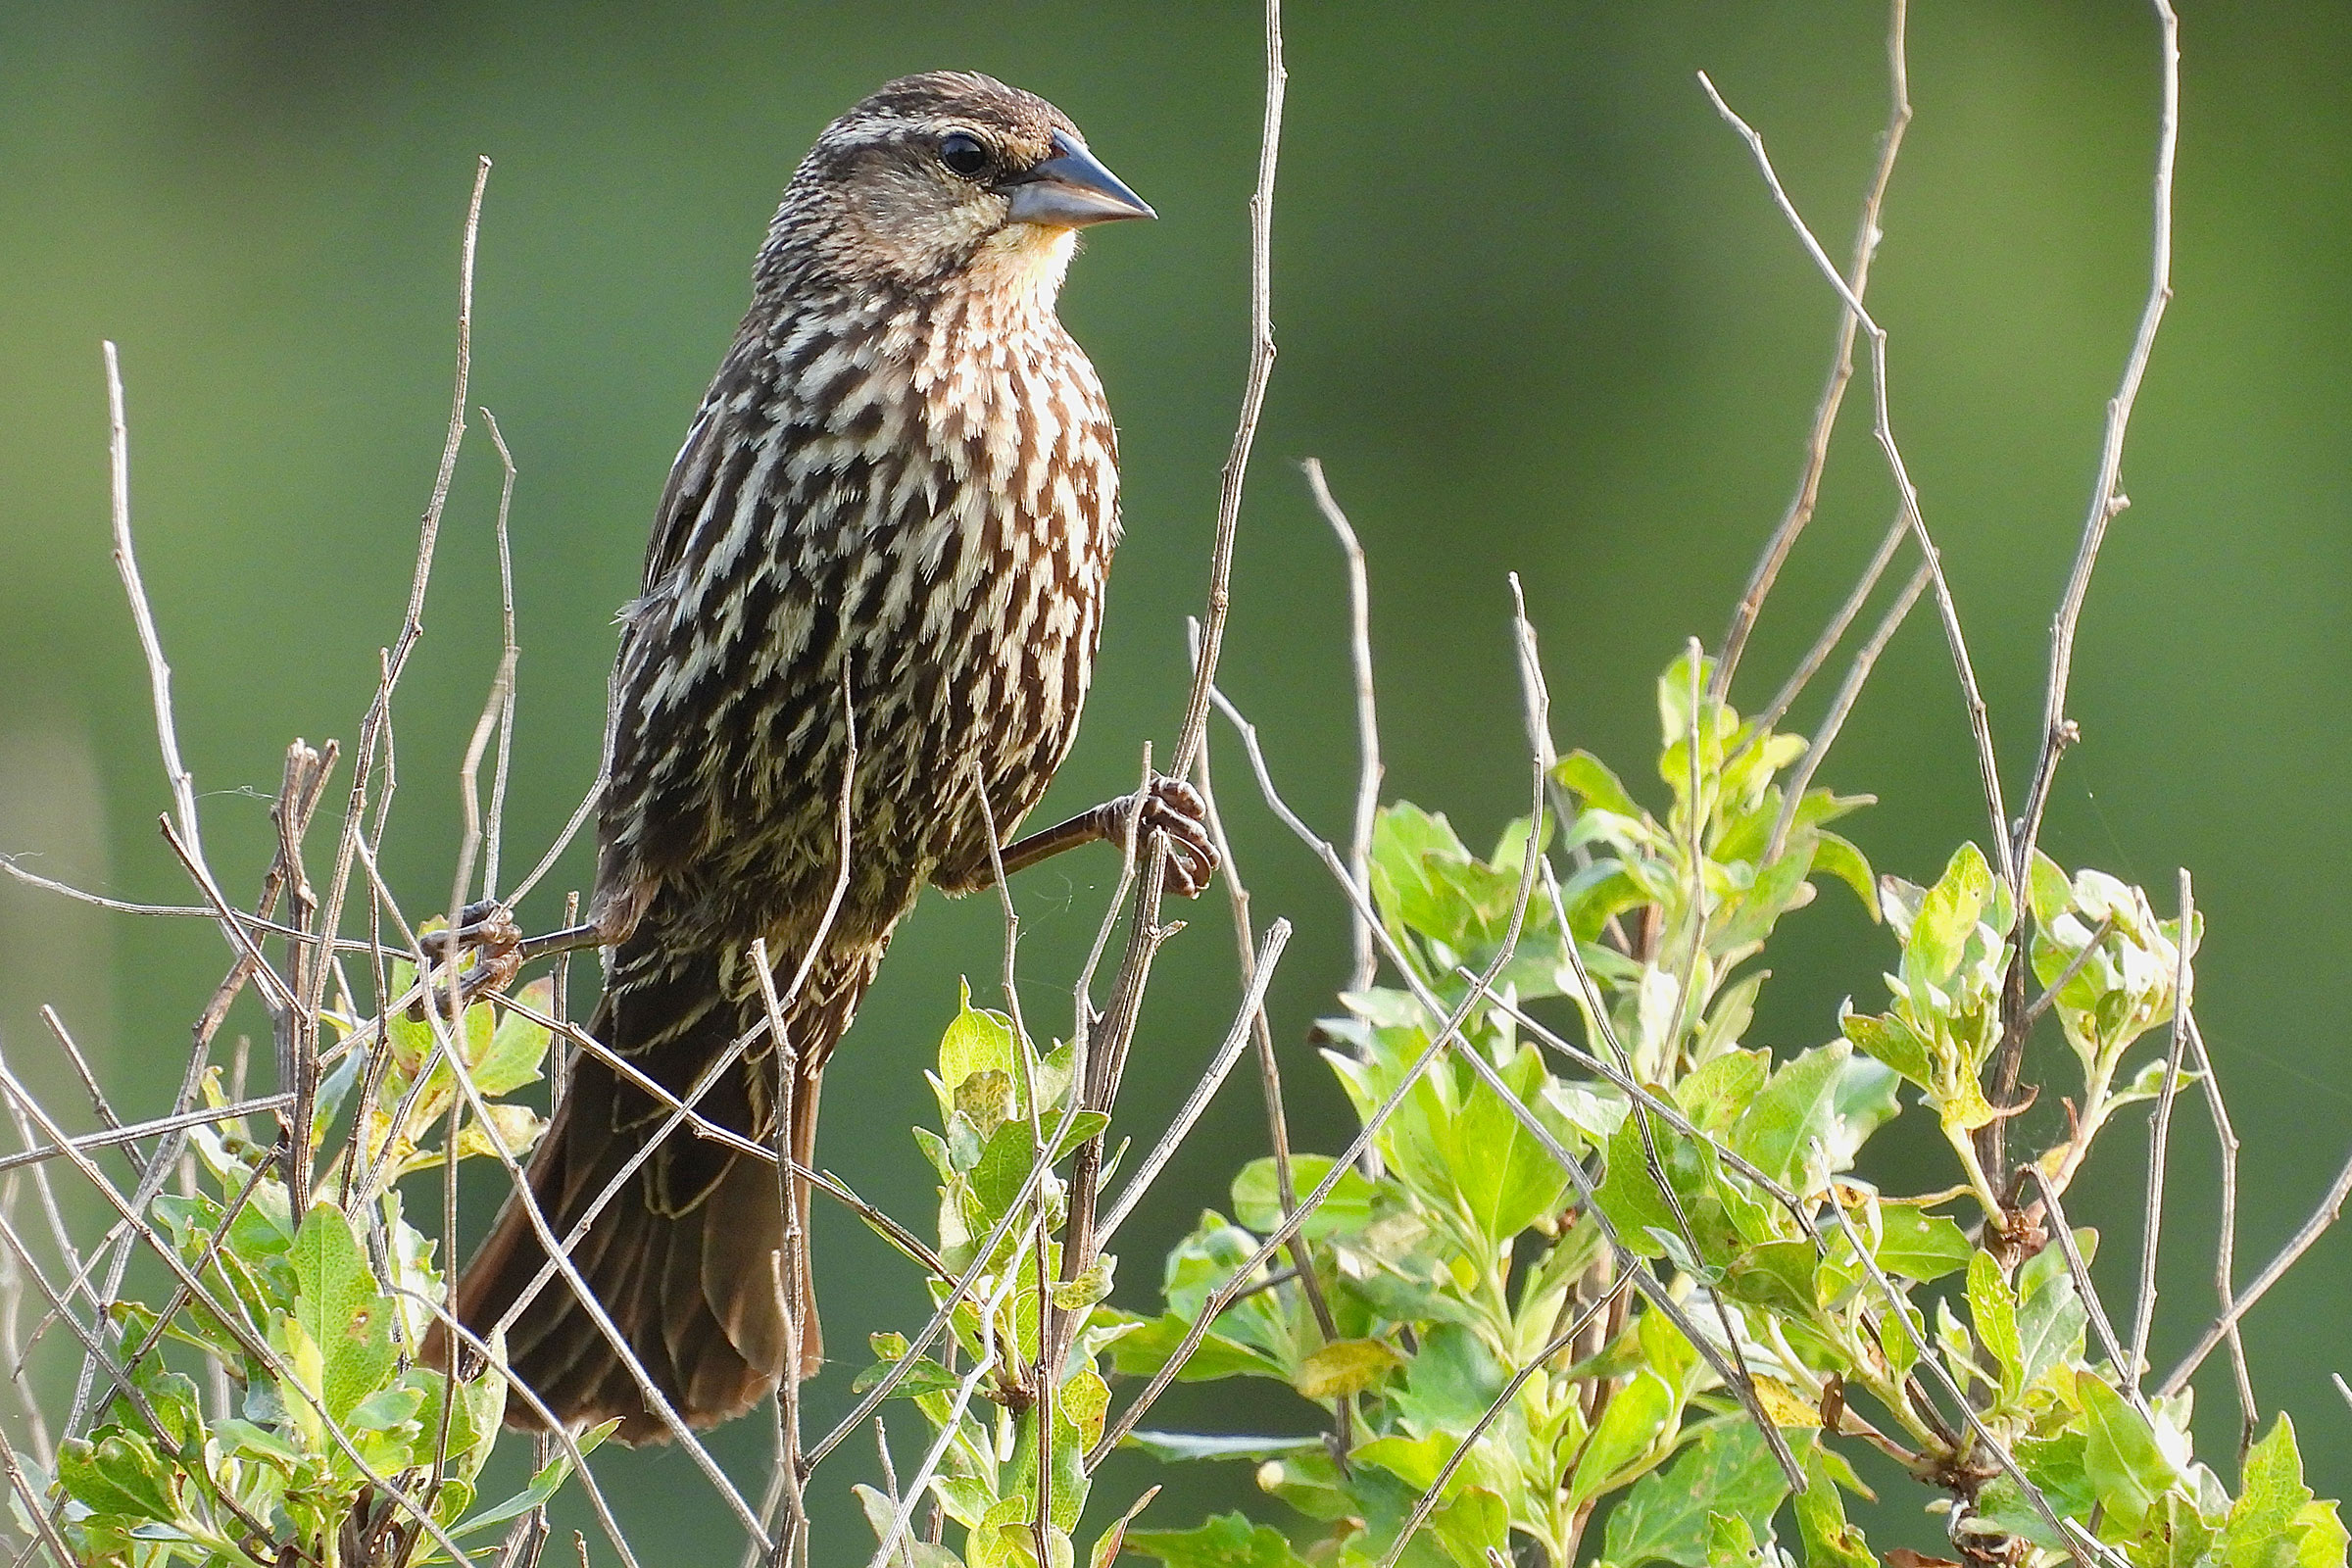
While sometimes underappreciated as a species, a large flock of Red-winged Blackbirds wheeling over a marsh on an early spring morning offers a remarkable visual and auditory display. As the flock twists and turns, the eye is met with alternating flashes of red and black, seemingly choreographed just to please us. Once the flock settles, the loud conk-la-ree of males, each vying for a territory, is a sure sign that winter in Virginia is ending. While males, with their black bodies and red-and-yellow epaulets, are a vivid display of contrast, the female’s dull brown, streaked plumage is testament to the need for camouflage. They are one of the state’s most abundant birds, breeding in freshwater and saltwater wetlands, on the edges of farm fields, and pretty much anywhere that offers semi-open, shrubby habitat (Yasukawa and Searcy 2020).
Breeding Distribution
Red-winged Blackbirds are found in all regions of the state, but they are most likely to be in agricultural areas of the Mountains and Valleys and northern Piedmont regions and in salt marshes of the Coastal Plain region, especially in the southeastern corner (Figure 1). They are also highly likely to occur on the Eastern Shore. Their likelihood of occurring in a block increases as the proportion of agricultural lands increases and decreases as the proportion of shrubland and grassland habitat, amount of forest cover, forest patch size, and number of habitat types increase.
Between the First and Second Atlases (Figures 1 and 2), Red-winged Blackbird’s predicted occurrence remained constant across most of the state (Figure 3). Small areas of potential decrease occurred in the southern Piedmont region and southwestern corner of the Mountains and Valleys region.
View Environmental Associations
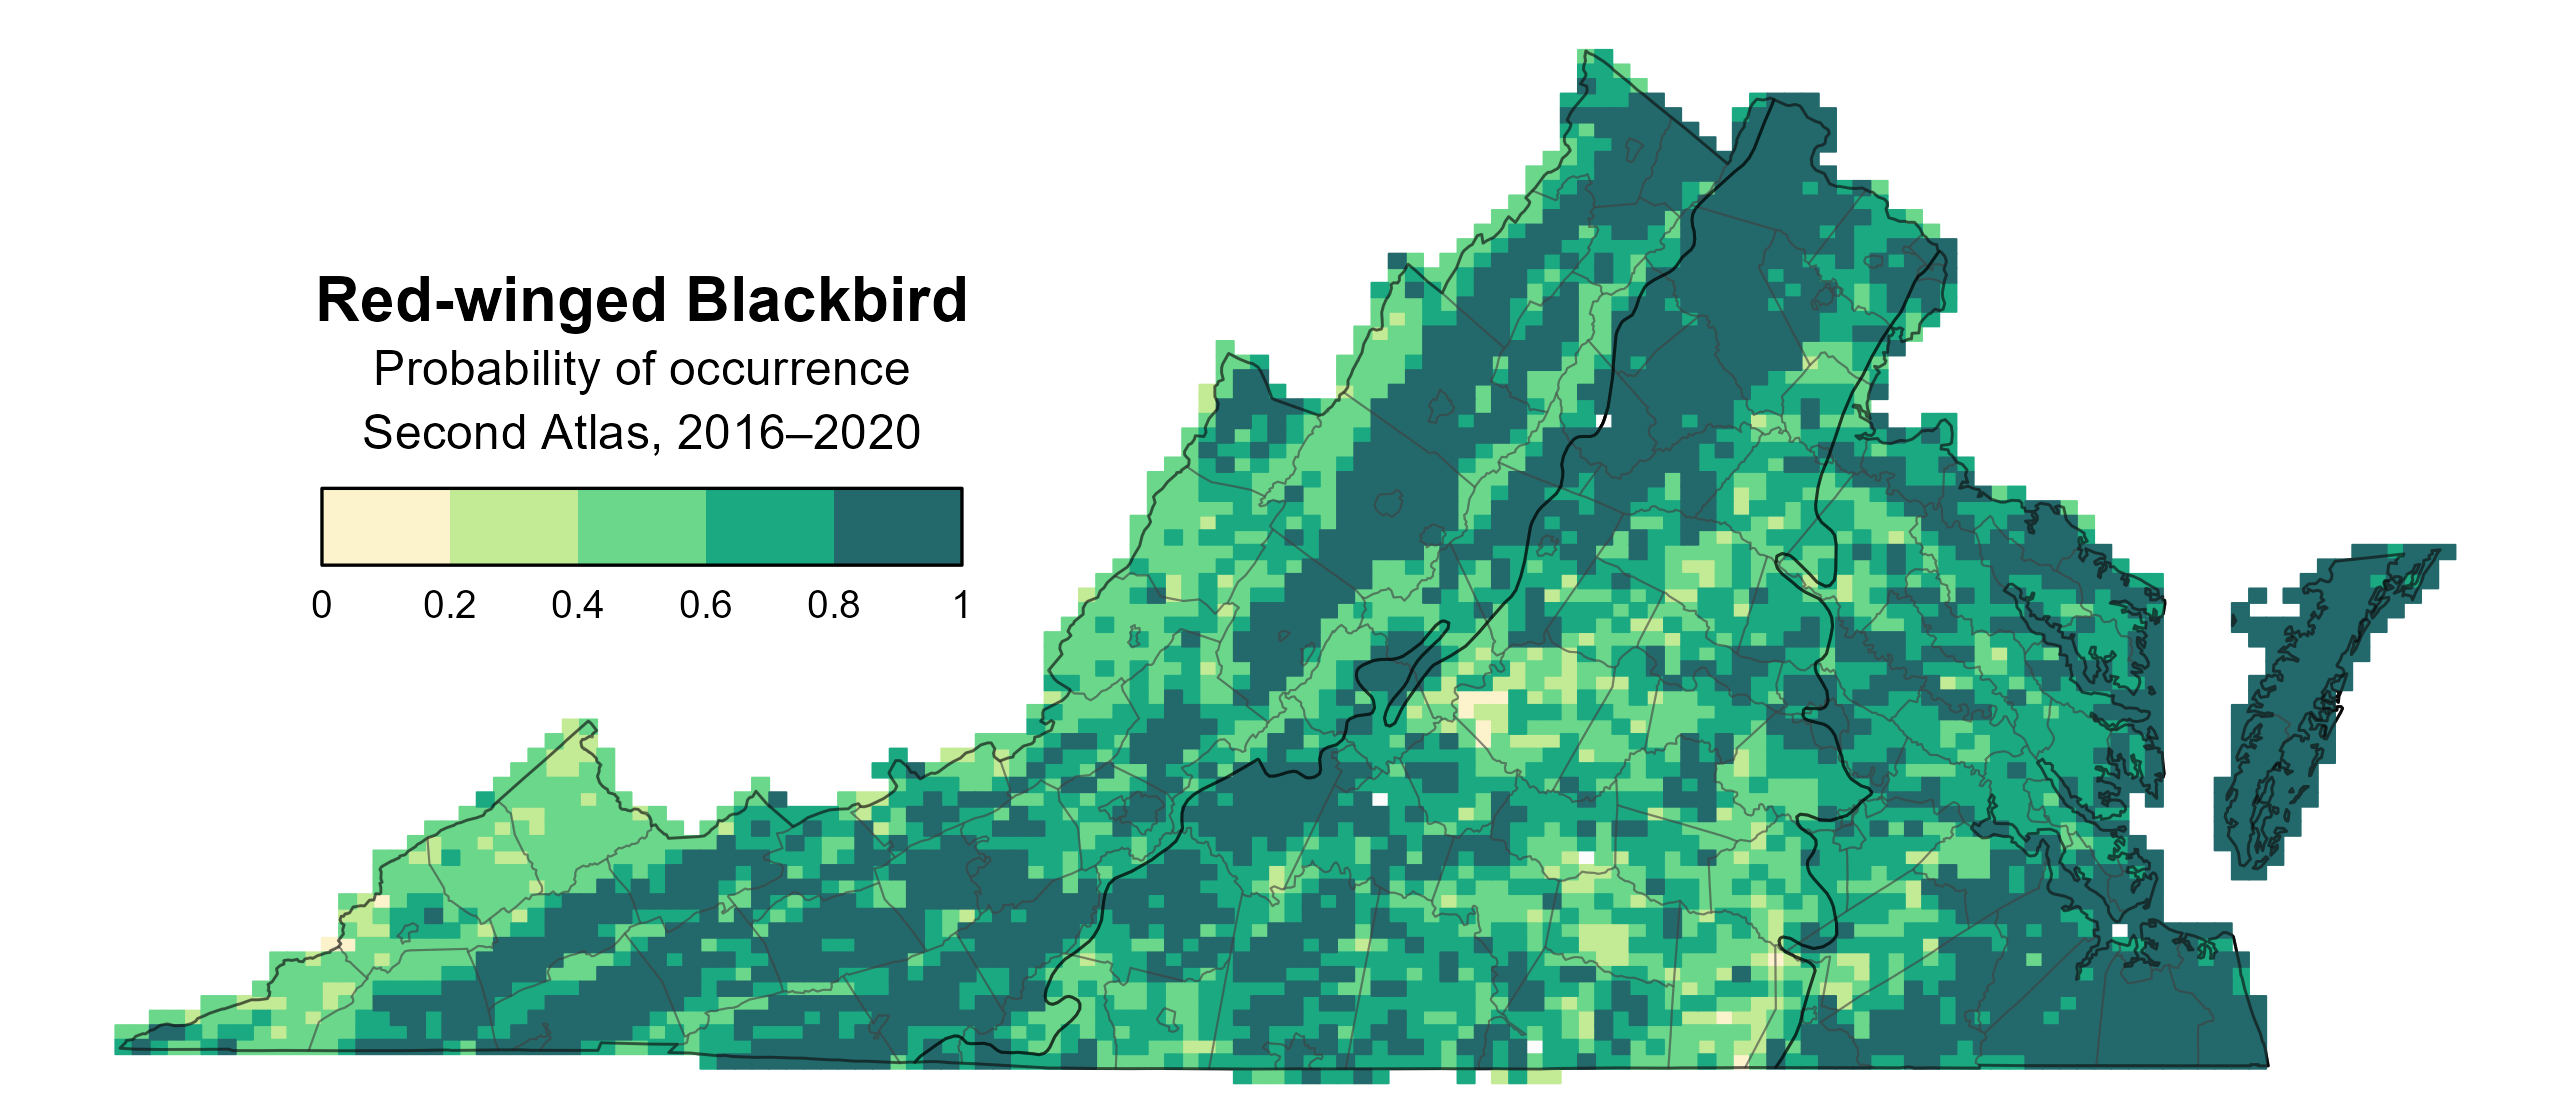
Figure 1: Red-winged Blackbird breeding distribution based on probability of occurrence (Second Atlas, 2016–2020). This map indicates the probability that this species will occur in an Atlas block (an approximately 10 mi2 [26 km2] survey unit) based on environmental (including habitat) factors and after adjusting for the probability of detection (variation in survey effort among blocks).
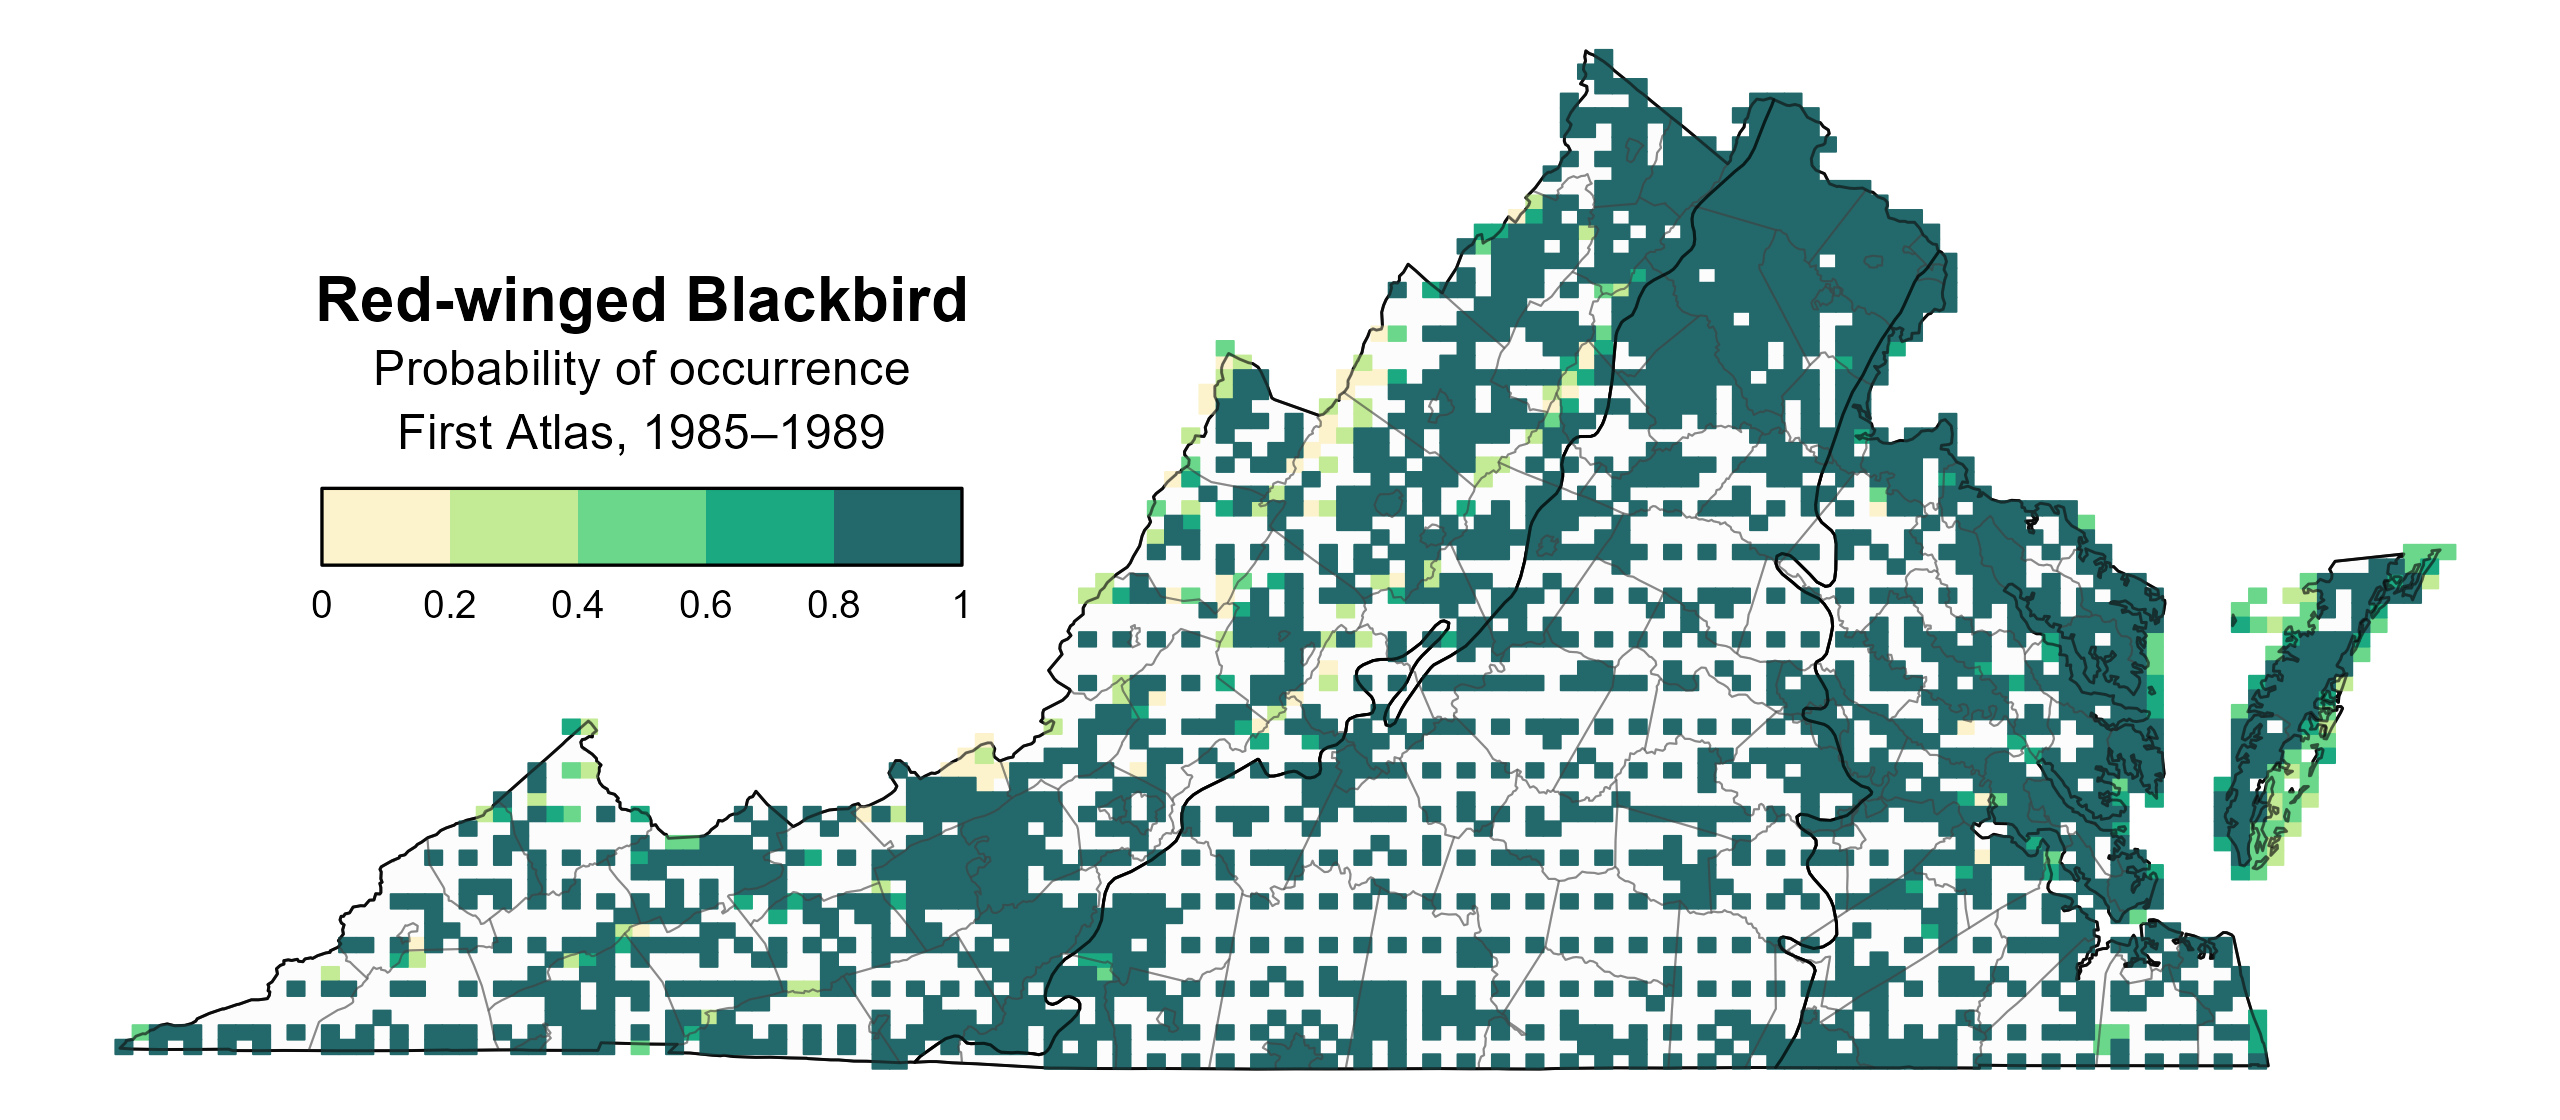
Figure 2: Red-winged Blackbird breeding distribution based on probability of occurrence (First Atlas, 1985–1989). This map indicates the probability that this species will occur in an Atlas block (an approximately 10 mi2 [26 km2] survey unit) based on environmental (including habitat) factors and after adjusting for the probability of detection (variation in survey effort among blocks). Blocks in white were not surveyed during the First Atlas and were not modeled.
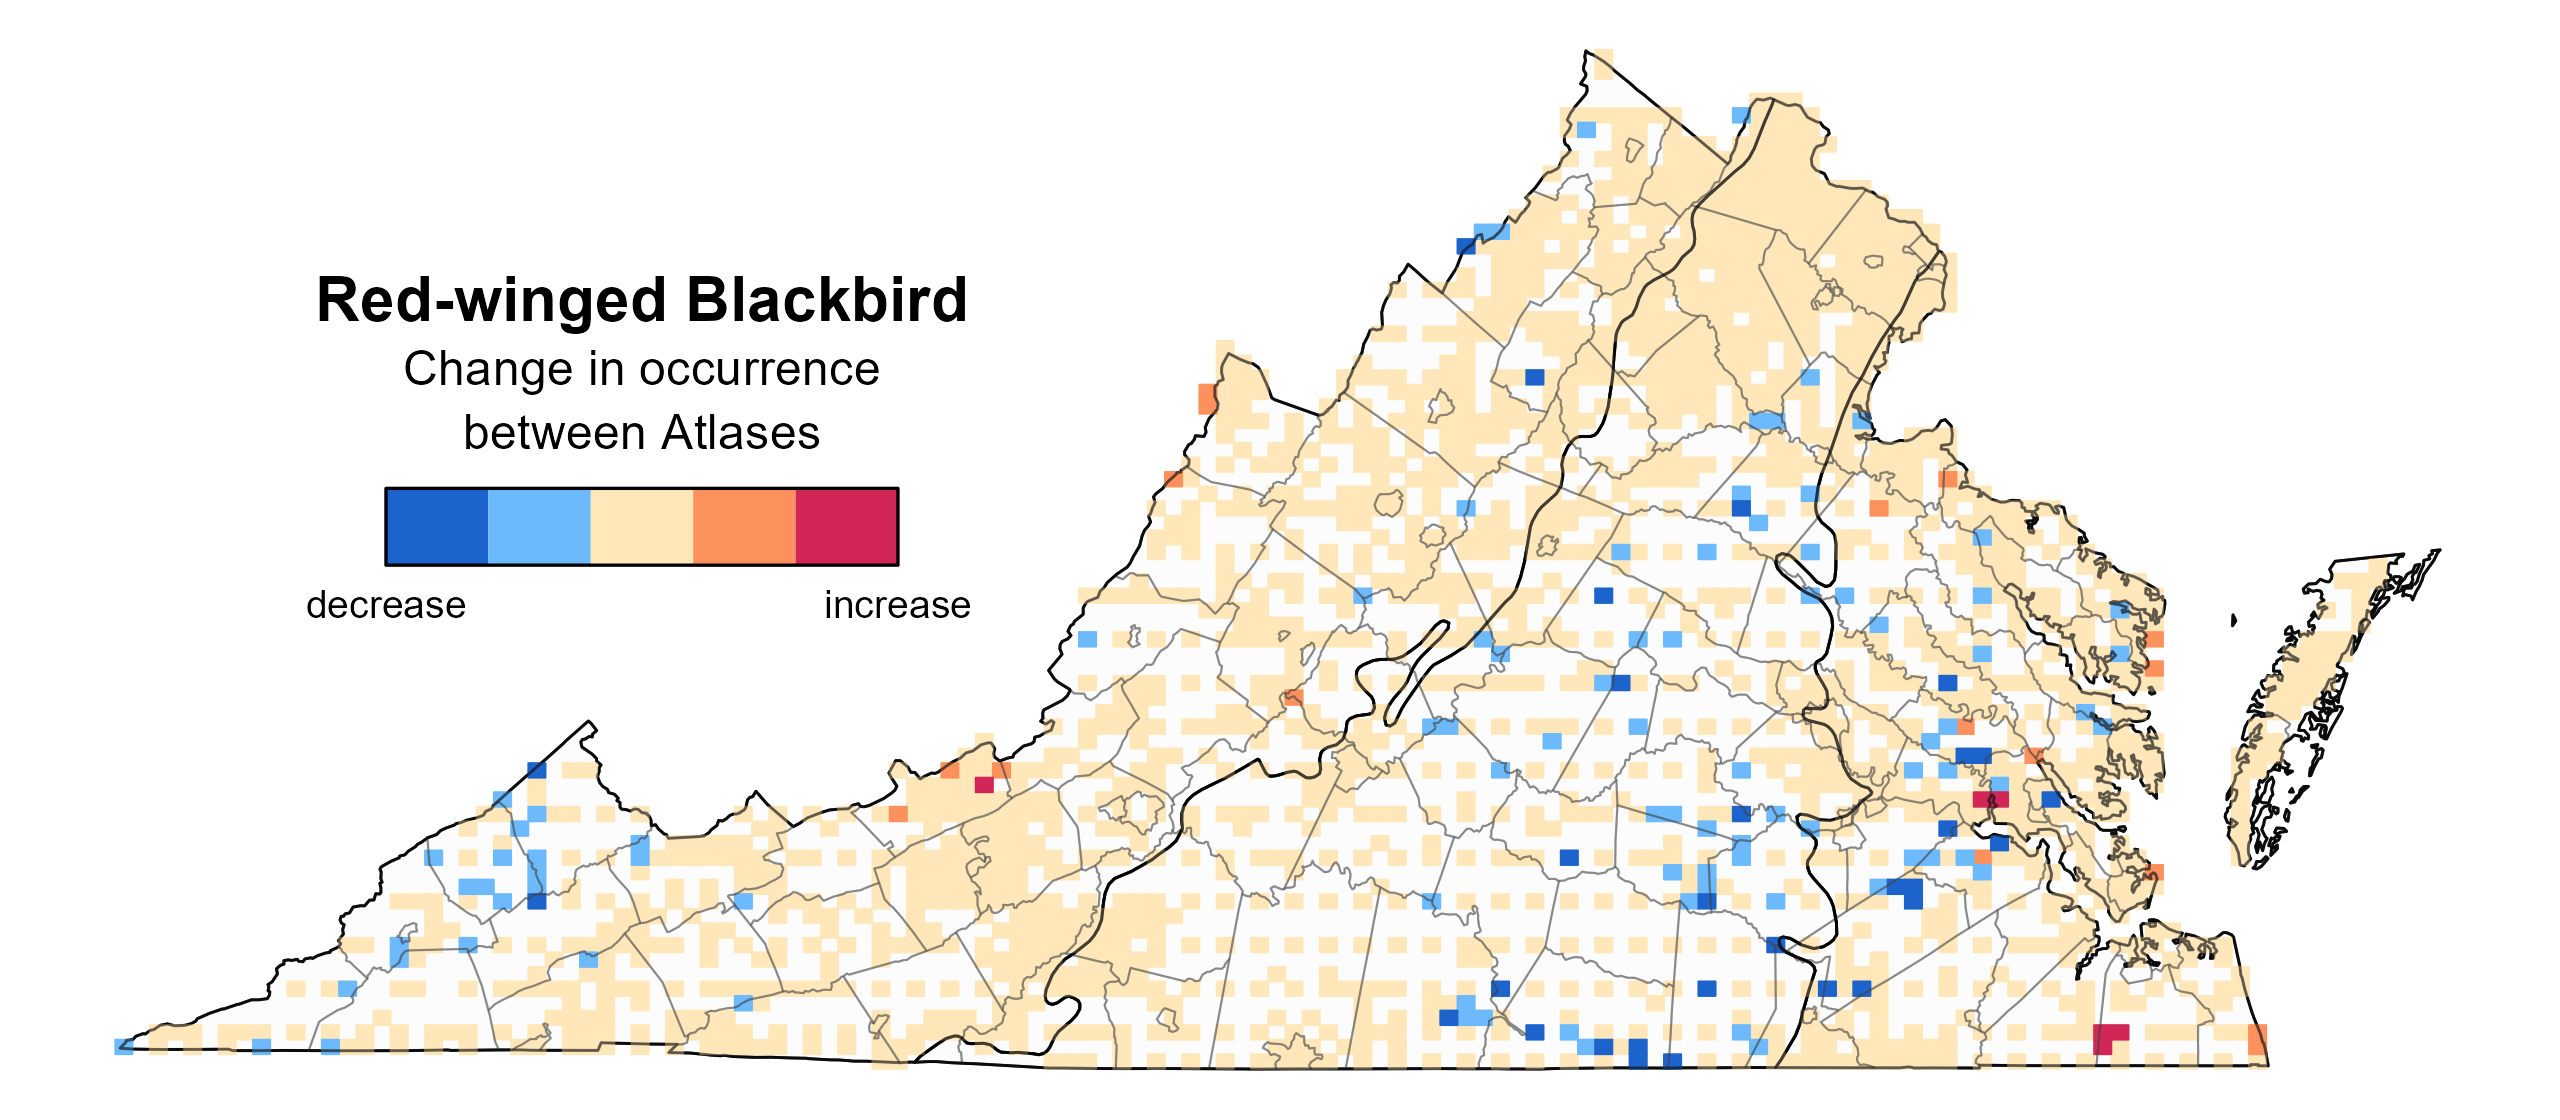
Figure 3: Red-winged Blackbird change in breeding distribution between Atlases (1985–1989 and 2016–2020) based on probability of occurrence. This map indicates the change in the probability that this species will occur in a block (an approximately 10 mi2 [26 km2] survey unit) between Atlas periods. Blocks with no change (tan) may have constant presence or constant absence. Blocks in white were not surveyed during the First Atlas and were not modeled.
Breeding Evidence
Red-winged Blackbirds were confirmed breeders in 662 blocks and 106 counties and probable breeders in 15 additional counties (Figure 4). They also were confirmed breeders across the state during the First Atlas (Figure 5).
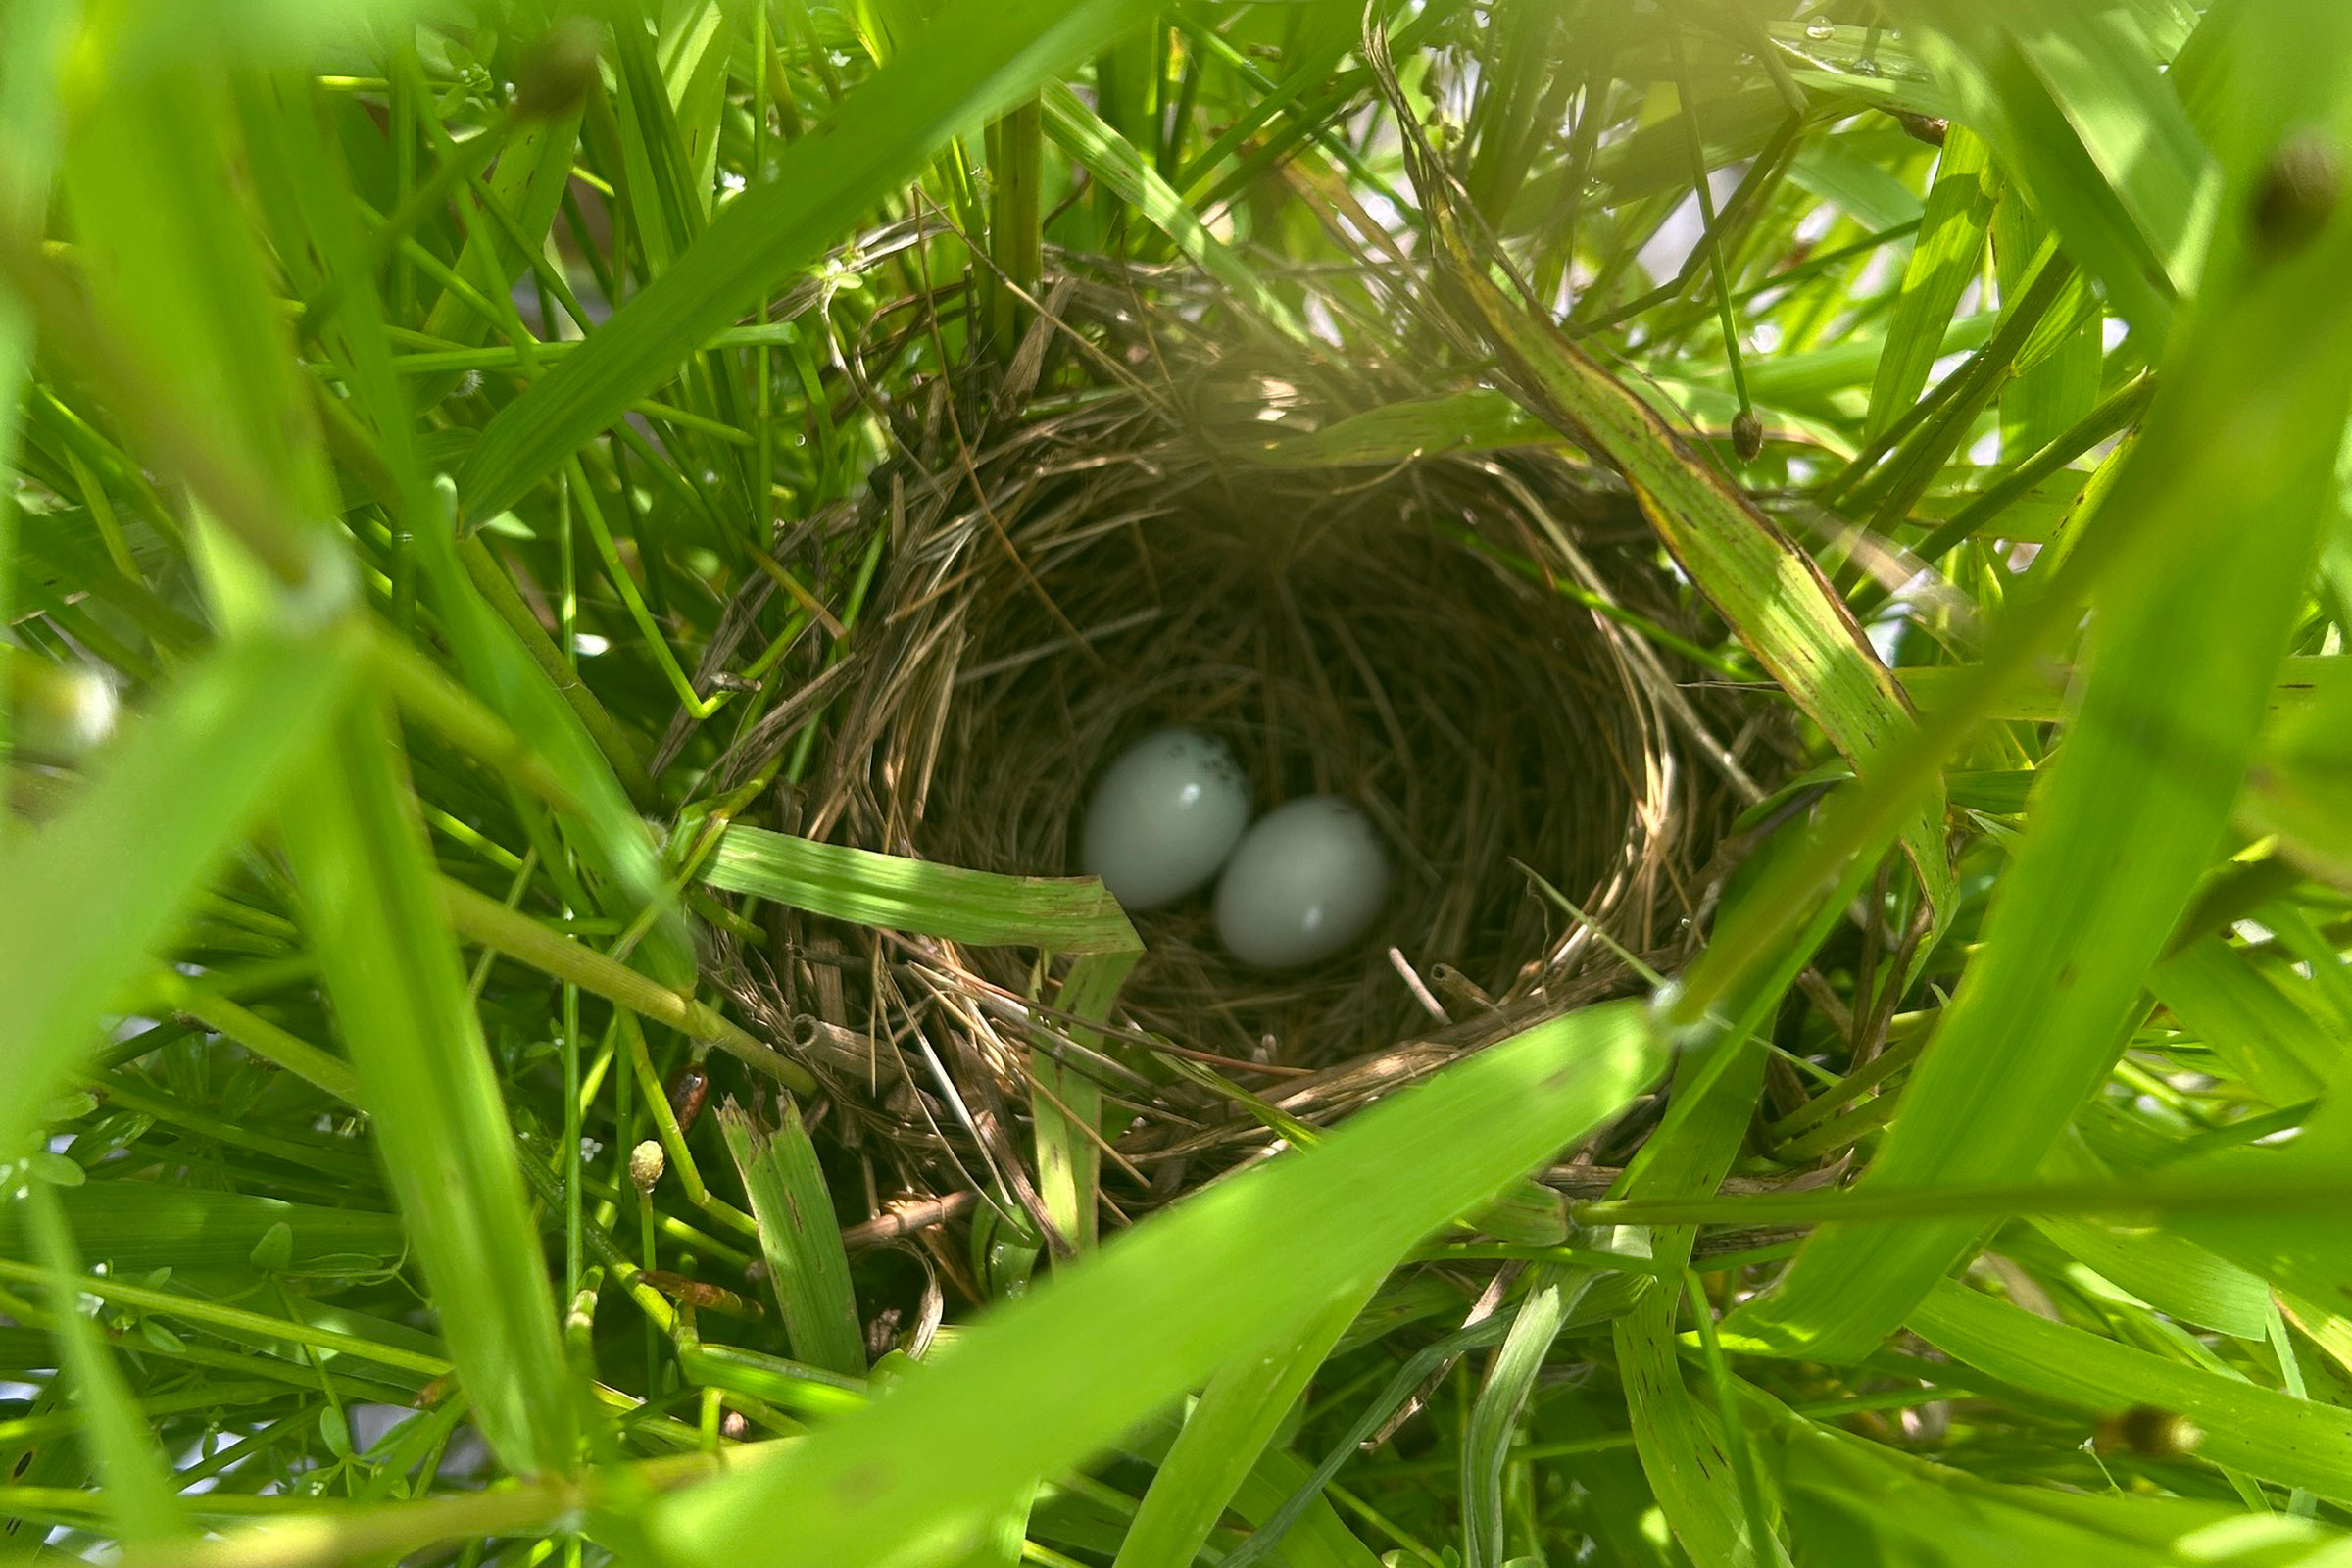
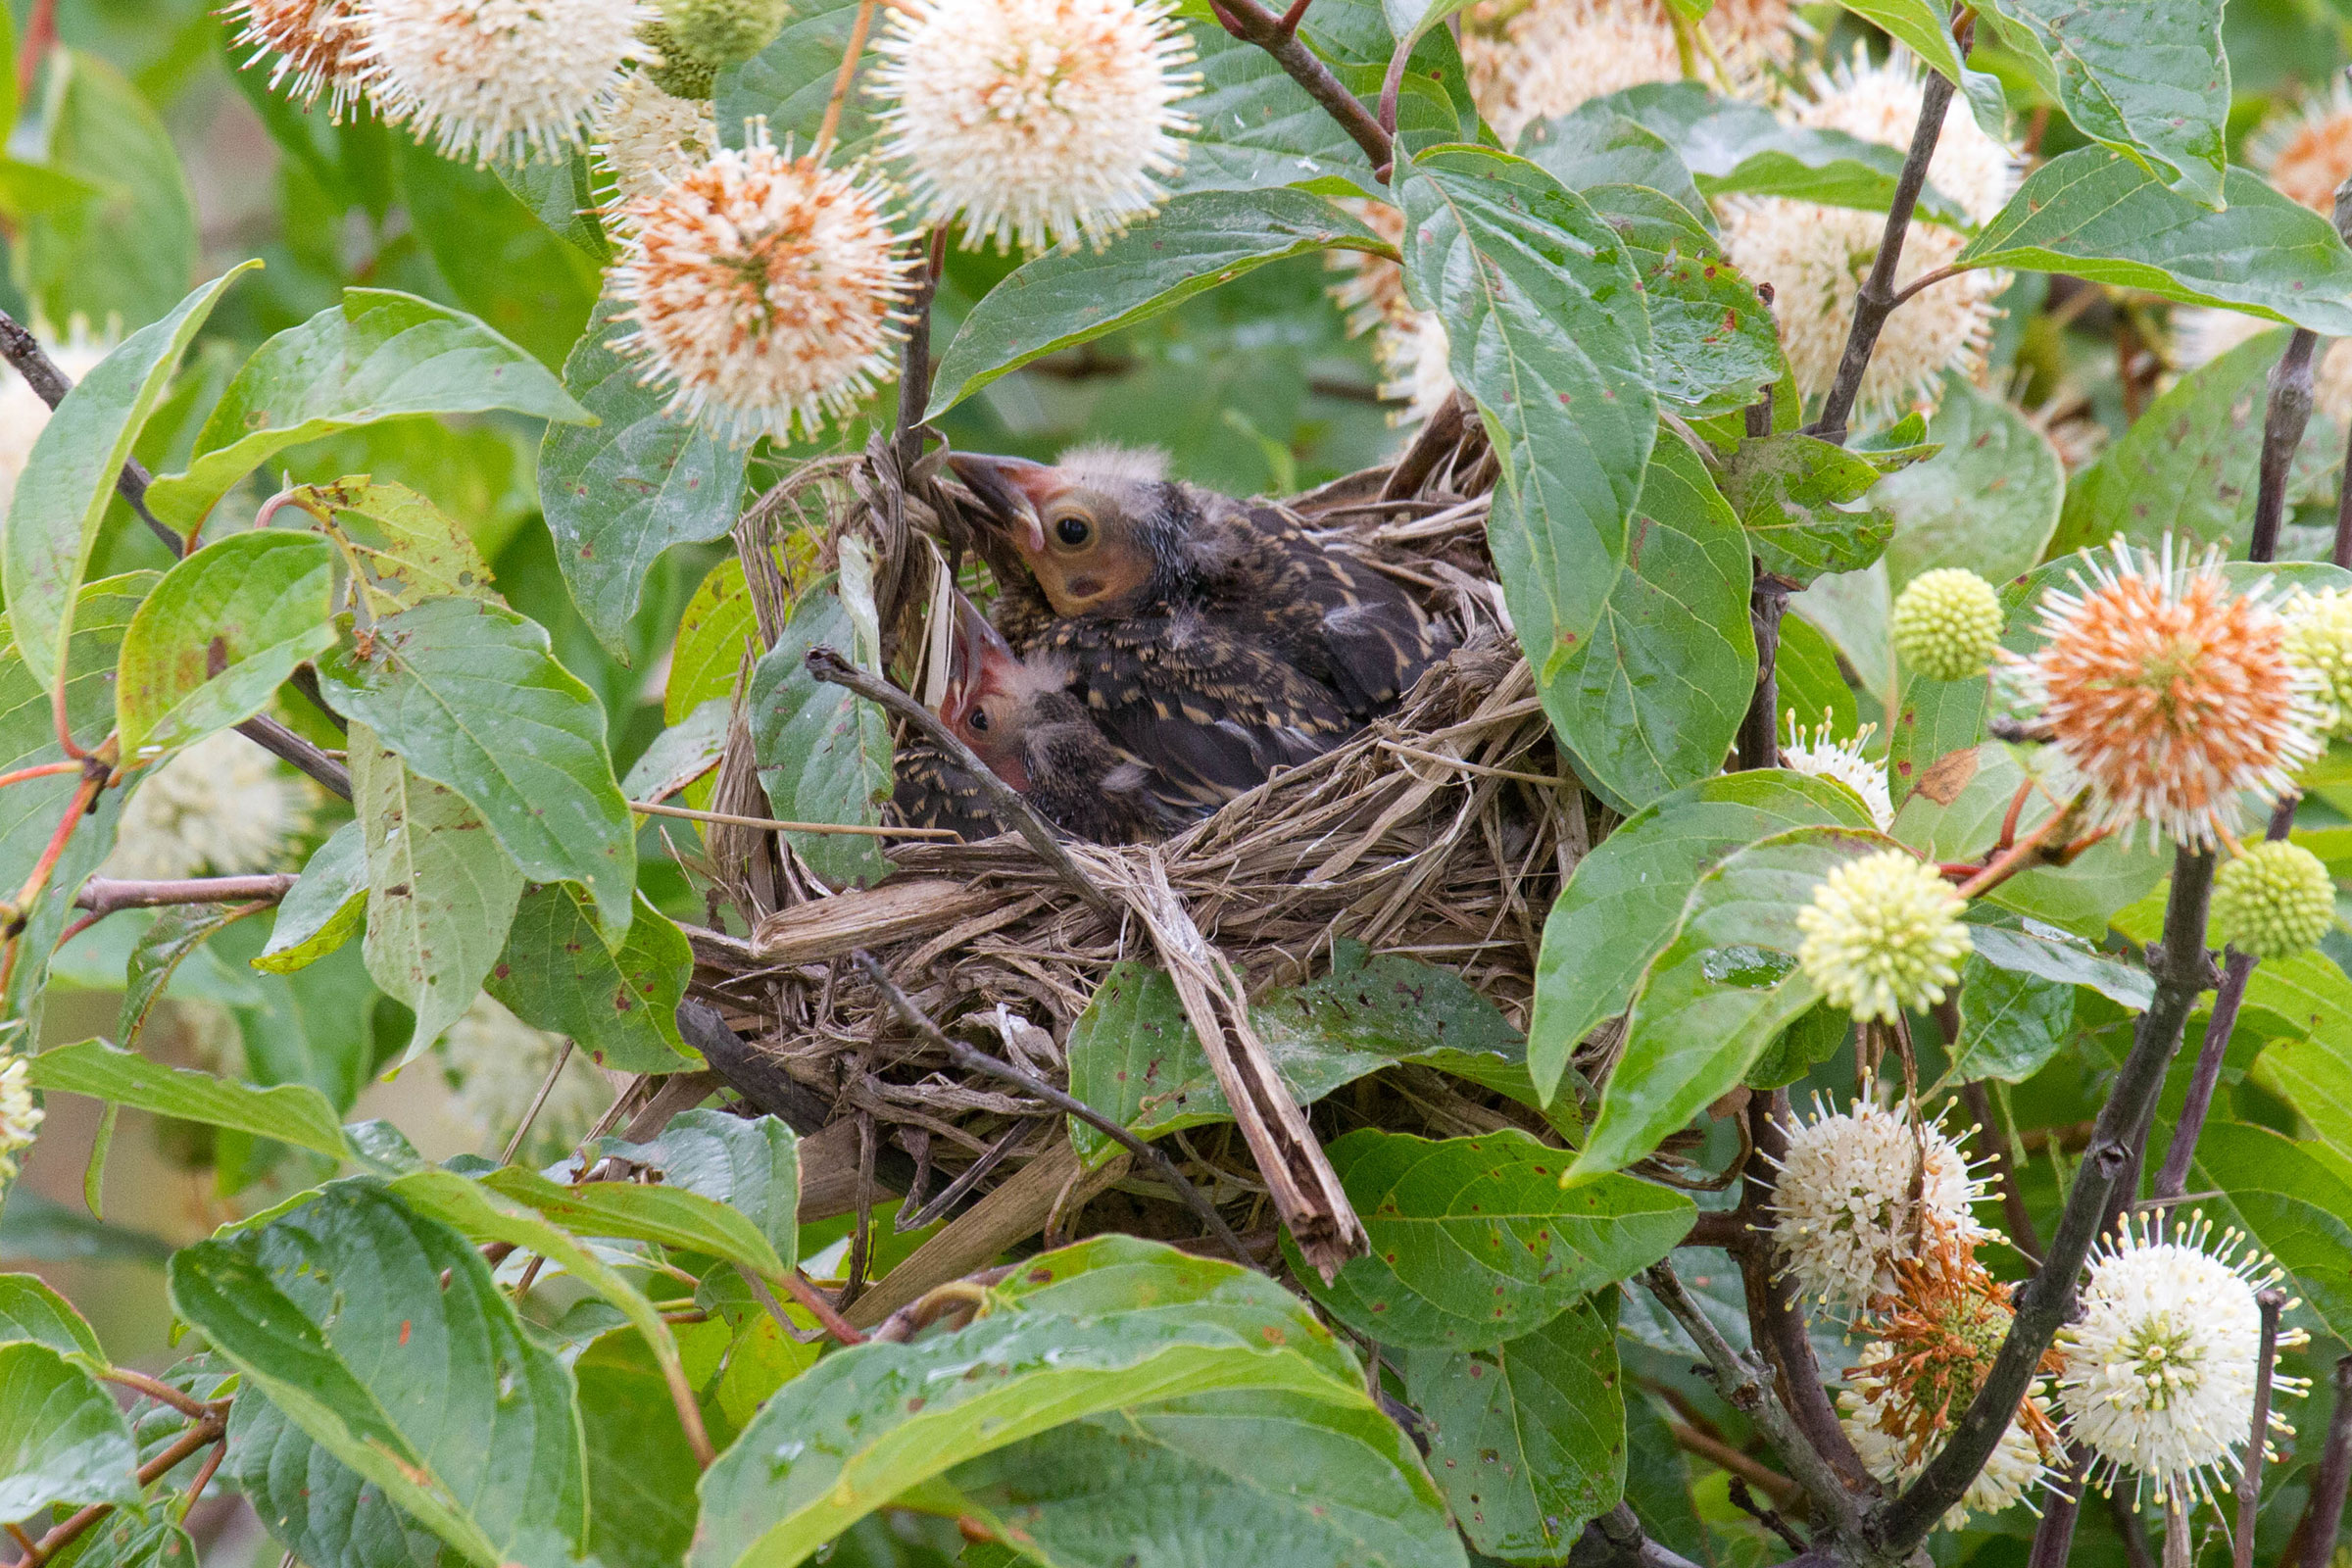
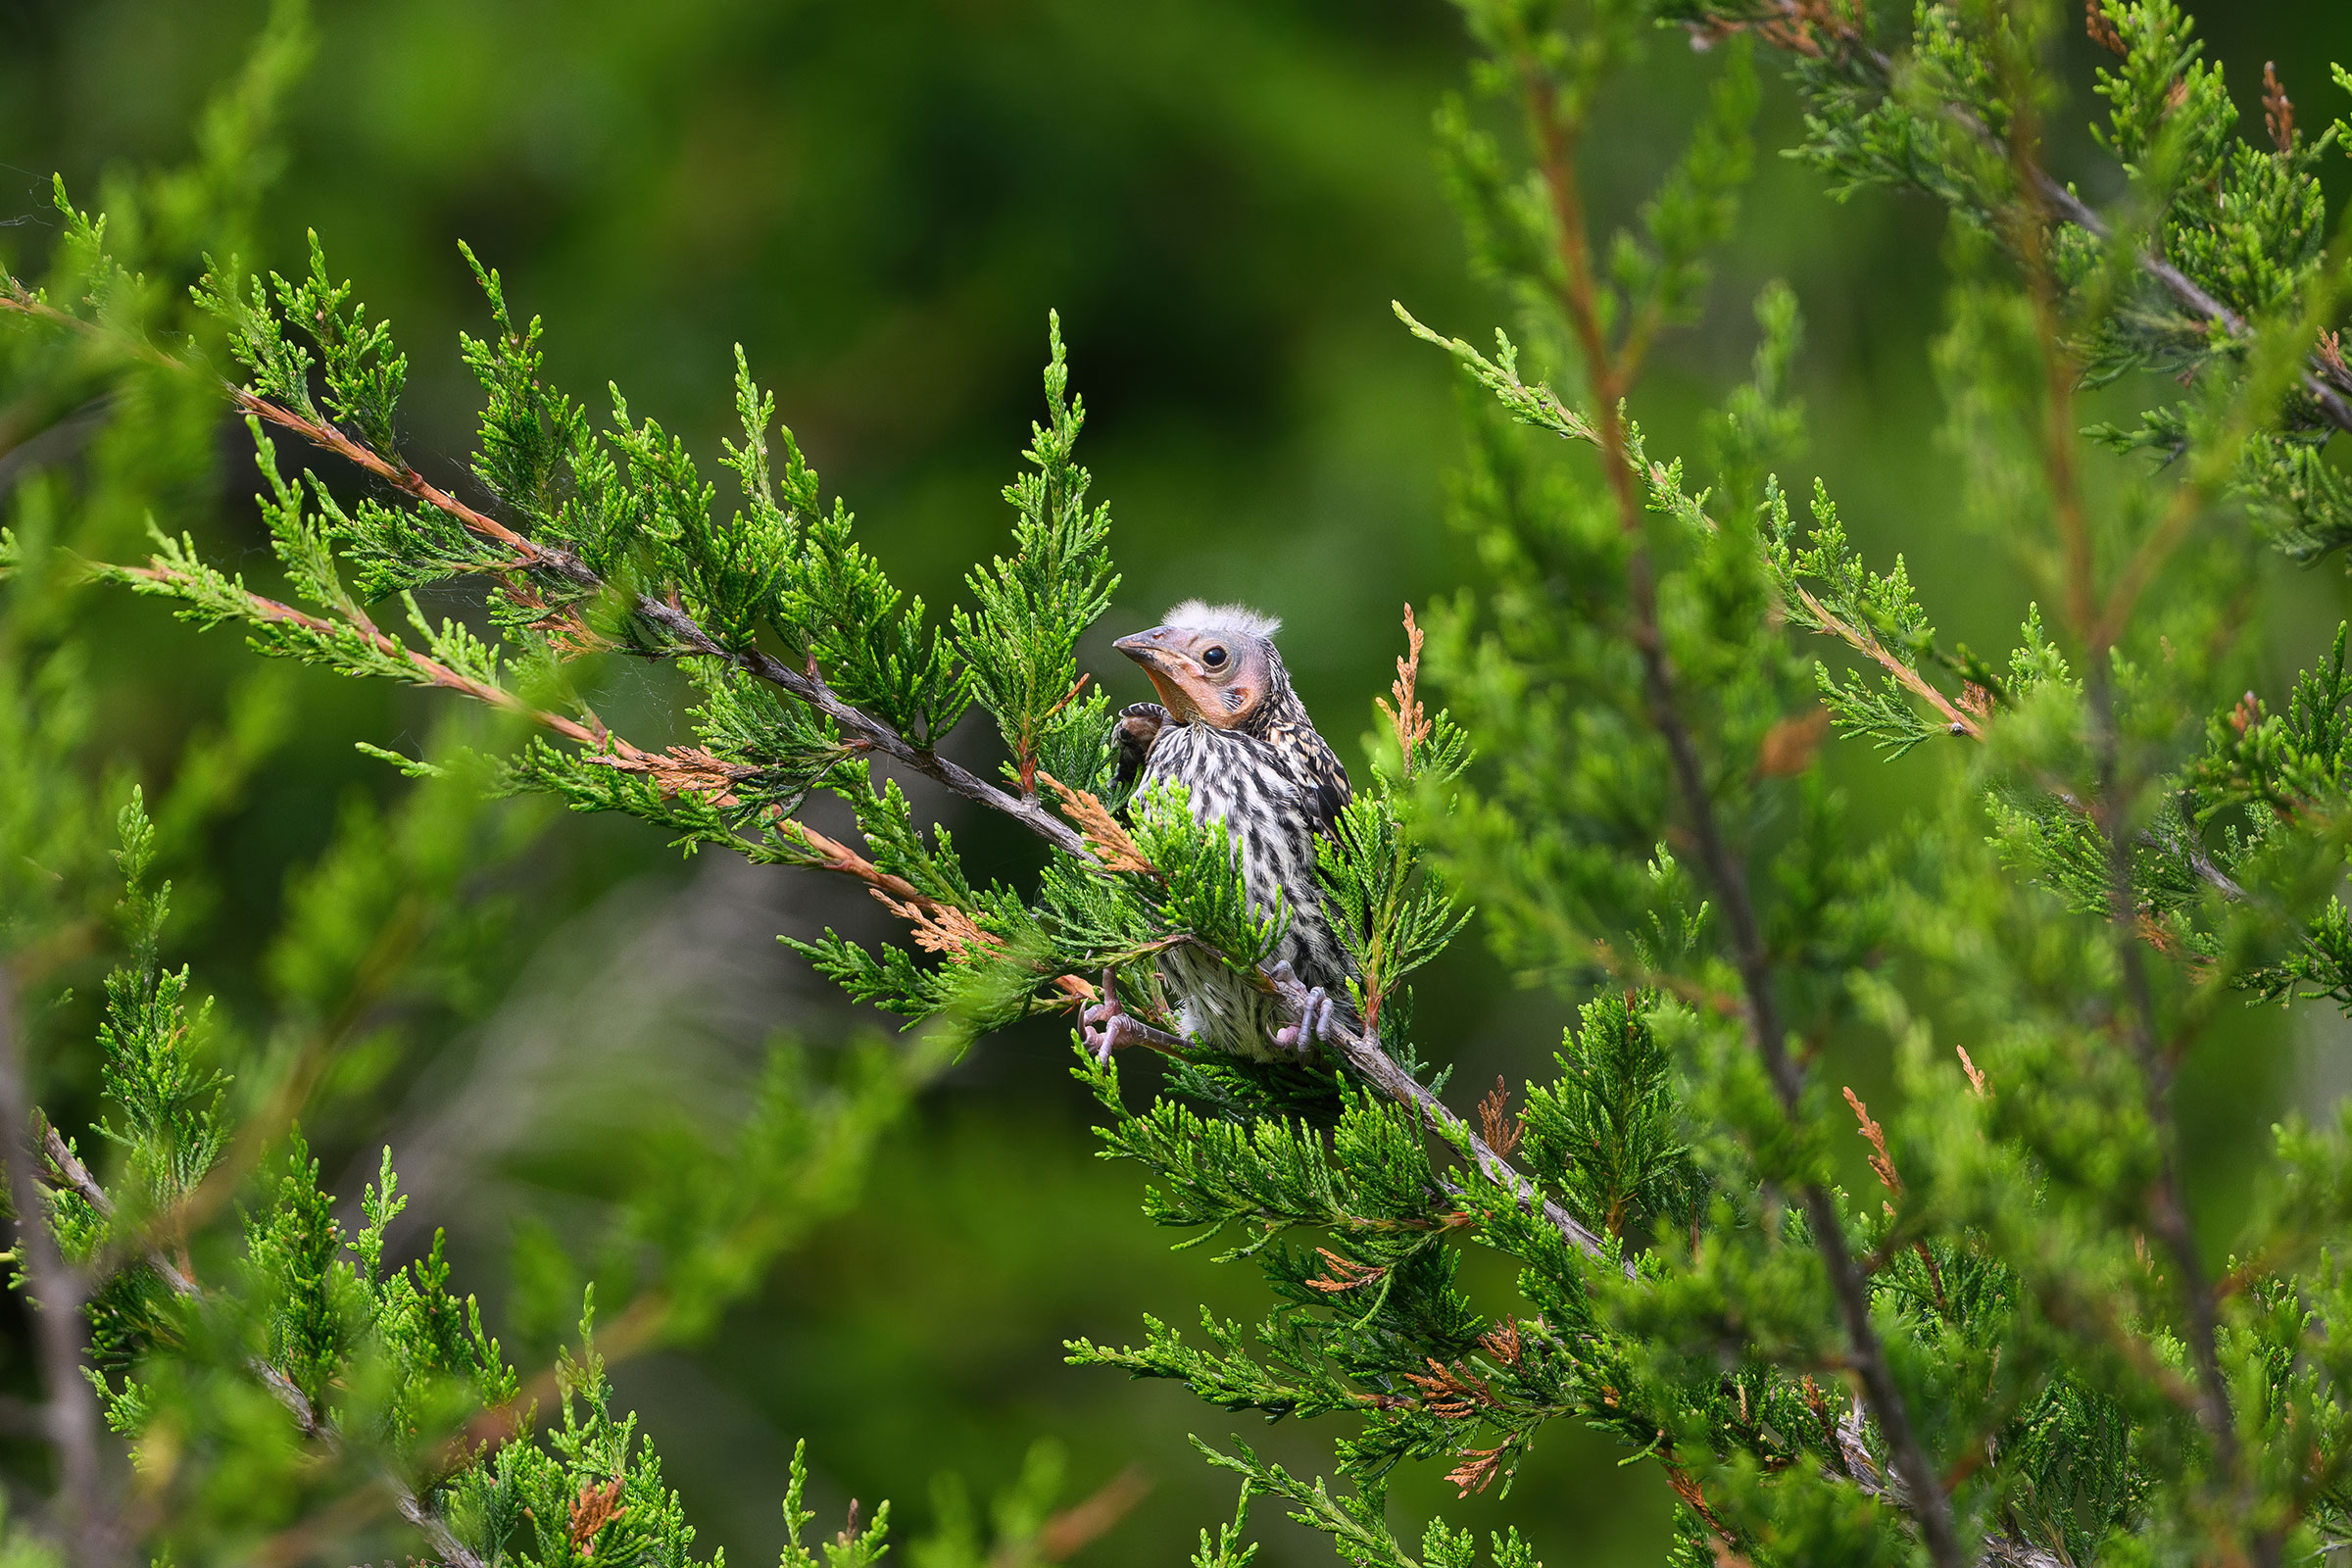
The earliest confirmed breeding behavior was recorded on March 18 when adults were documented carrying nesting material (Figure 6). The main breeding behaviors recorded were observations of nests with eggs (April 26 – July 8), occupied nests (April 21 –August 3), recently fledged young (May 13–September 3), and adults feeding young (May 16 – August 13).
For more general information on the breeding habits of this species, please refer to All About Birds.
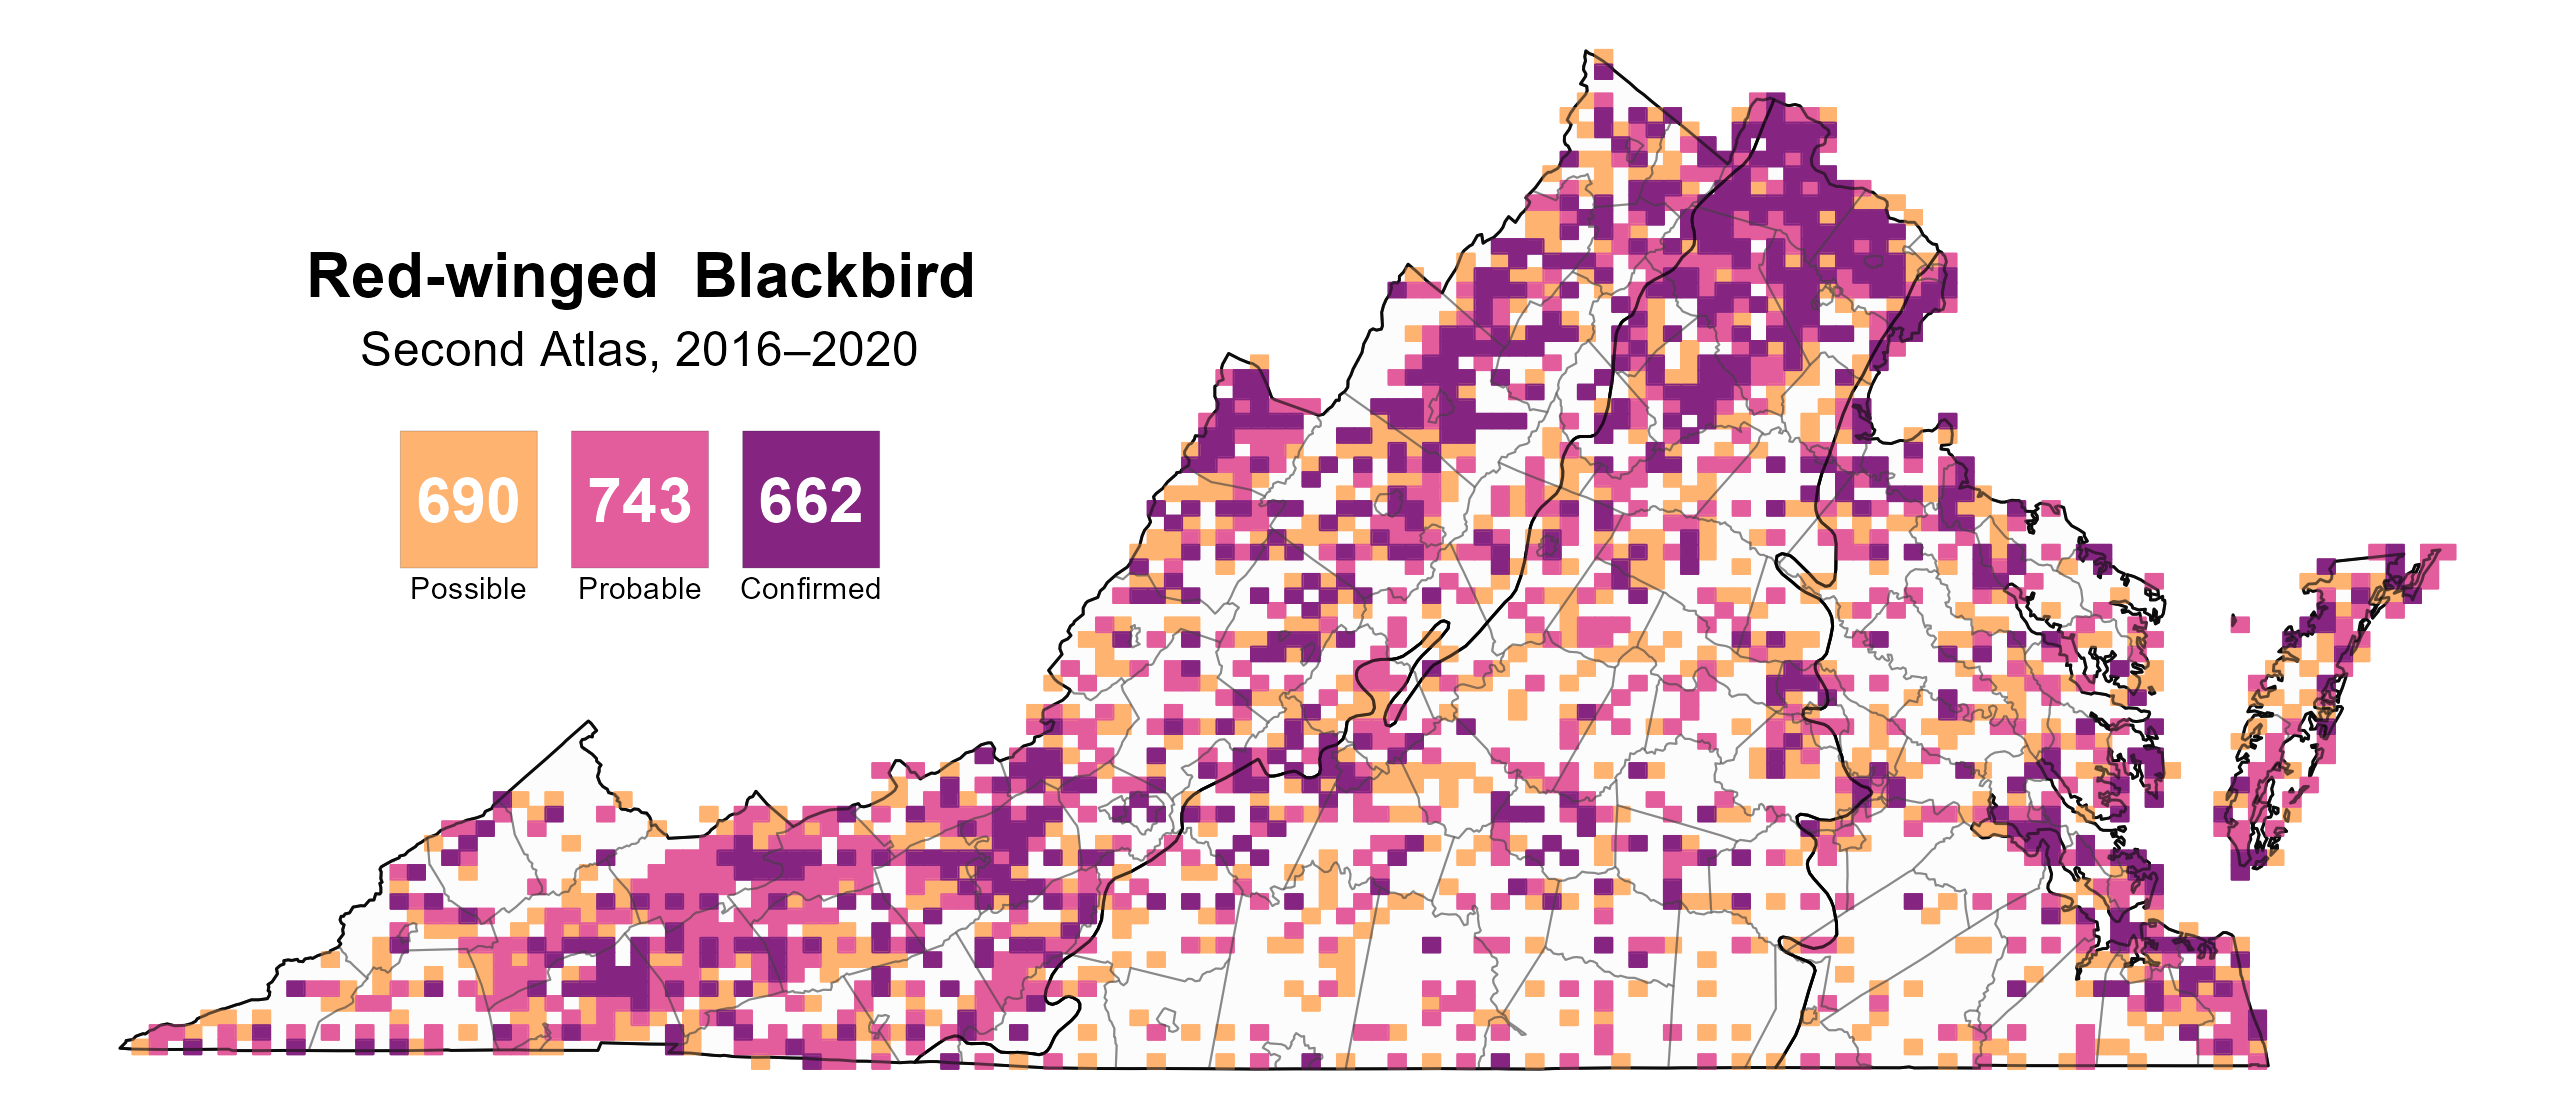
Figure 4: Red-winged Blackbird breeding observations from the Second Atlas (2016–2020). The colored boxes illustrate Atlas blocks (approximately 10 mi2 [26 km2] survey units) where the species was detected. The colors show the highest breeding category recorded in a block. The numbers within the colors in the legend correspond to the number of blocks with that breeding evidence category.

Figure 5: Red-winged Blackbird breeding observations from the First Atlas (1985–1989). The colored boxes illustrate Atlas blocks (approximately 10 mi2 [26 km2] survey units) where the species was detected. The colors show the highest breeding category recorded in a block. The numbers within the colors in the legend correspond to the number of blocks with that breeding evidence category.
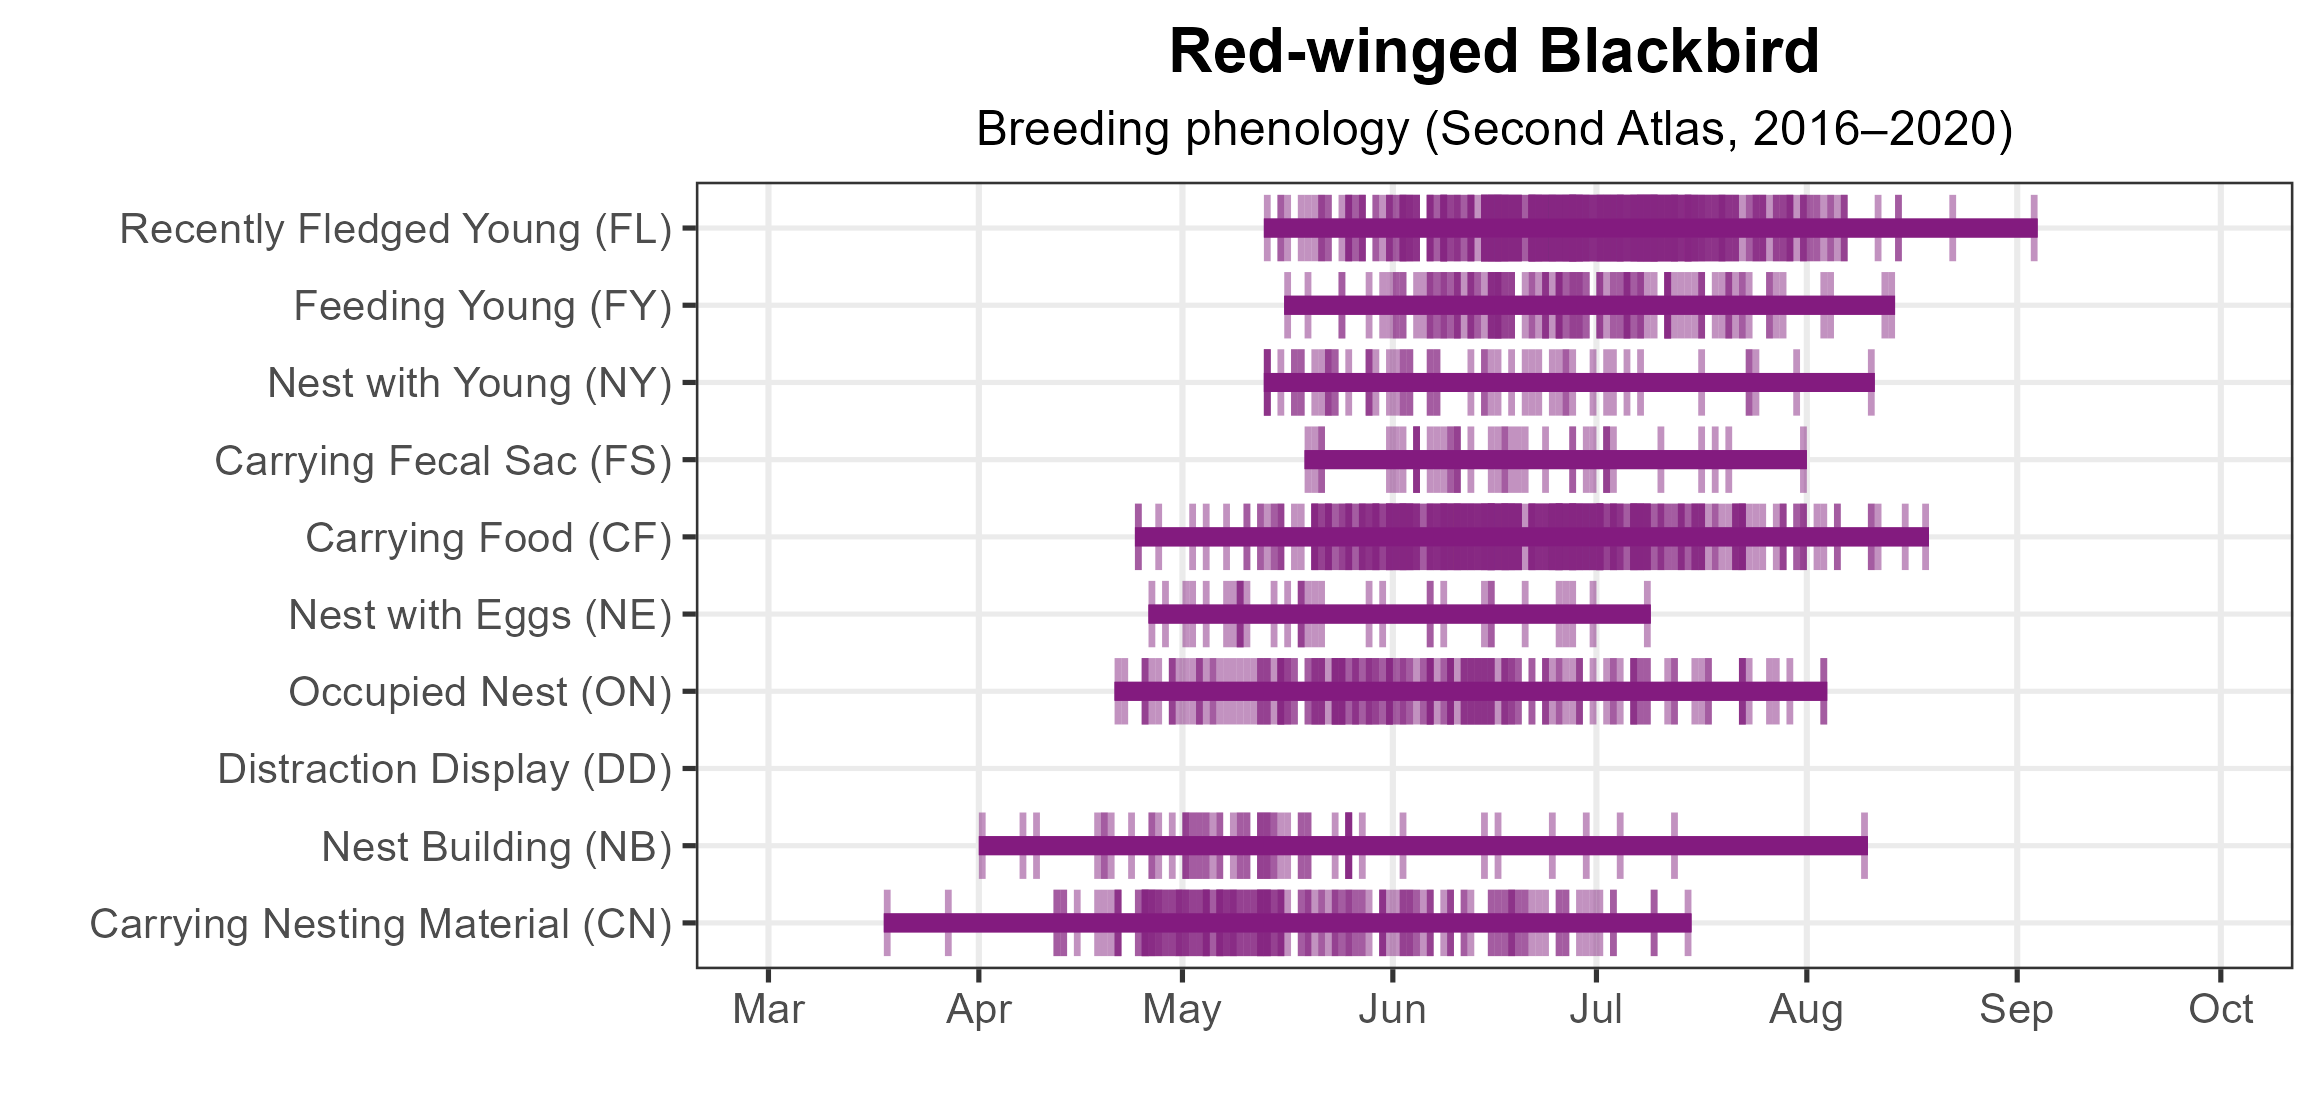
Figure 6: Red-winged Blackbird phenology: confirmed breeding codes. This graph shows a timeline of confirmed breeding behaviors. Tick marks represent individual observations of the behavior.
Population Status
Red-winged Blackbird relative abundance was estimated to be high in the agricultural valleys of the Mountains and Valleys region, the northern Piedmont region, and the Eastern Shore (Figure 7).
The total estimated Red-winged Blackbird population in the state is approximately 414,000 individuals (with a range between 336,000 and 512,000). Based on the North American Breeding Bird Survey (BBS), the Red-winged Blackbird population decreased by a significant 1.47% annually from 1966–2022 in Virginia, and between Atlas periods, it experienced a nonsignificant decline of 0.41% per year from 1987–2018 (Hostetler et al. 2023; Figure 8).
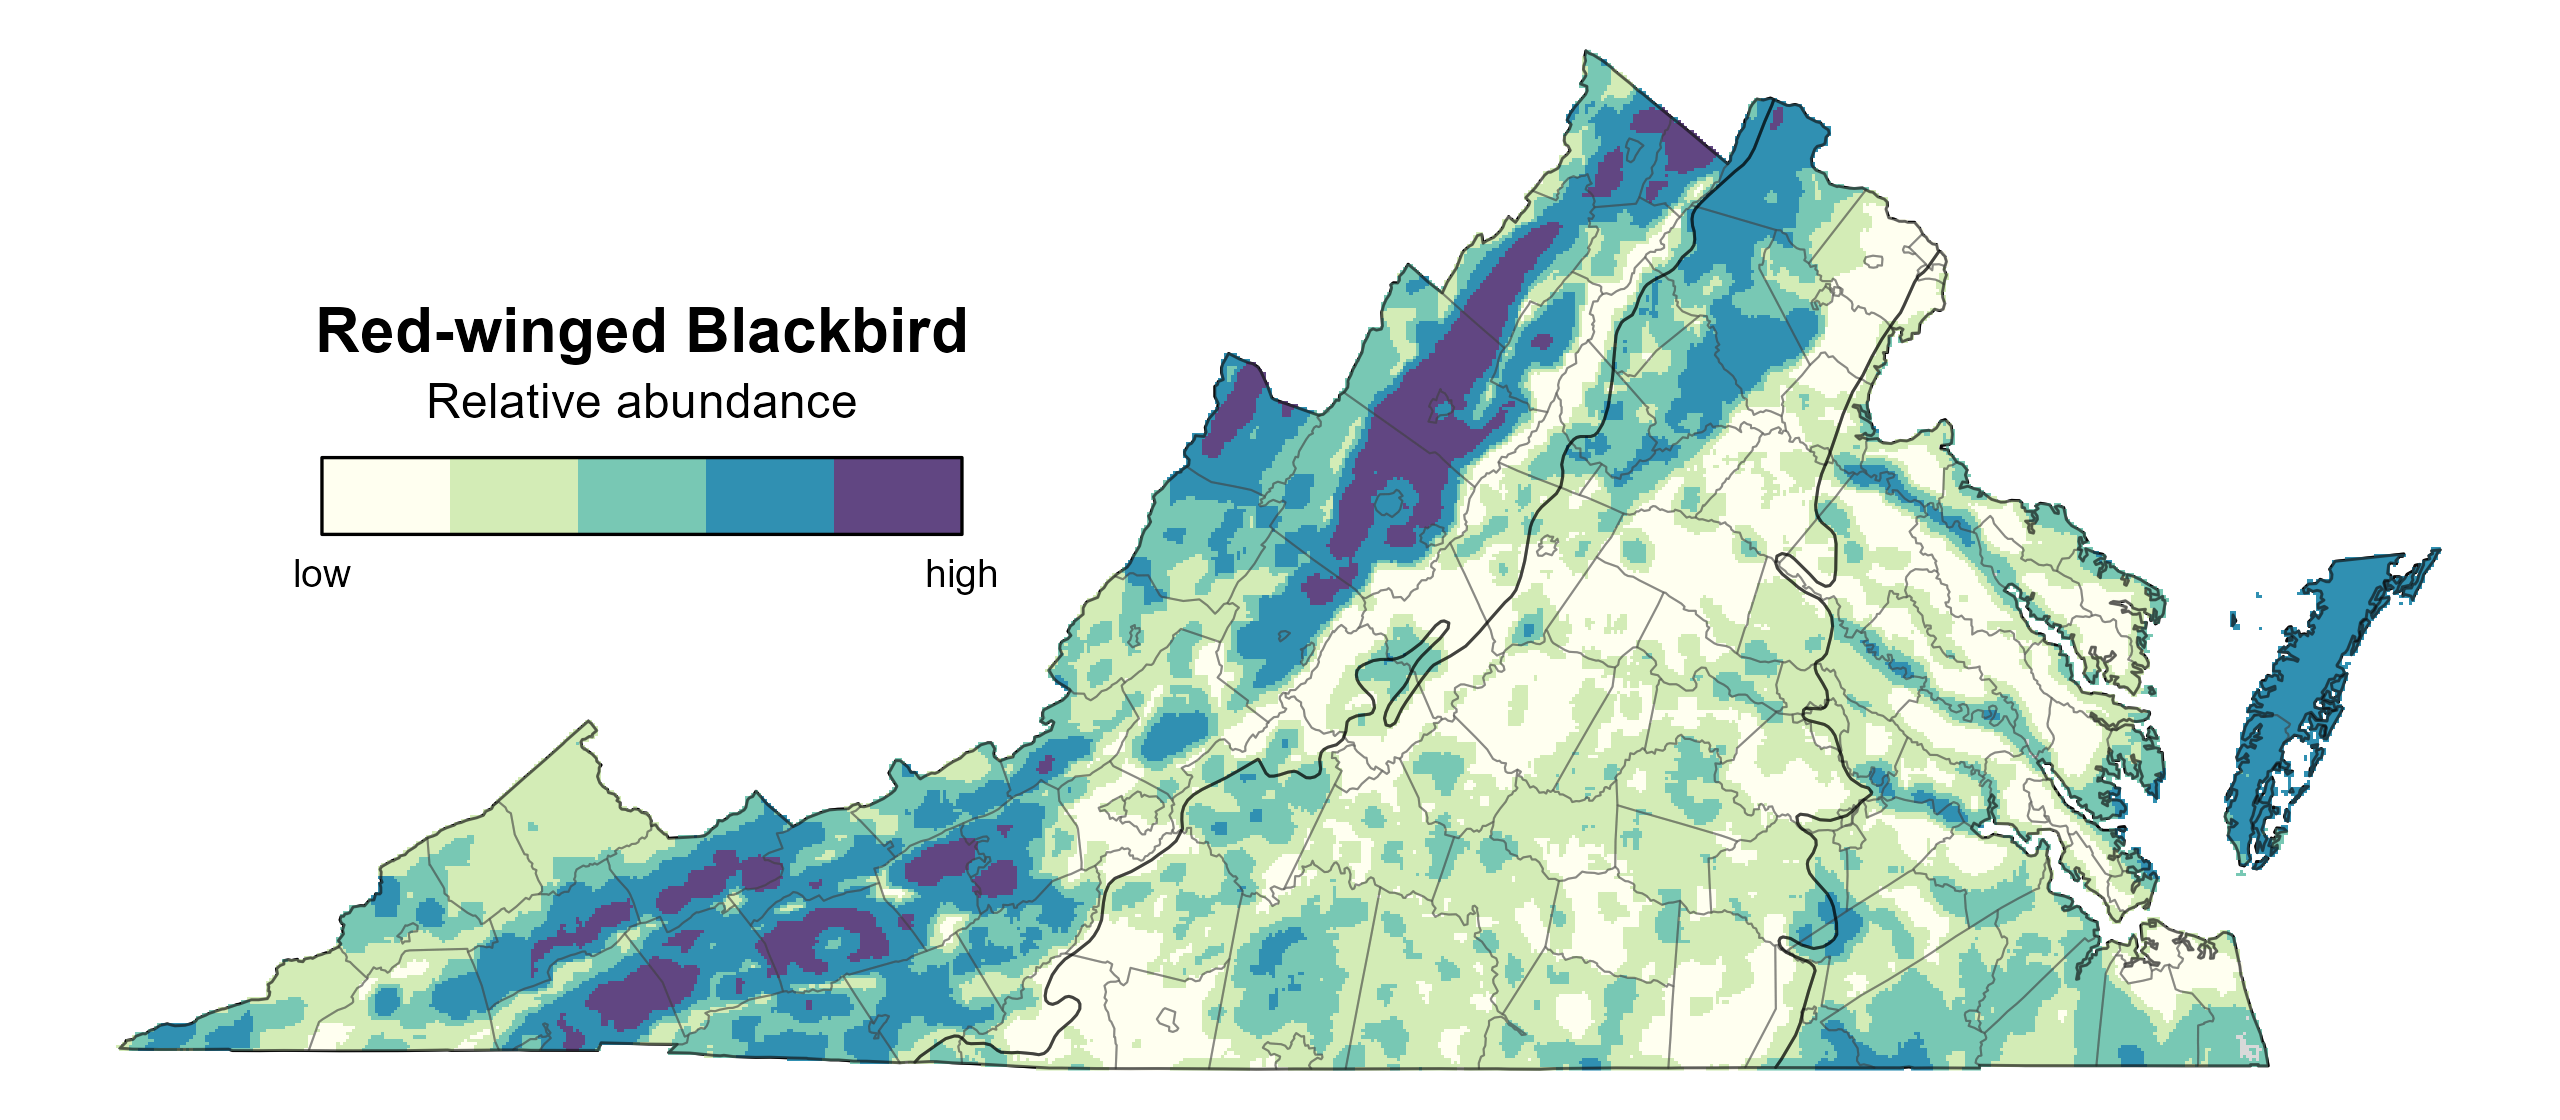
Figure 7: Red-winged Blackbird relative abundance (Second Atlas, 2016–2020). This map indicates the predicted abundance of this species at a 0.4 mi2 (1 km2) scale based on environmental (including habitat) factors. Abundance values are presented on a relative scale of low to high.

Figure 8: Red-winged Blackbird population trend for Virginia as estimated by the North American Breeding Bird Survey. The vertical axis shows species abundance; the horizontal axis shows the year. The solid line indicates the estimated population trend; there is a 97.5% probability that the true population trend falls between the dashed lines. The shaded bars indicate the First and Second Atlas periods.
Conservation
Red-winged Blackbirds have experienced a slight decline in Virginia and are classified as a Tier IV (Moderate Conservation Need) Species of Greatest Conservation Need in the 2025 Virginia Wildlife Action Plan (VDWR 2025). Although often thought of more as a nuisance species, efforts to restore habitats where they also occur, such as freshwater and salt water wetlands and prairie habitats, will also benefit this species (Yasukawa and Searcy 2020).
Interactive Map
The interactive map contains up to six Atlas layers (probability of occurrence for the First and Second Atlases, change in probability of occurrence between Atlases, breeding evidence for the First and Second Atlases, and abundance for the Second Atlas) that can be viewed one at a time. To view an Atlas map layer, mouse over the layer box in the upper left. County lines and physiographic regional boundaries (Mountains and Valleys, Piedmont, and Coastal Plain) can be turned on and off by checking or unchecking the box below the layer box. Within the map window, users can hover on a block to see its value for each layer and pan and zoom to see roads, towns, and other features of interest that are visible beneath a selected layer.
View Interactive Map in Full Screen
References
Dolbeer, R. A. (1982). Migration patterns for age and sex classes of blackbirds and starlings. Journal of Field Ornithology 53:28–46.
Hostetler, J. A., J. R. Sauer, J. E. Hines, D. Ziolkowski, and M. Lutmerding (2023). The North American breeding bird survey, analysis results 1966–2022. U.S. Geological Survey, Laurel, MD, USA. https://doi.org/10.5066/P9SC7T11.
Virginia Department of Wildlife Resources (VDWR) (2025). Virginia wildlife action plan. Virginia Department of Wildlife Resources, Henrico, VA, USA. 506 pp.
Yasukawa, K. and W. A. Searcy (2020). Red-winged Blackbird (Agelaius phoeniceus), version 1.0. In Birds of the World (P. G. Rodewald, Editor). Cornell Lab of Ornithology, Ithaca, NY, USA. https://doi.org/10.2173/bow.rewbla.01.