Introduction
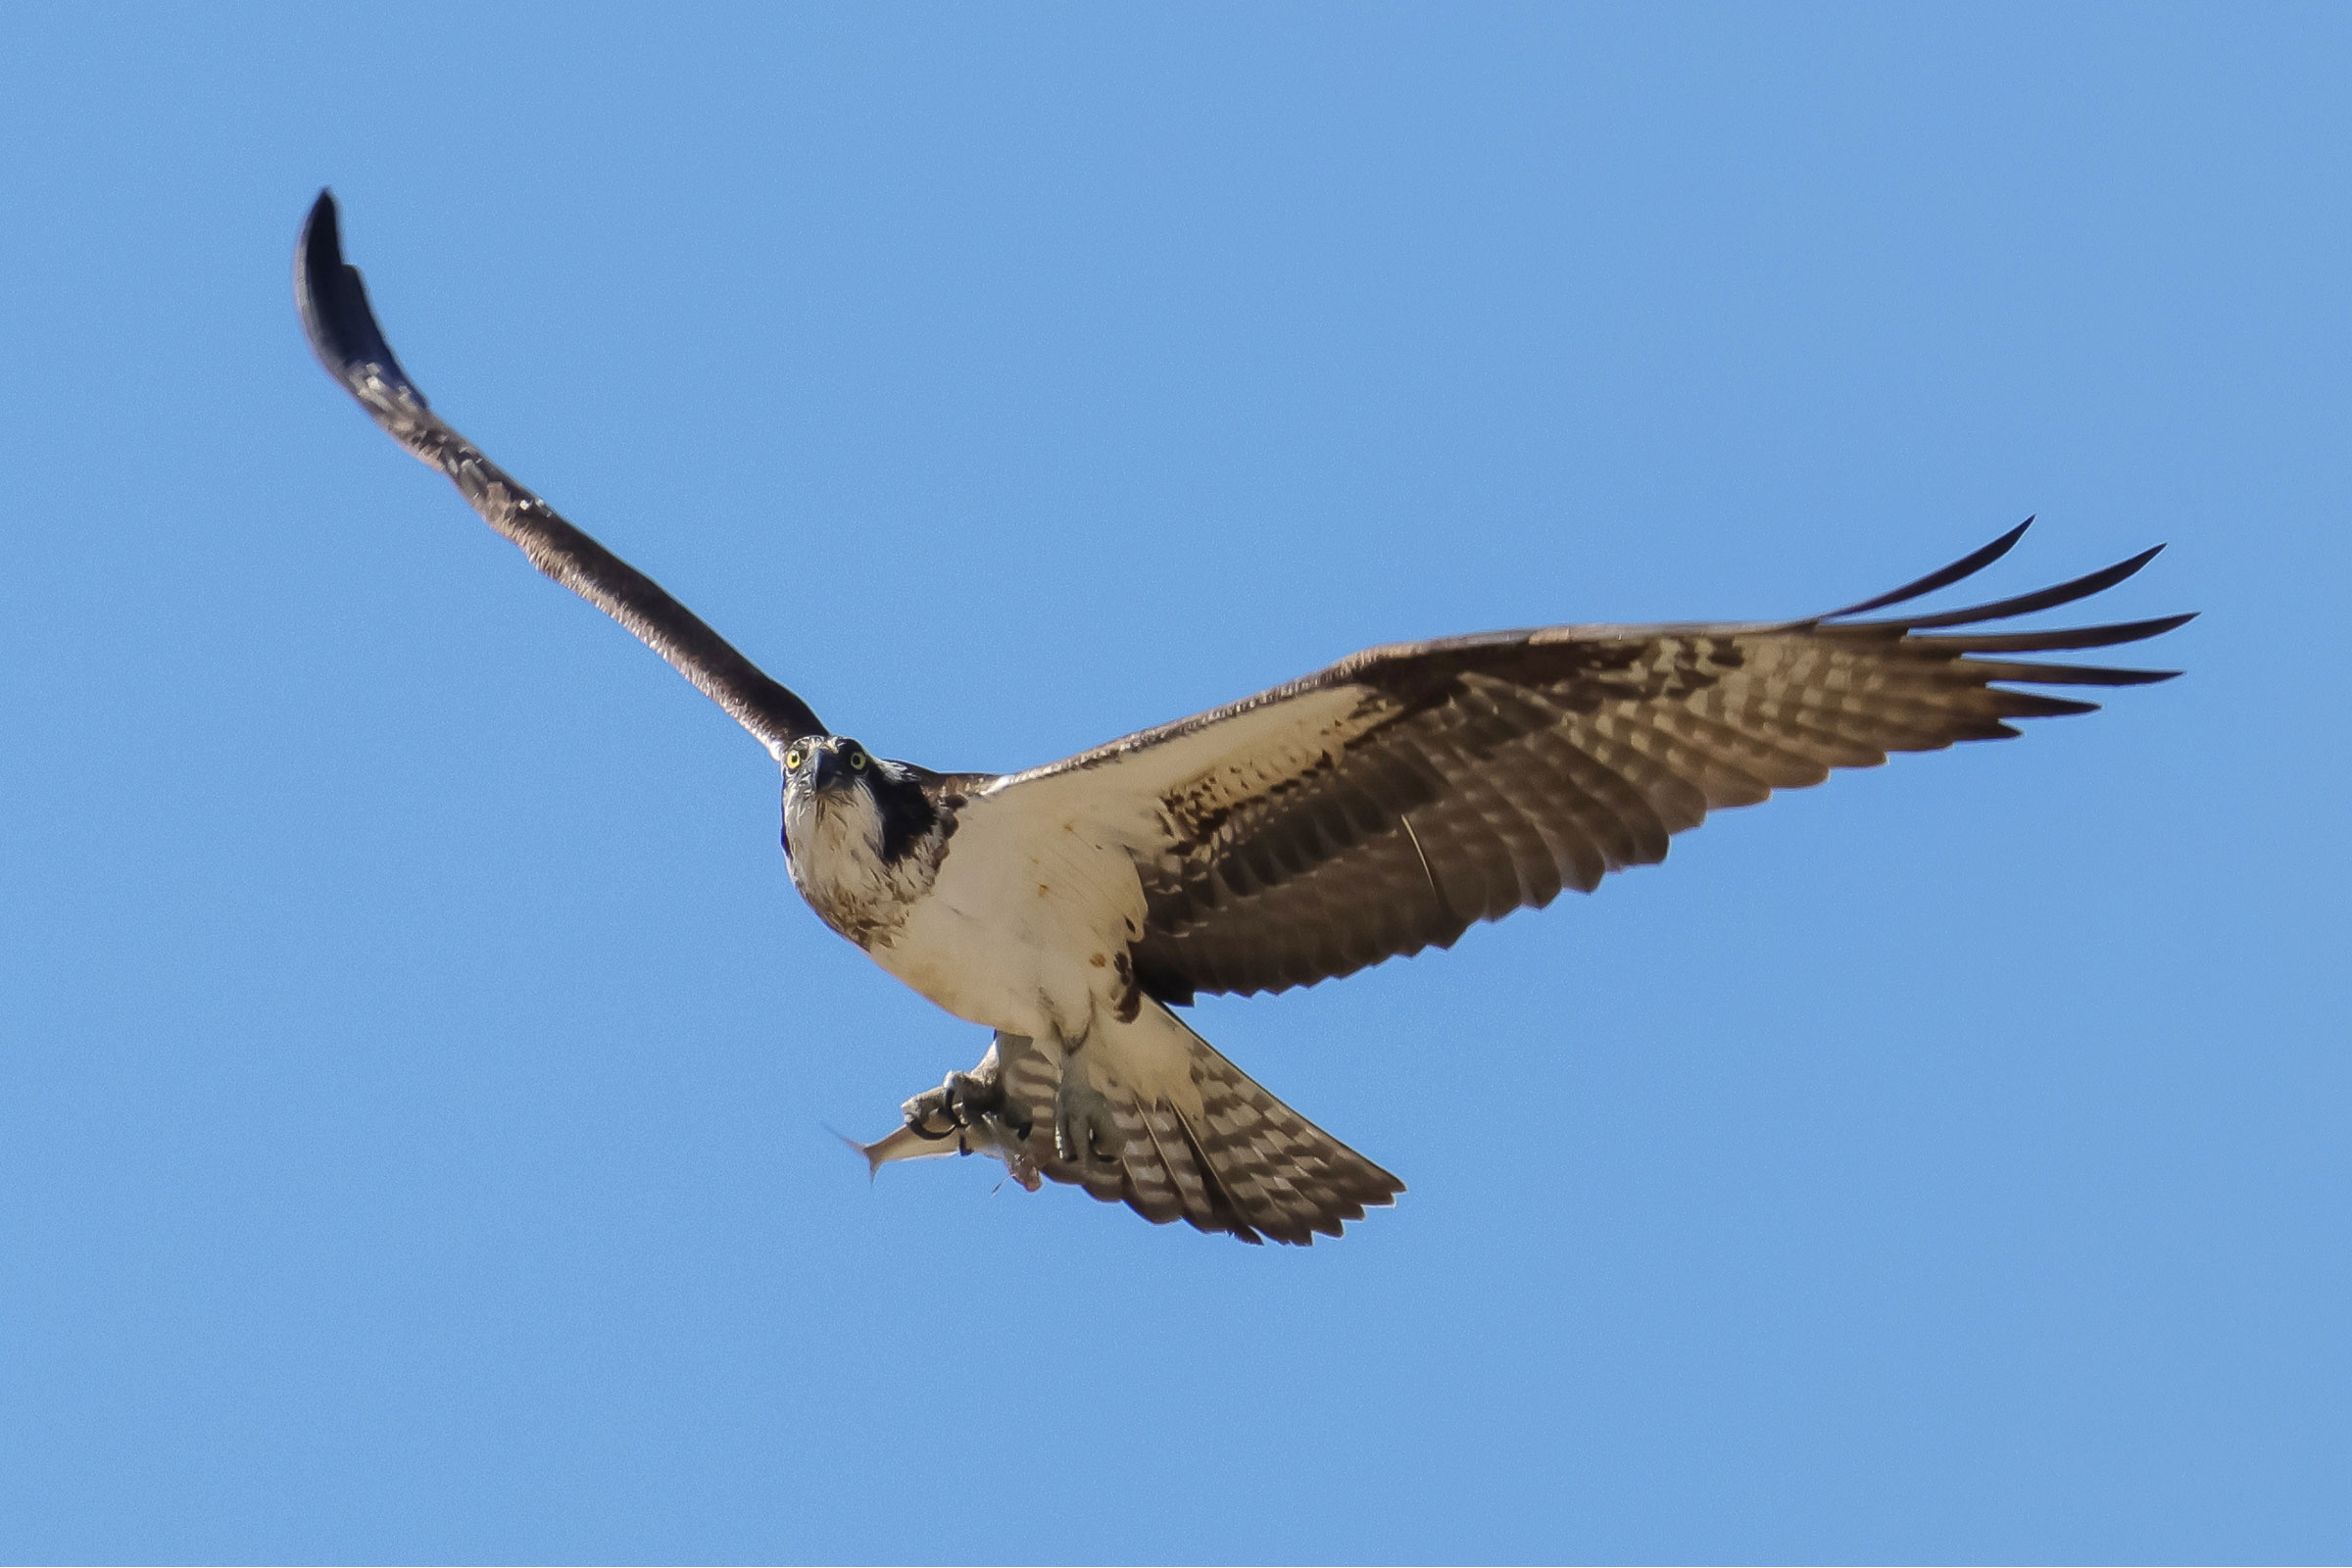
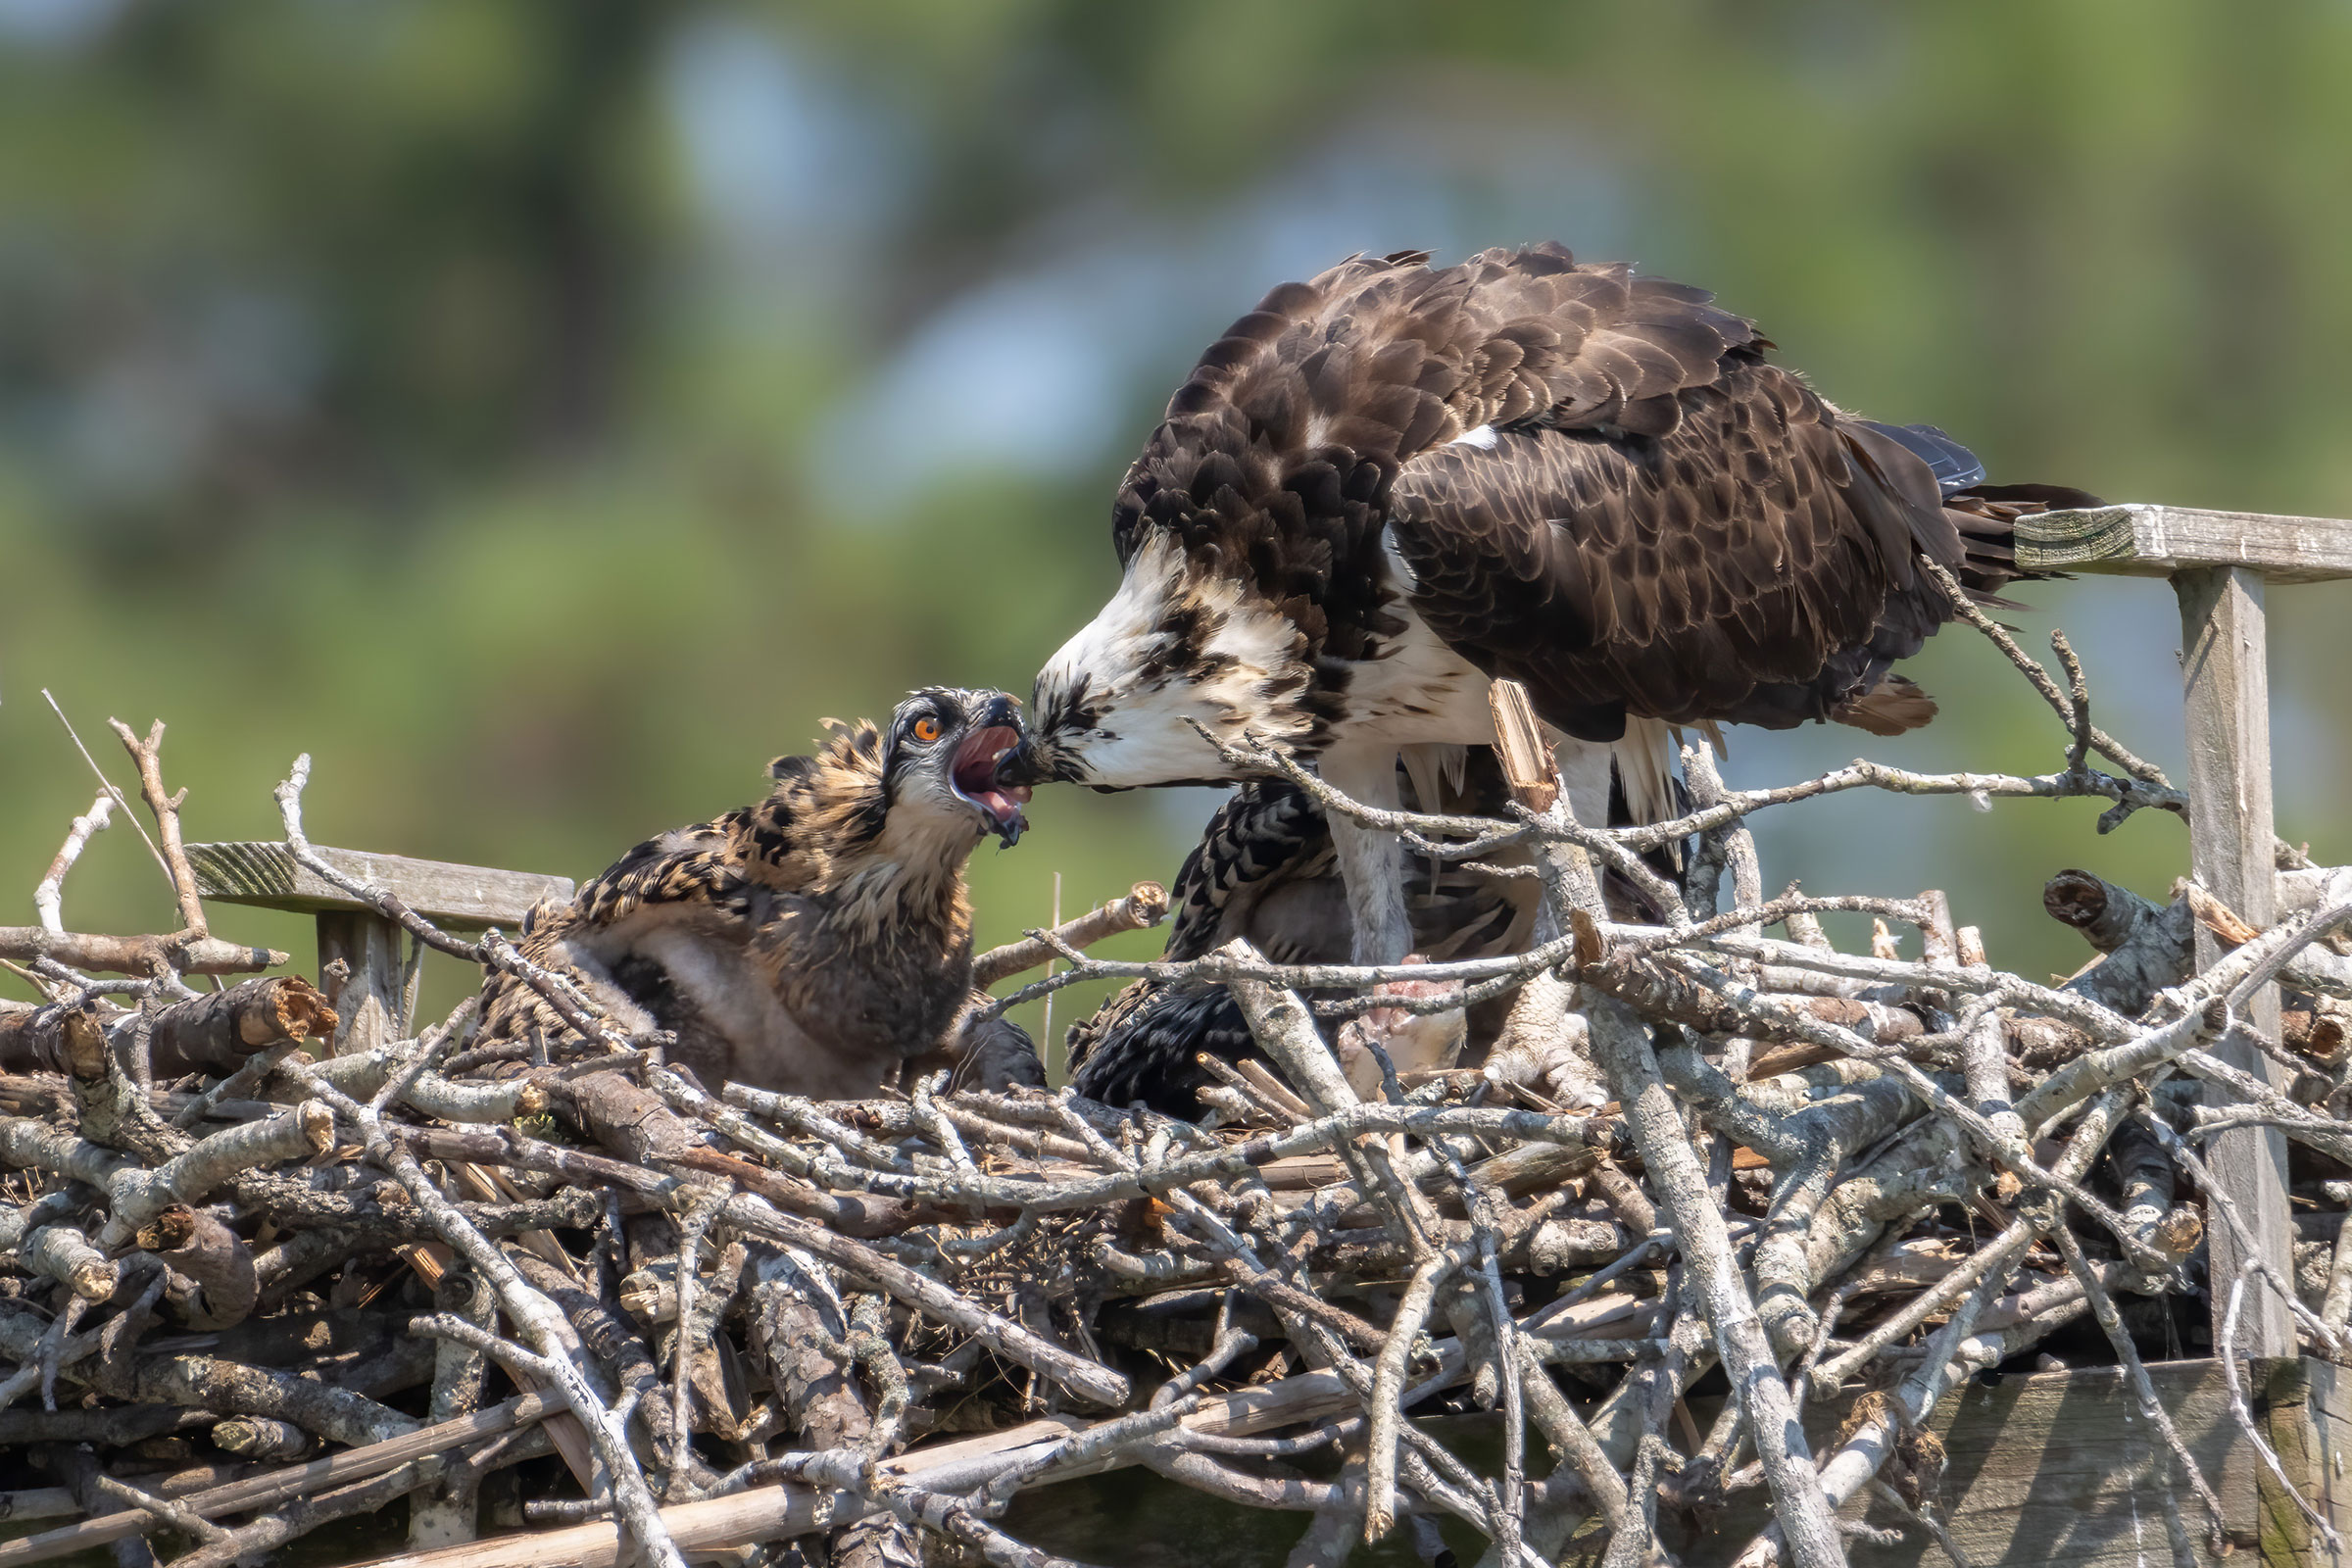
The Osprey is a fish-eating raptor uniquely adapted to capturing its prey. It has a reversible outer toe and barbed structures on its feet to improve its ability to hold slippery fish (Bierregaard et al. 2020). It can scan for fish from great heights, then drop down to hunt before plunging feet first into the water to capture its prey (Bierregaard et al. 2020).
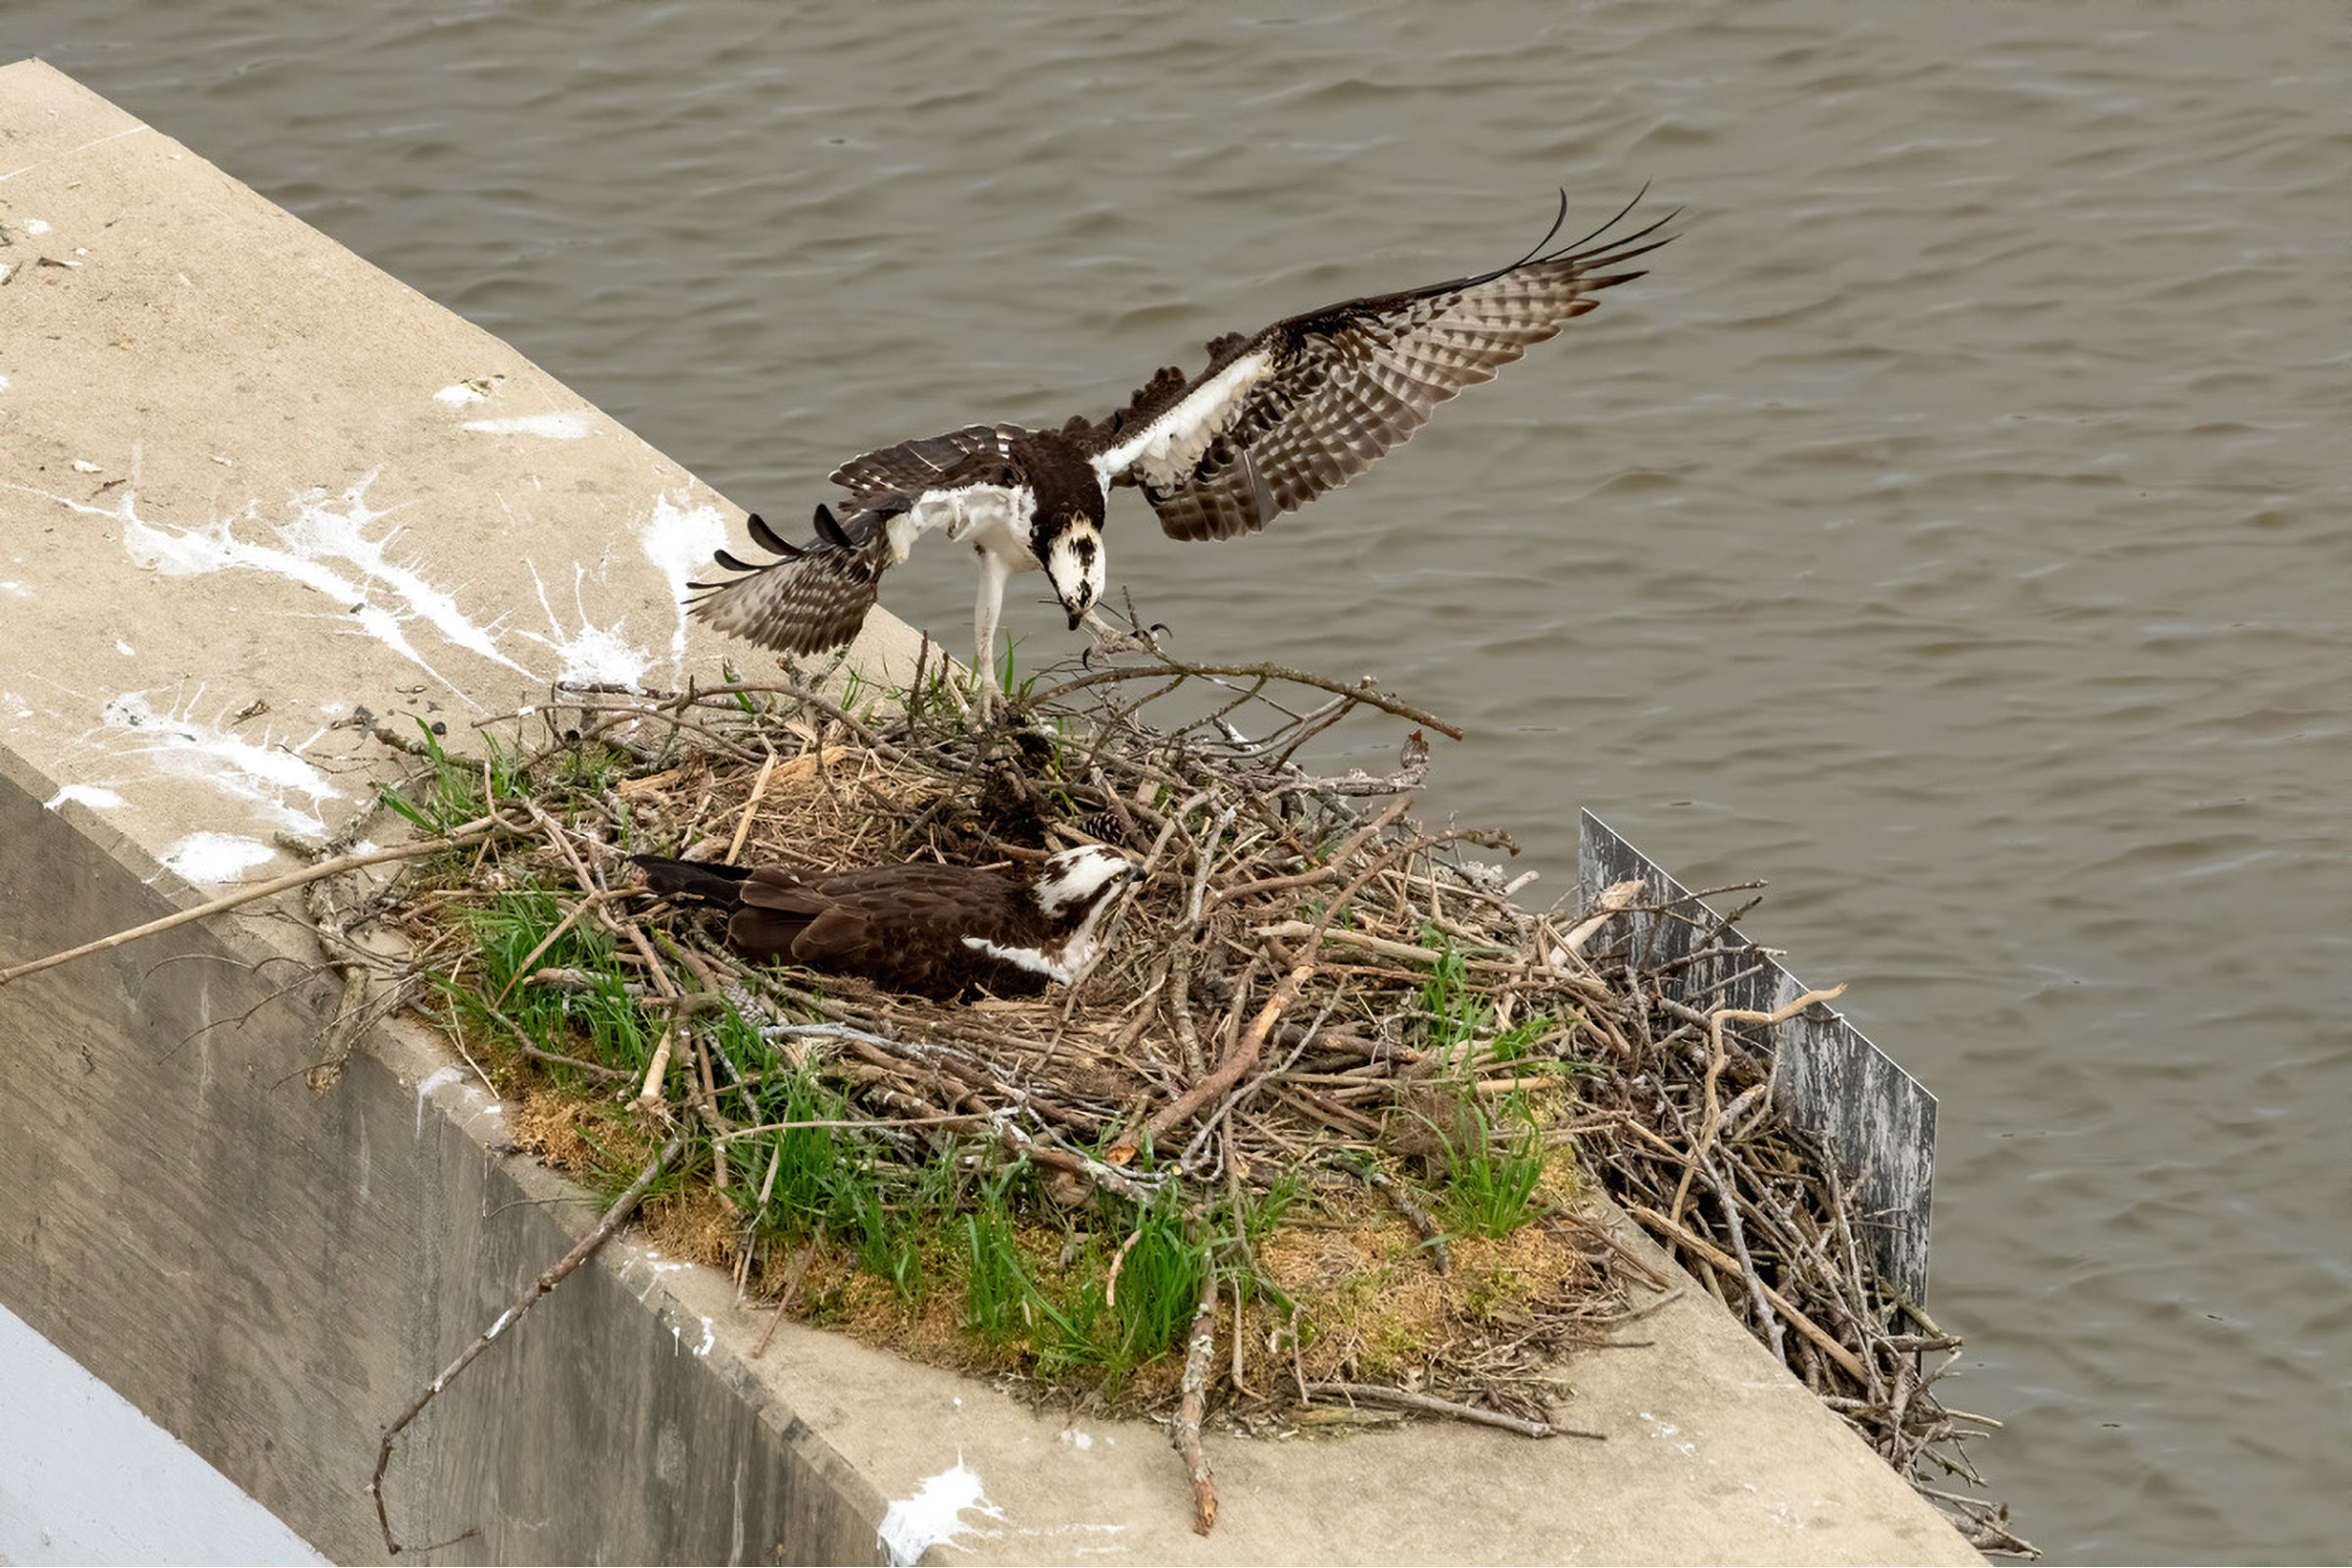
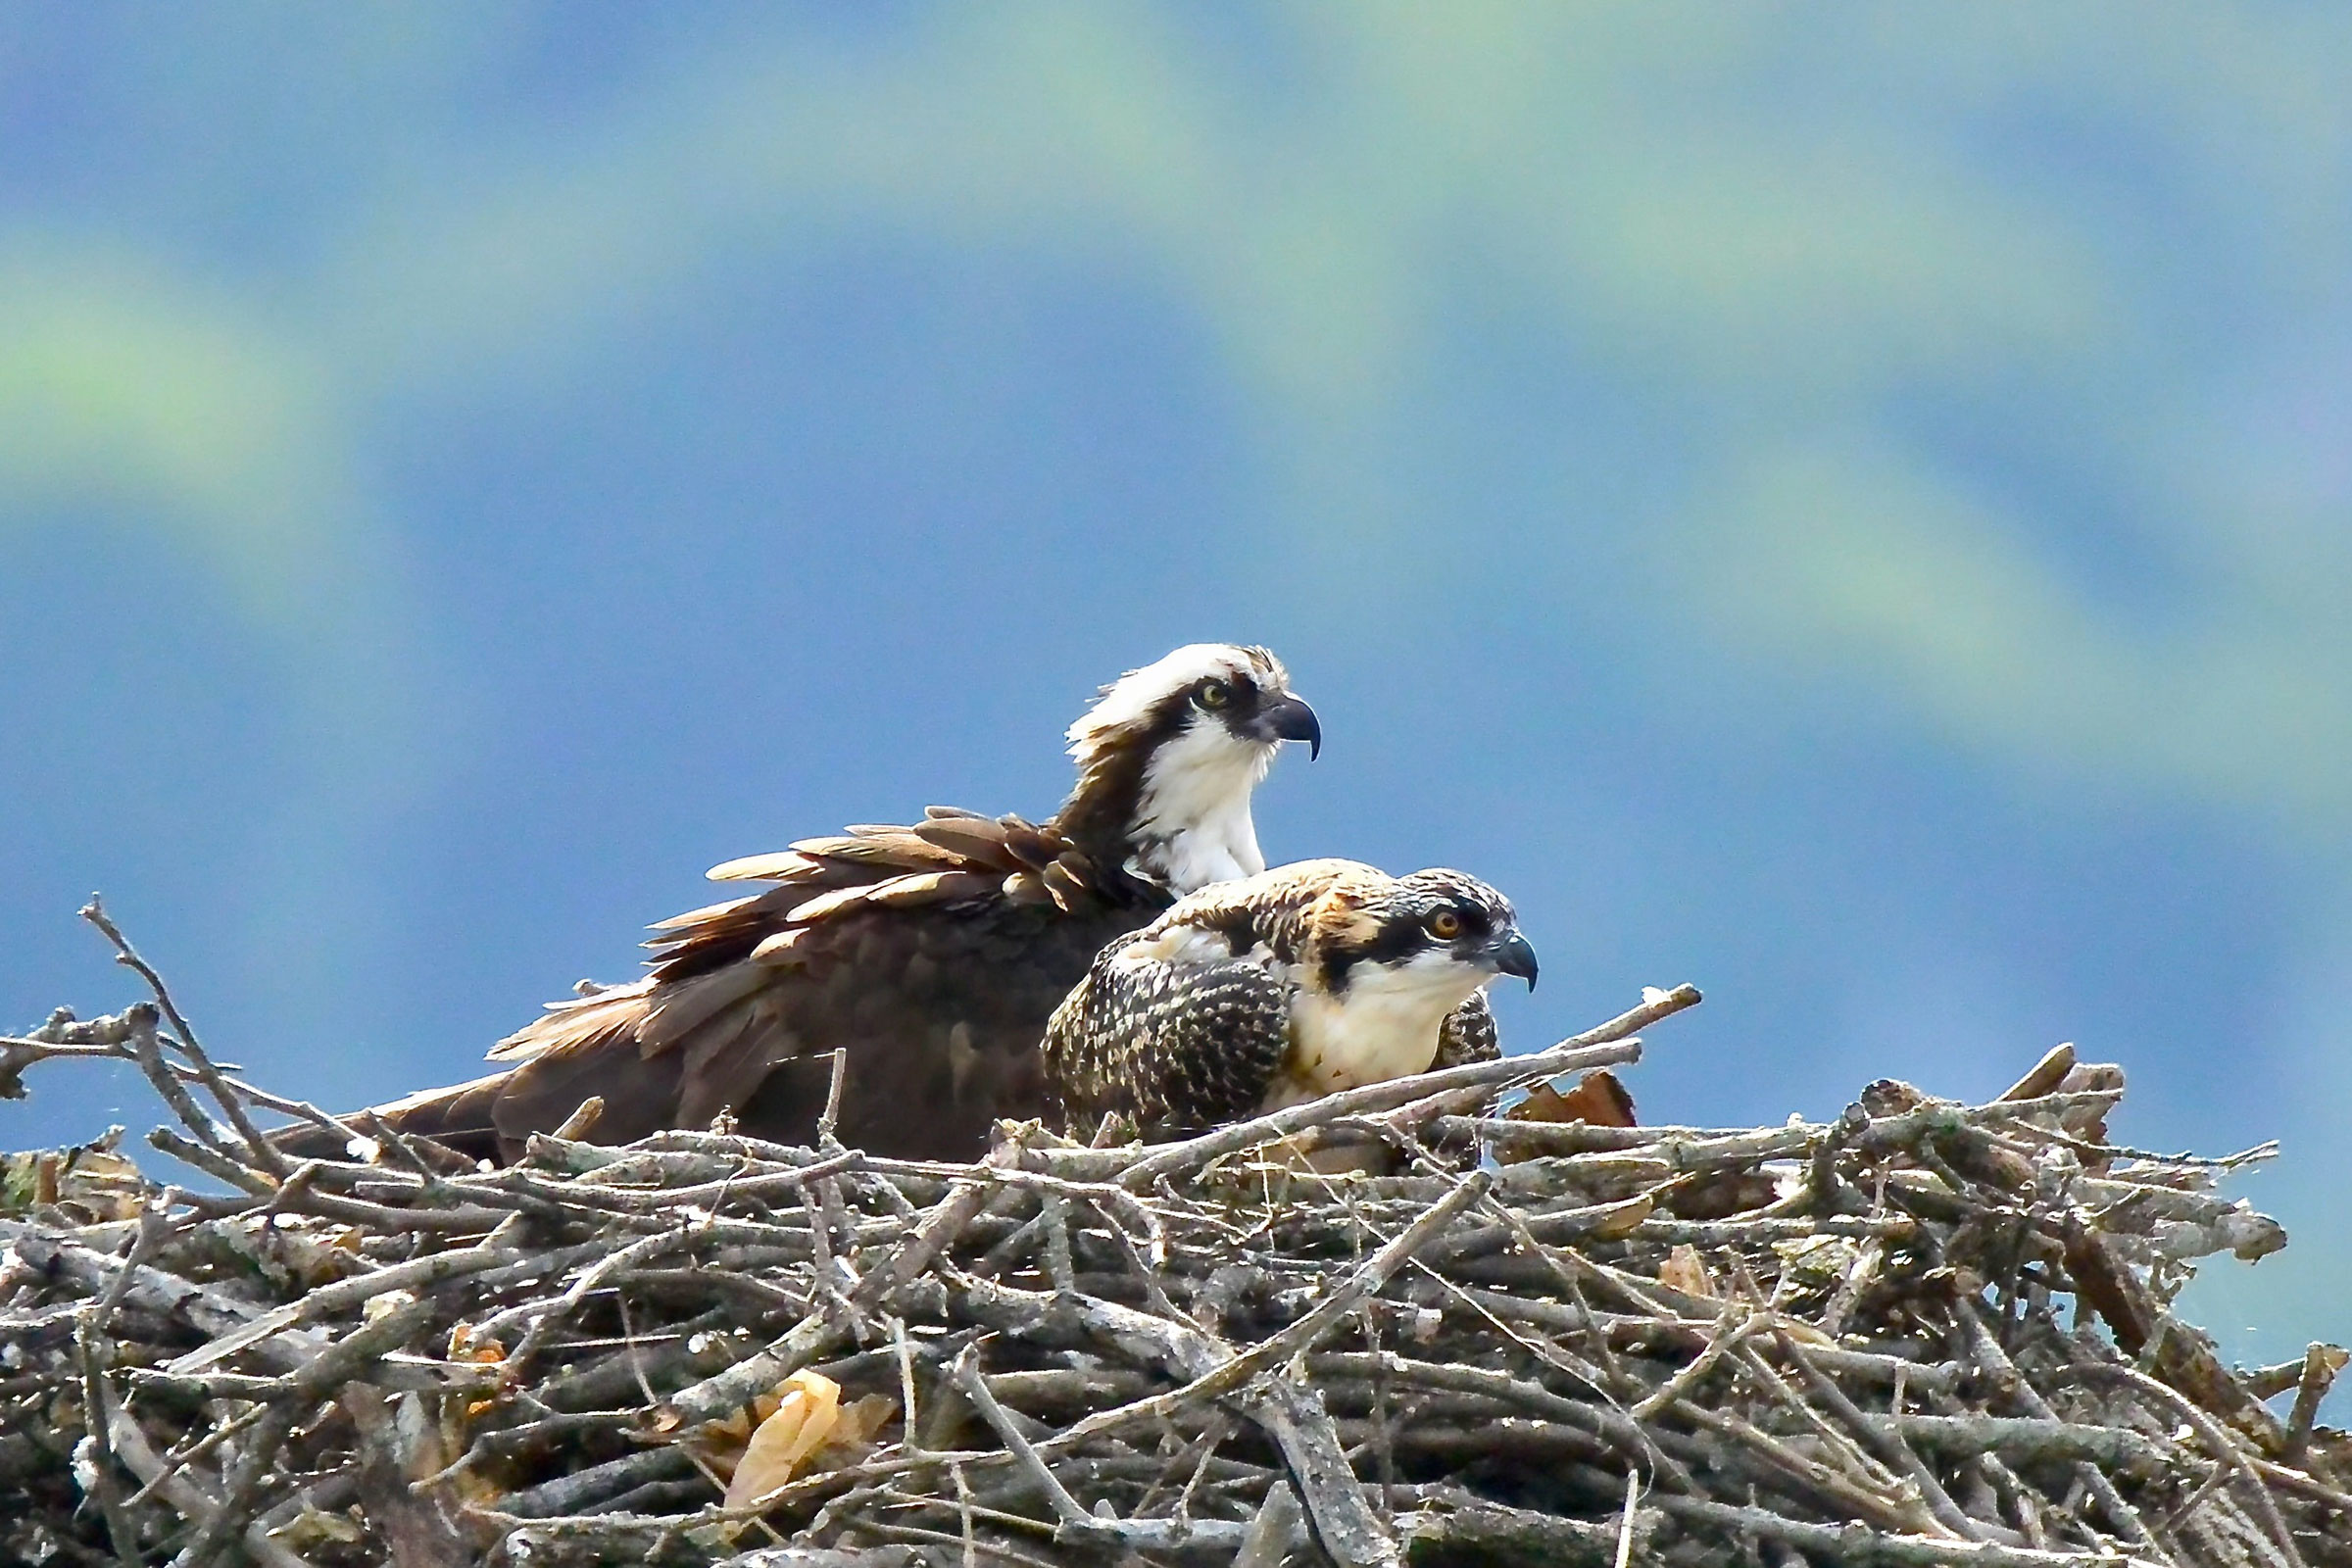
Ospreys build large stick nests, which they reuse in subsequent years. Aided by their ability to tolerate human activity, they can nest on a variety of artificial structures. These may include duck blinds, channel markers, nest platforms, utility lines, and communication towers (Bierregaard et al. 2020), as well as boathouses and stadium lights.
From the 1950s to 1970s, the Osprey experienced substantial declines in the Chesapeake Bay area, losing more than half of its breeding pairs, primarily due to the widespread use of DDT (Watts and Paxton 2007; Bierregaard et al. 2020). Since then its population has rebounded, and although population growth in Virginia has generally stabilized, declines may be occurring in the Chesapeake Bay (see Conservation section).
Breeding Distribution
Given that Ospreys feed almost exclusively on fish, their distribution in Virginia is strongly tied to large bodies of water, and as such, they are most likely to occur near the rivers, estuaries, and coastal areas of the Coastal Plain (Figure 1). Further inland, their distribution is patchy and concentrated near large freshwater lakes, such as Smith Mountain Lake and John H. Kerr reservoir, and in large riparian systems, such as the Roanoke River.
Between the First and Second Atlases (Figures 1 and 2), the likelihood of Osprey occurrence remained generally constant, except for notable increases in occurrence in Northern Virginia and the Richmond areas as well as small potential increases in other urban areas across the state (Figure 3).
View Environmental Associations
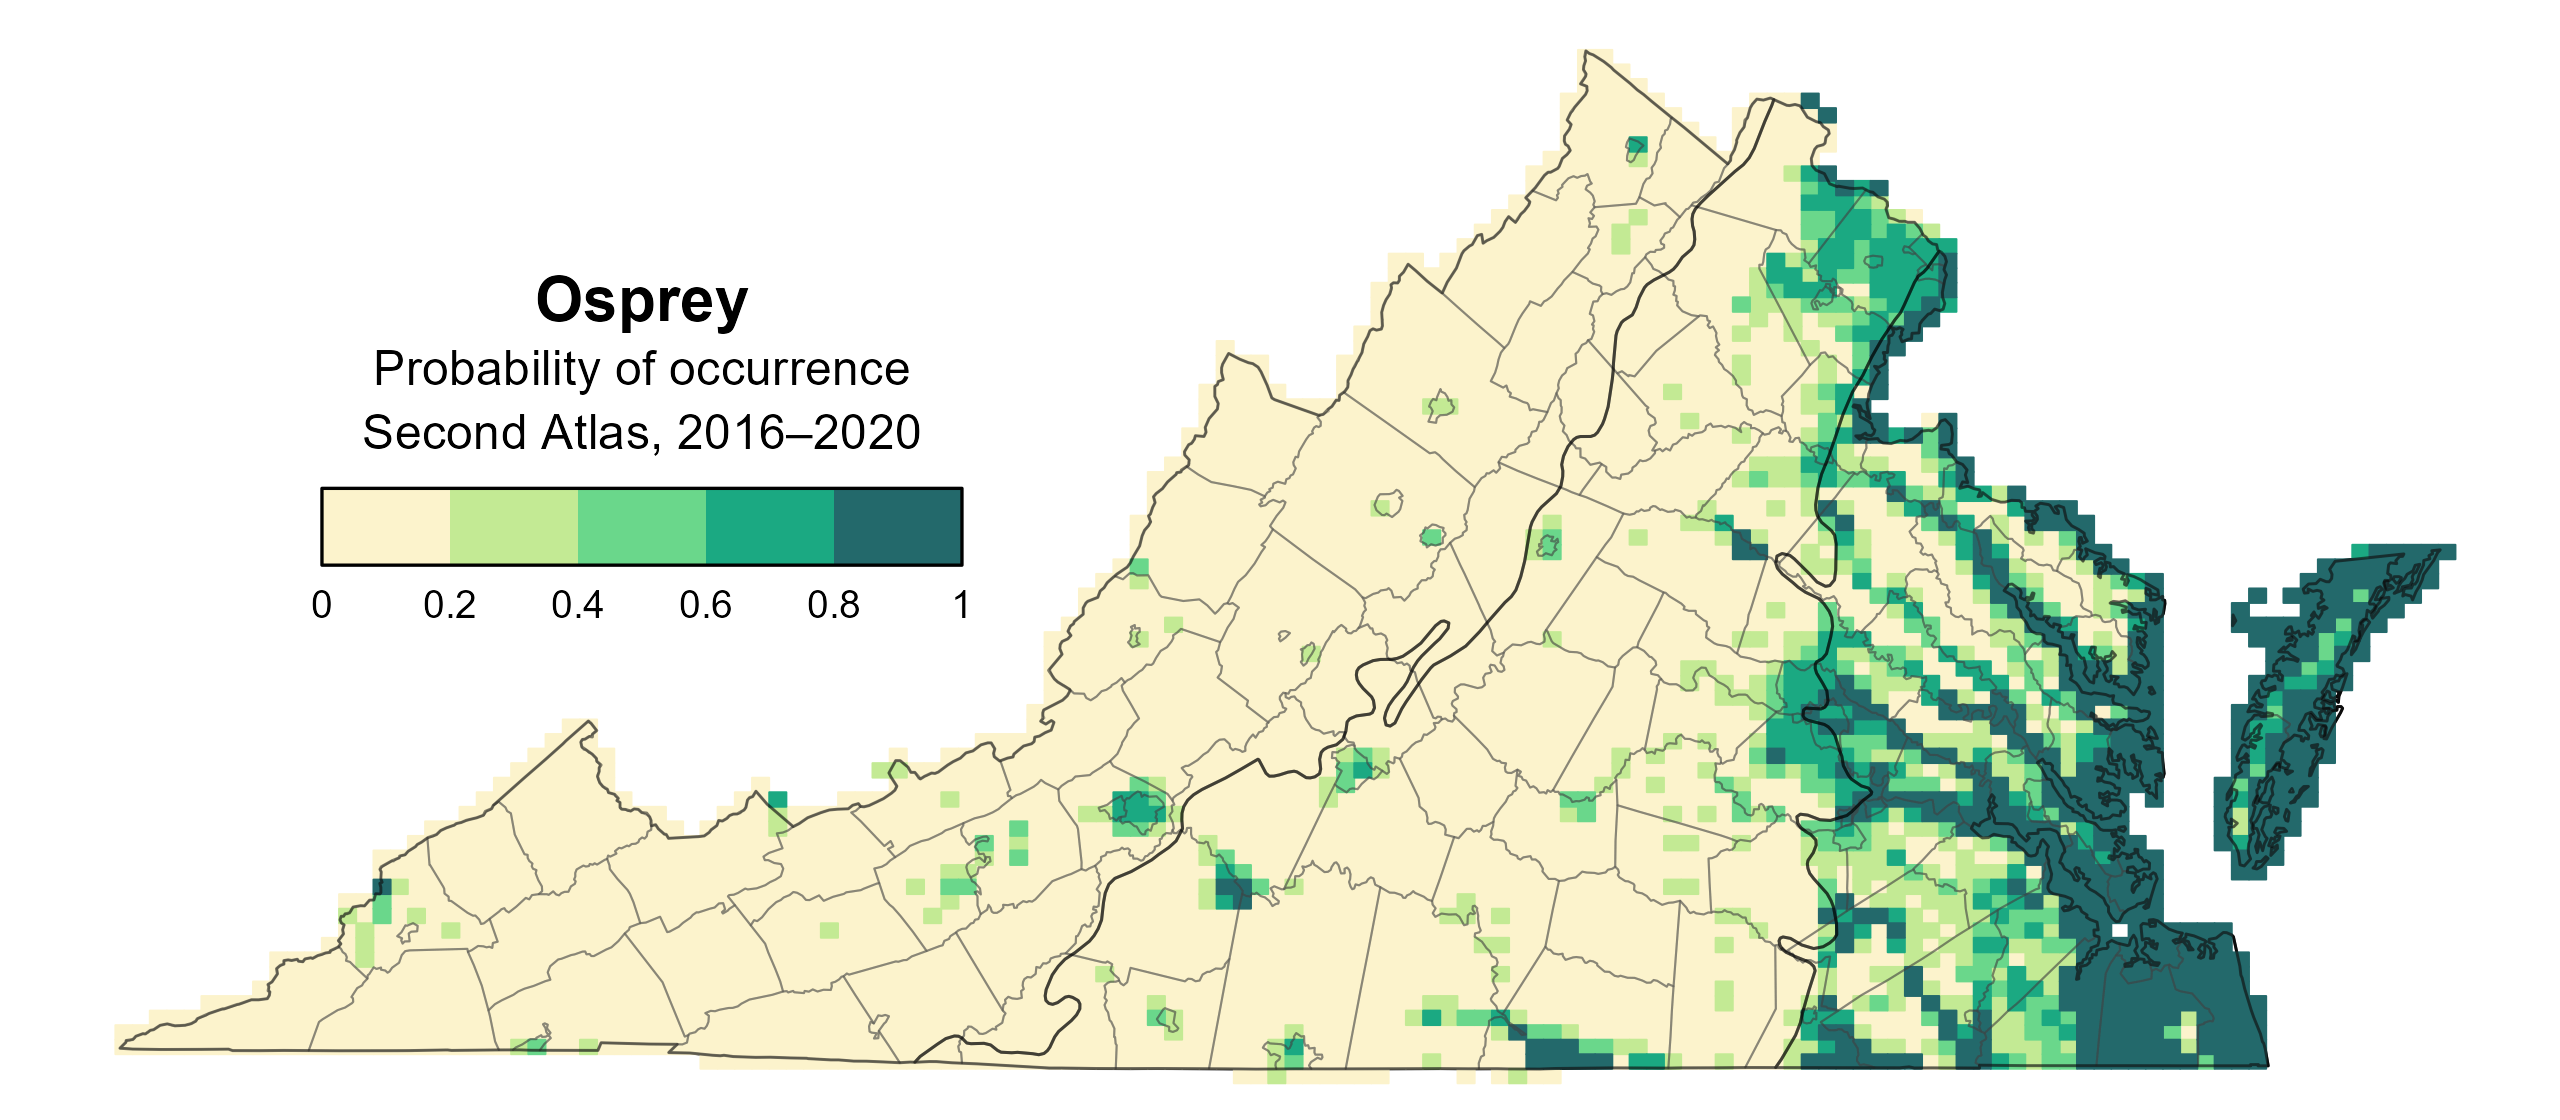
Figure 1: Osprey breeding distribution based on probability of occurrence (Second Atlas, 2016–2020). This map indicates the probability that this species will occur in an Atlas block (an approximately 10 mi2 [26 km2] survey unit) based on environmental (including habitat) factors and after adjusting for the probability of detection (variation in survey effort among blocks).
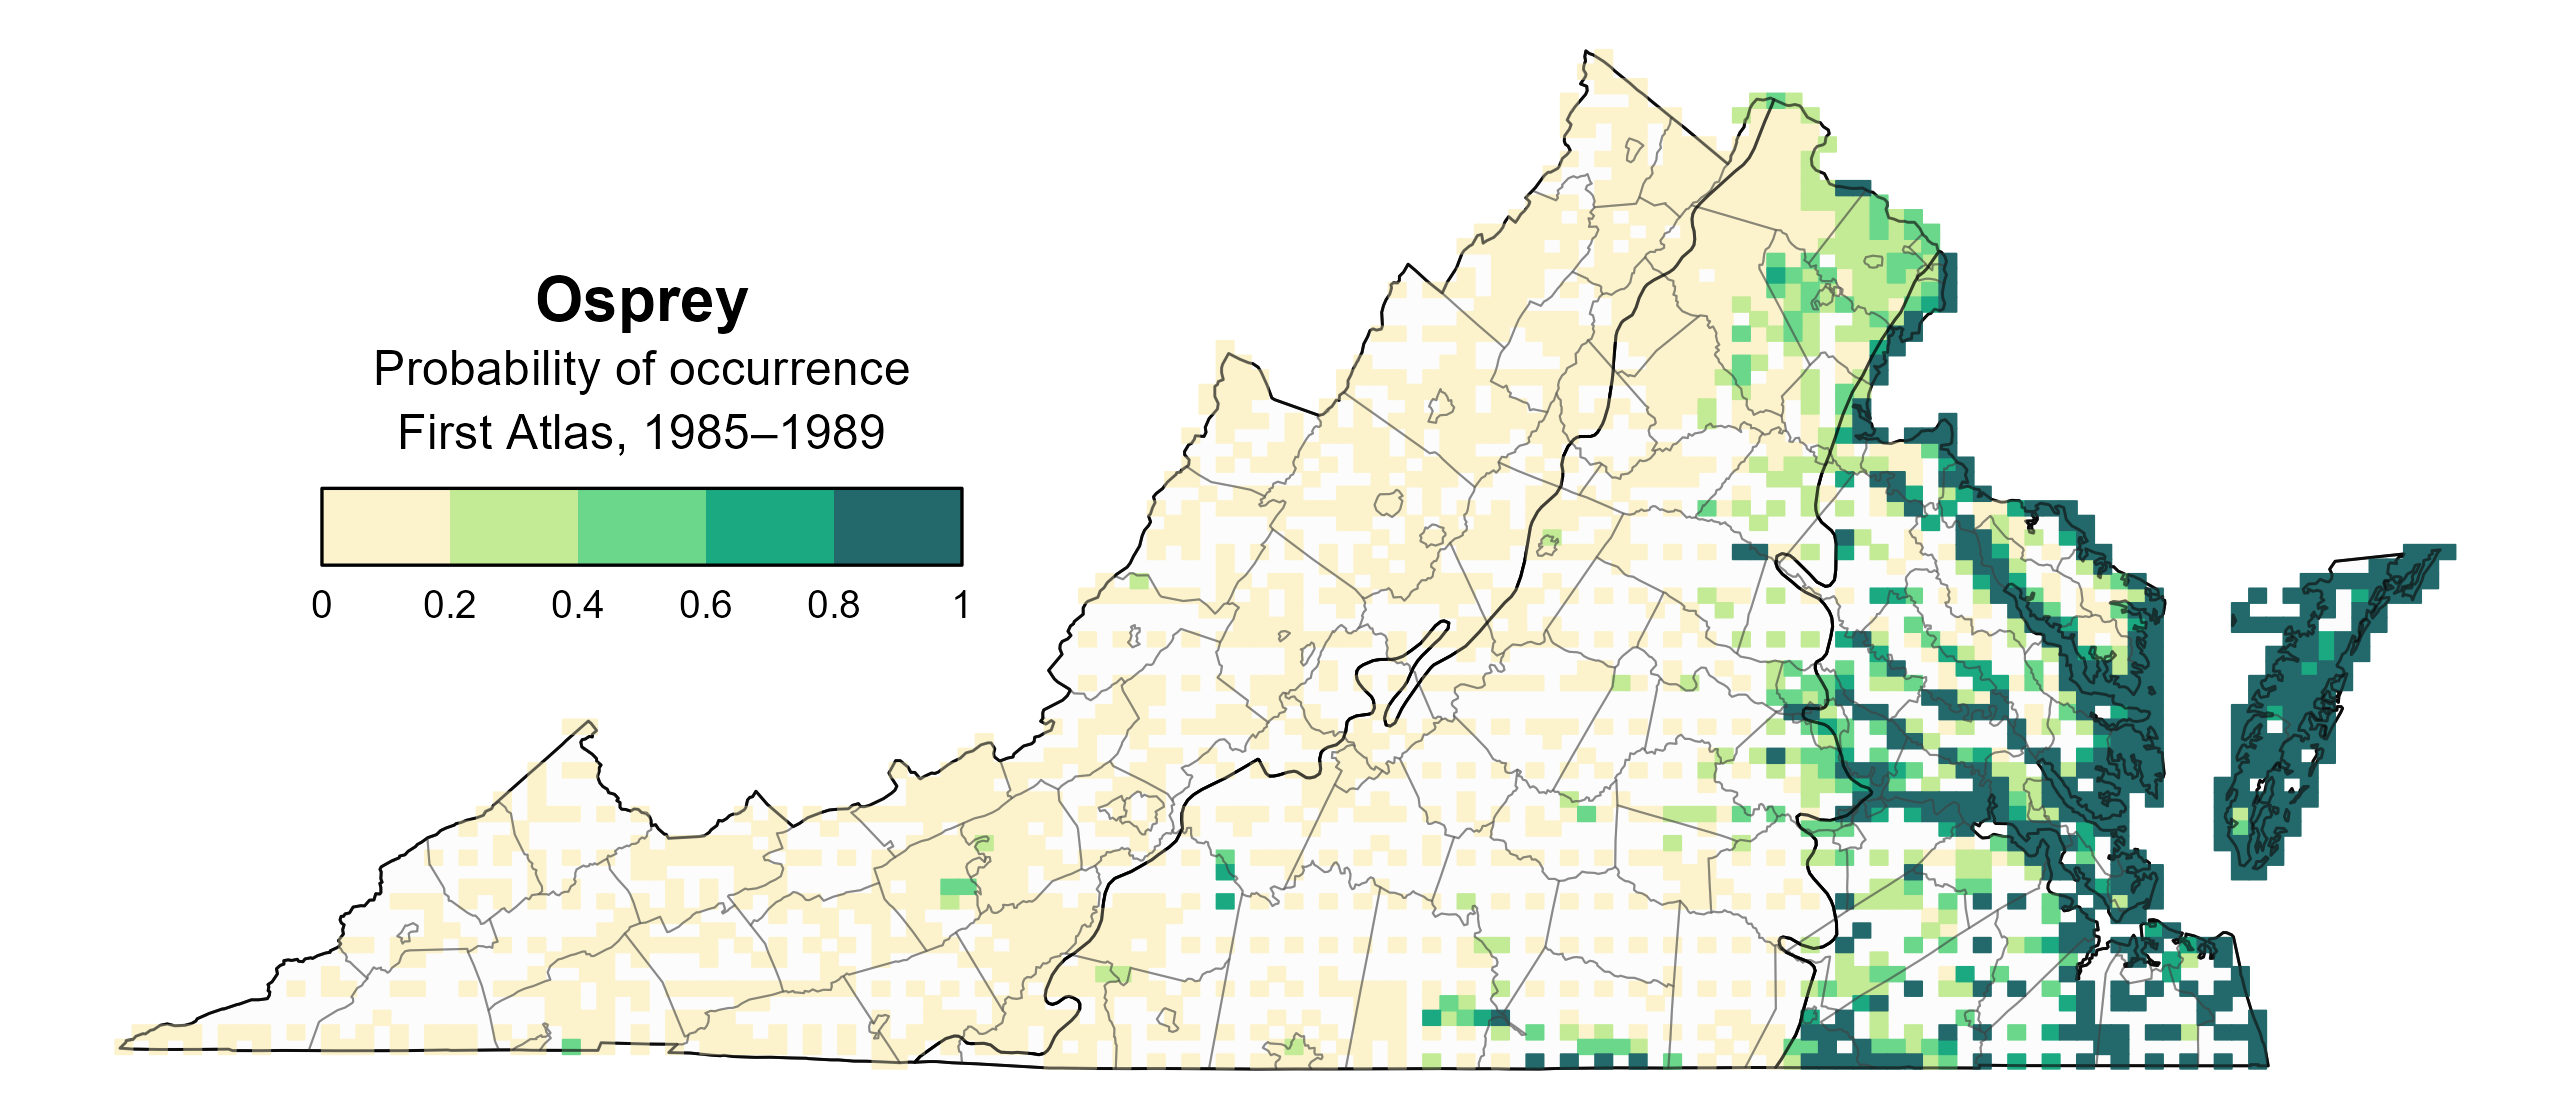
Figure 2: Osprey breeding distribution based on probability of occurrence (First Atlas, 1985–1989). This map indicates the probability that this species will occur in an Atlas block (an approximately 10 mi2 [26 km2] survey unit) based on environmental (including habitat) factors and after adjusting for the probability of detection (variation in survey effort among blocks). Blocks in white were not surveyed during the First Atlas and were not modeled.

Figure 3: Osprey change in breeding distribution between Atlases (1985–1989 and 2016–2020) based on probability of occurrence. This map indicates the change in the probability that this species will occur in a block (an approximately 10 mi2 [26 km2] survey unit) between Atlas periods. Blocks with no change may have constant presence or constant absence. Blocks in white were not surveyed during the First Atlas and were not modeled.
Breeding Evidence
Ospreys were confirmed breeders in 402 blocks and 58 counties and probable breeders in an additional county (Figure 4). Breeding confirmations were more widespread during the Second Atlas, while they were documented primarily in the Coastal Plain region during the First Atlas, indicative of their population increase in the state (see Population Status section; Figures 4 and 5).
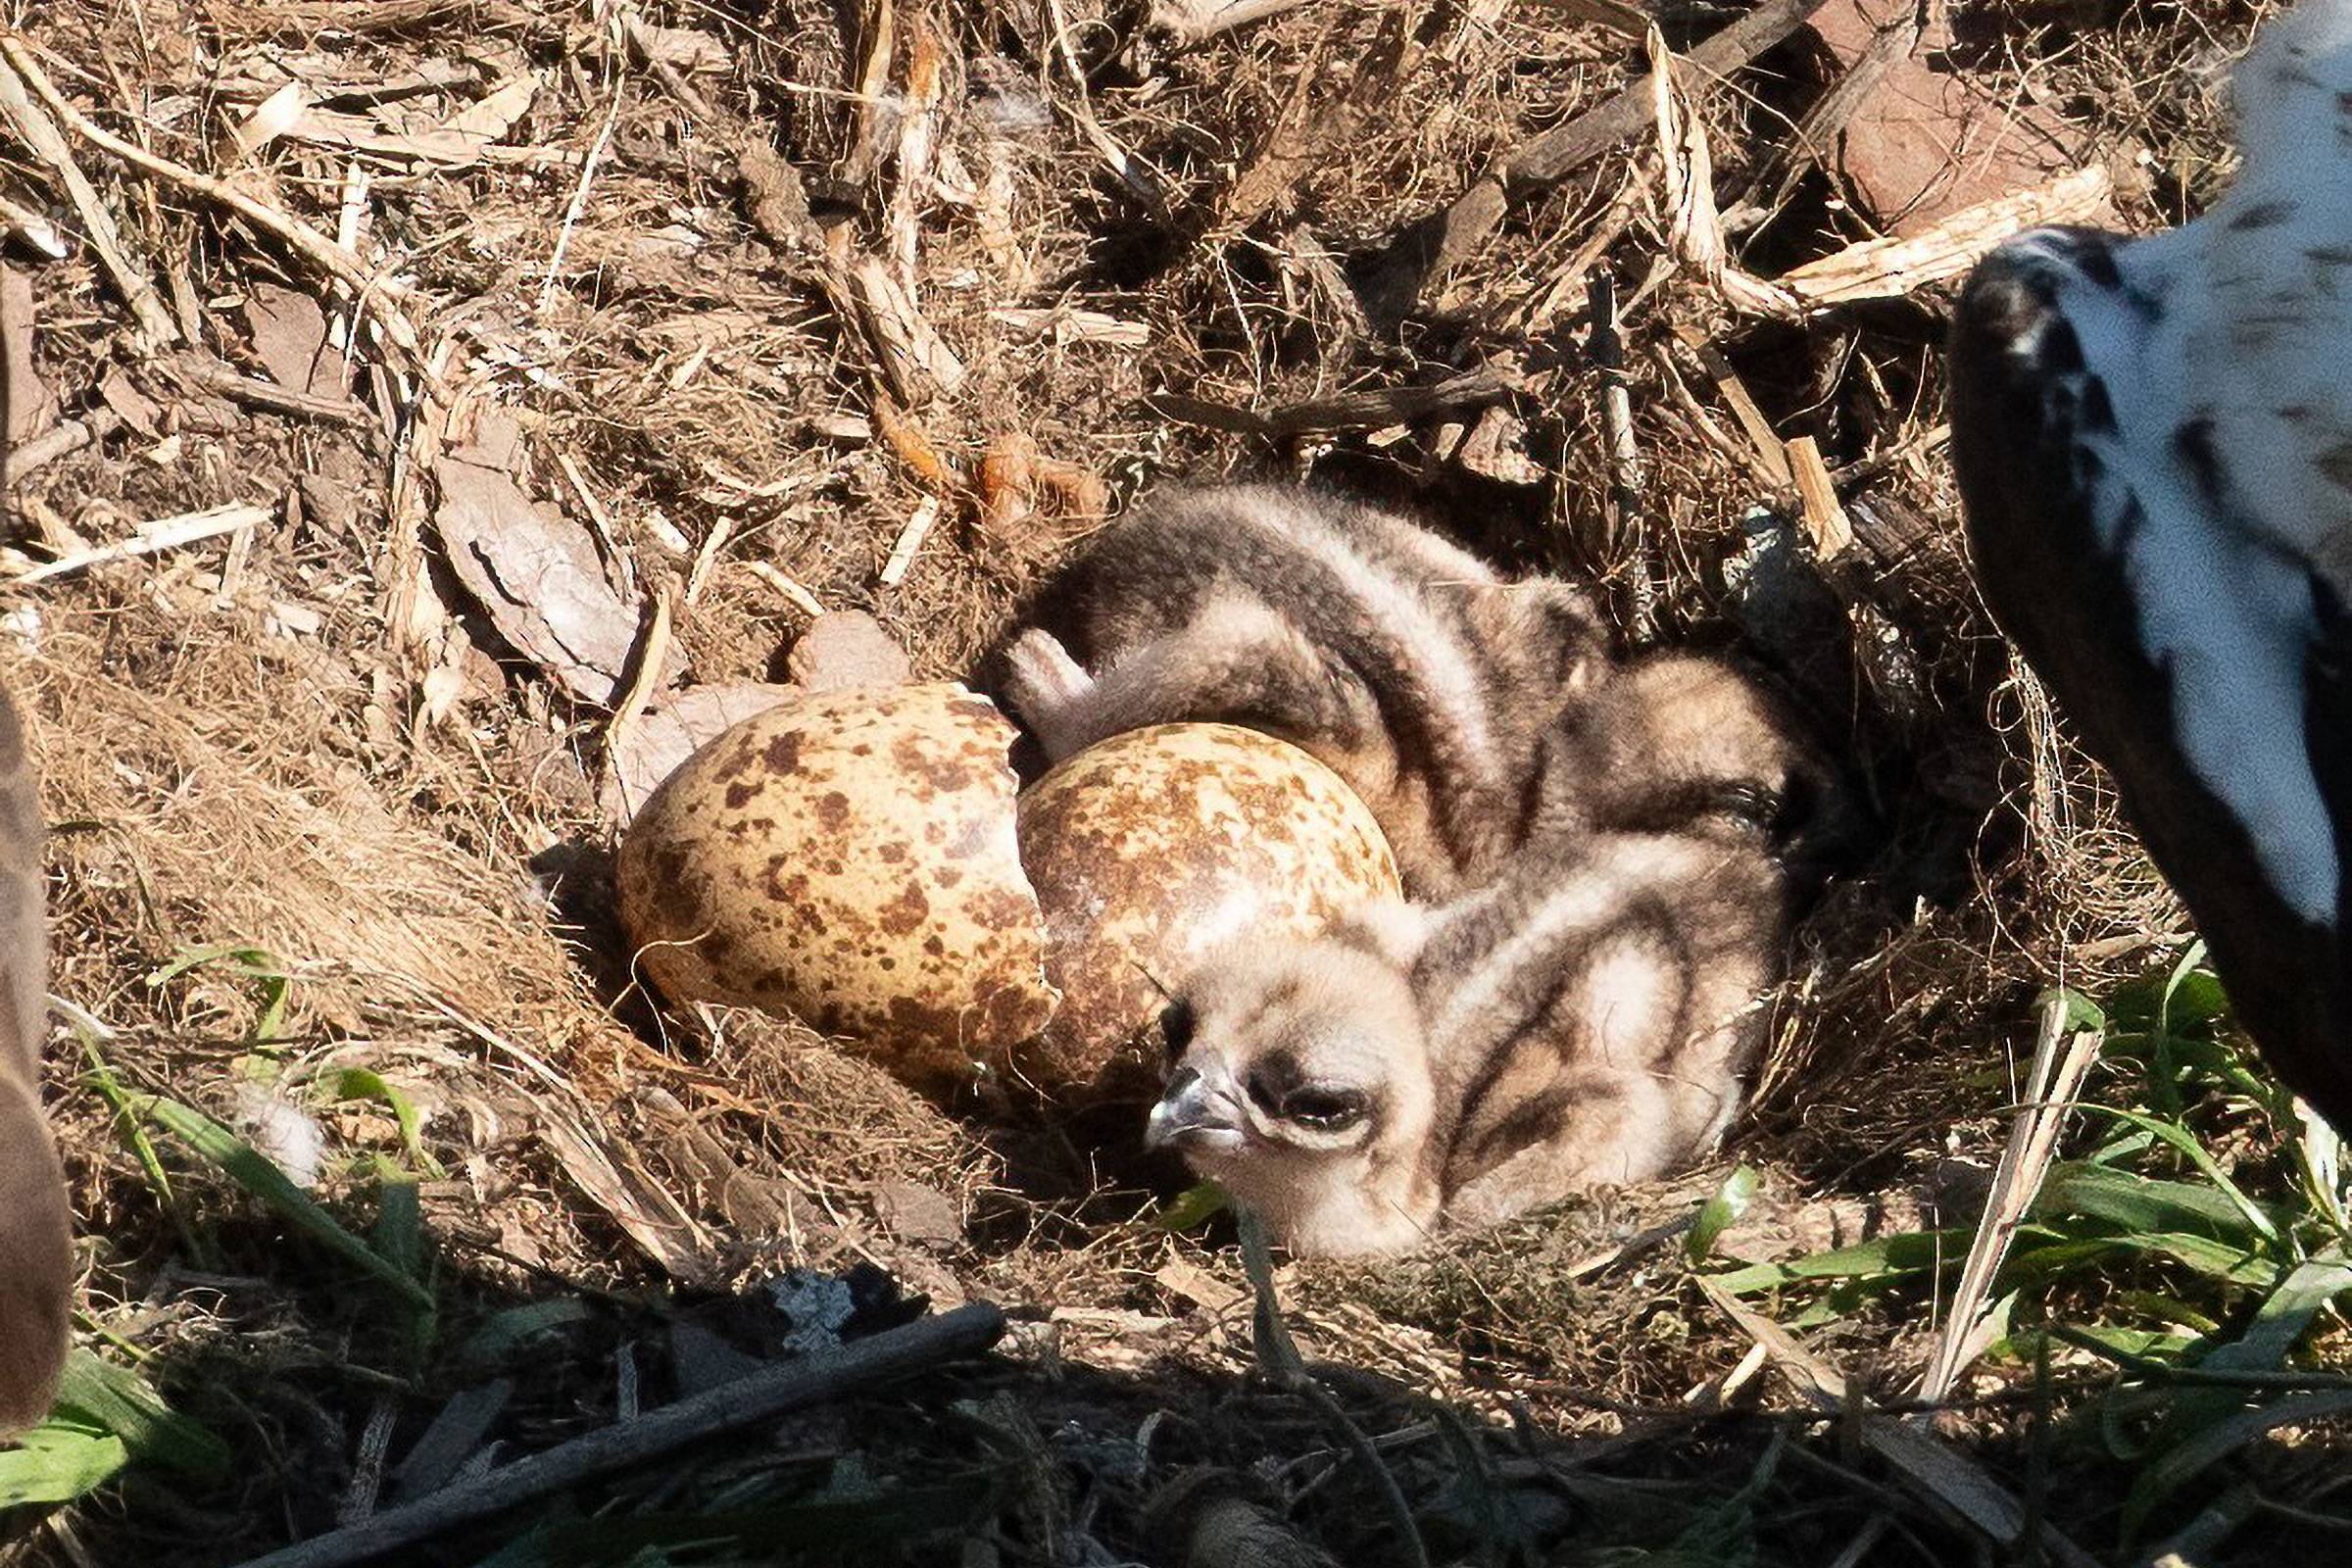
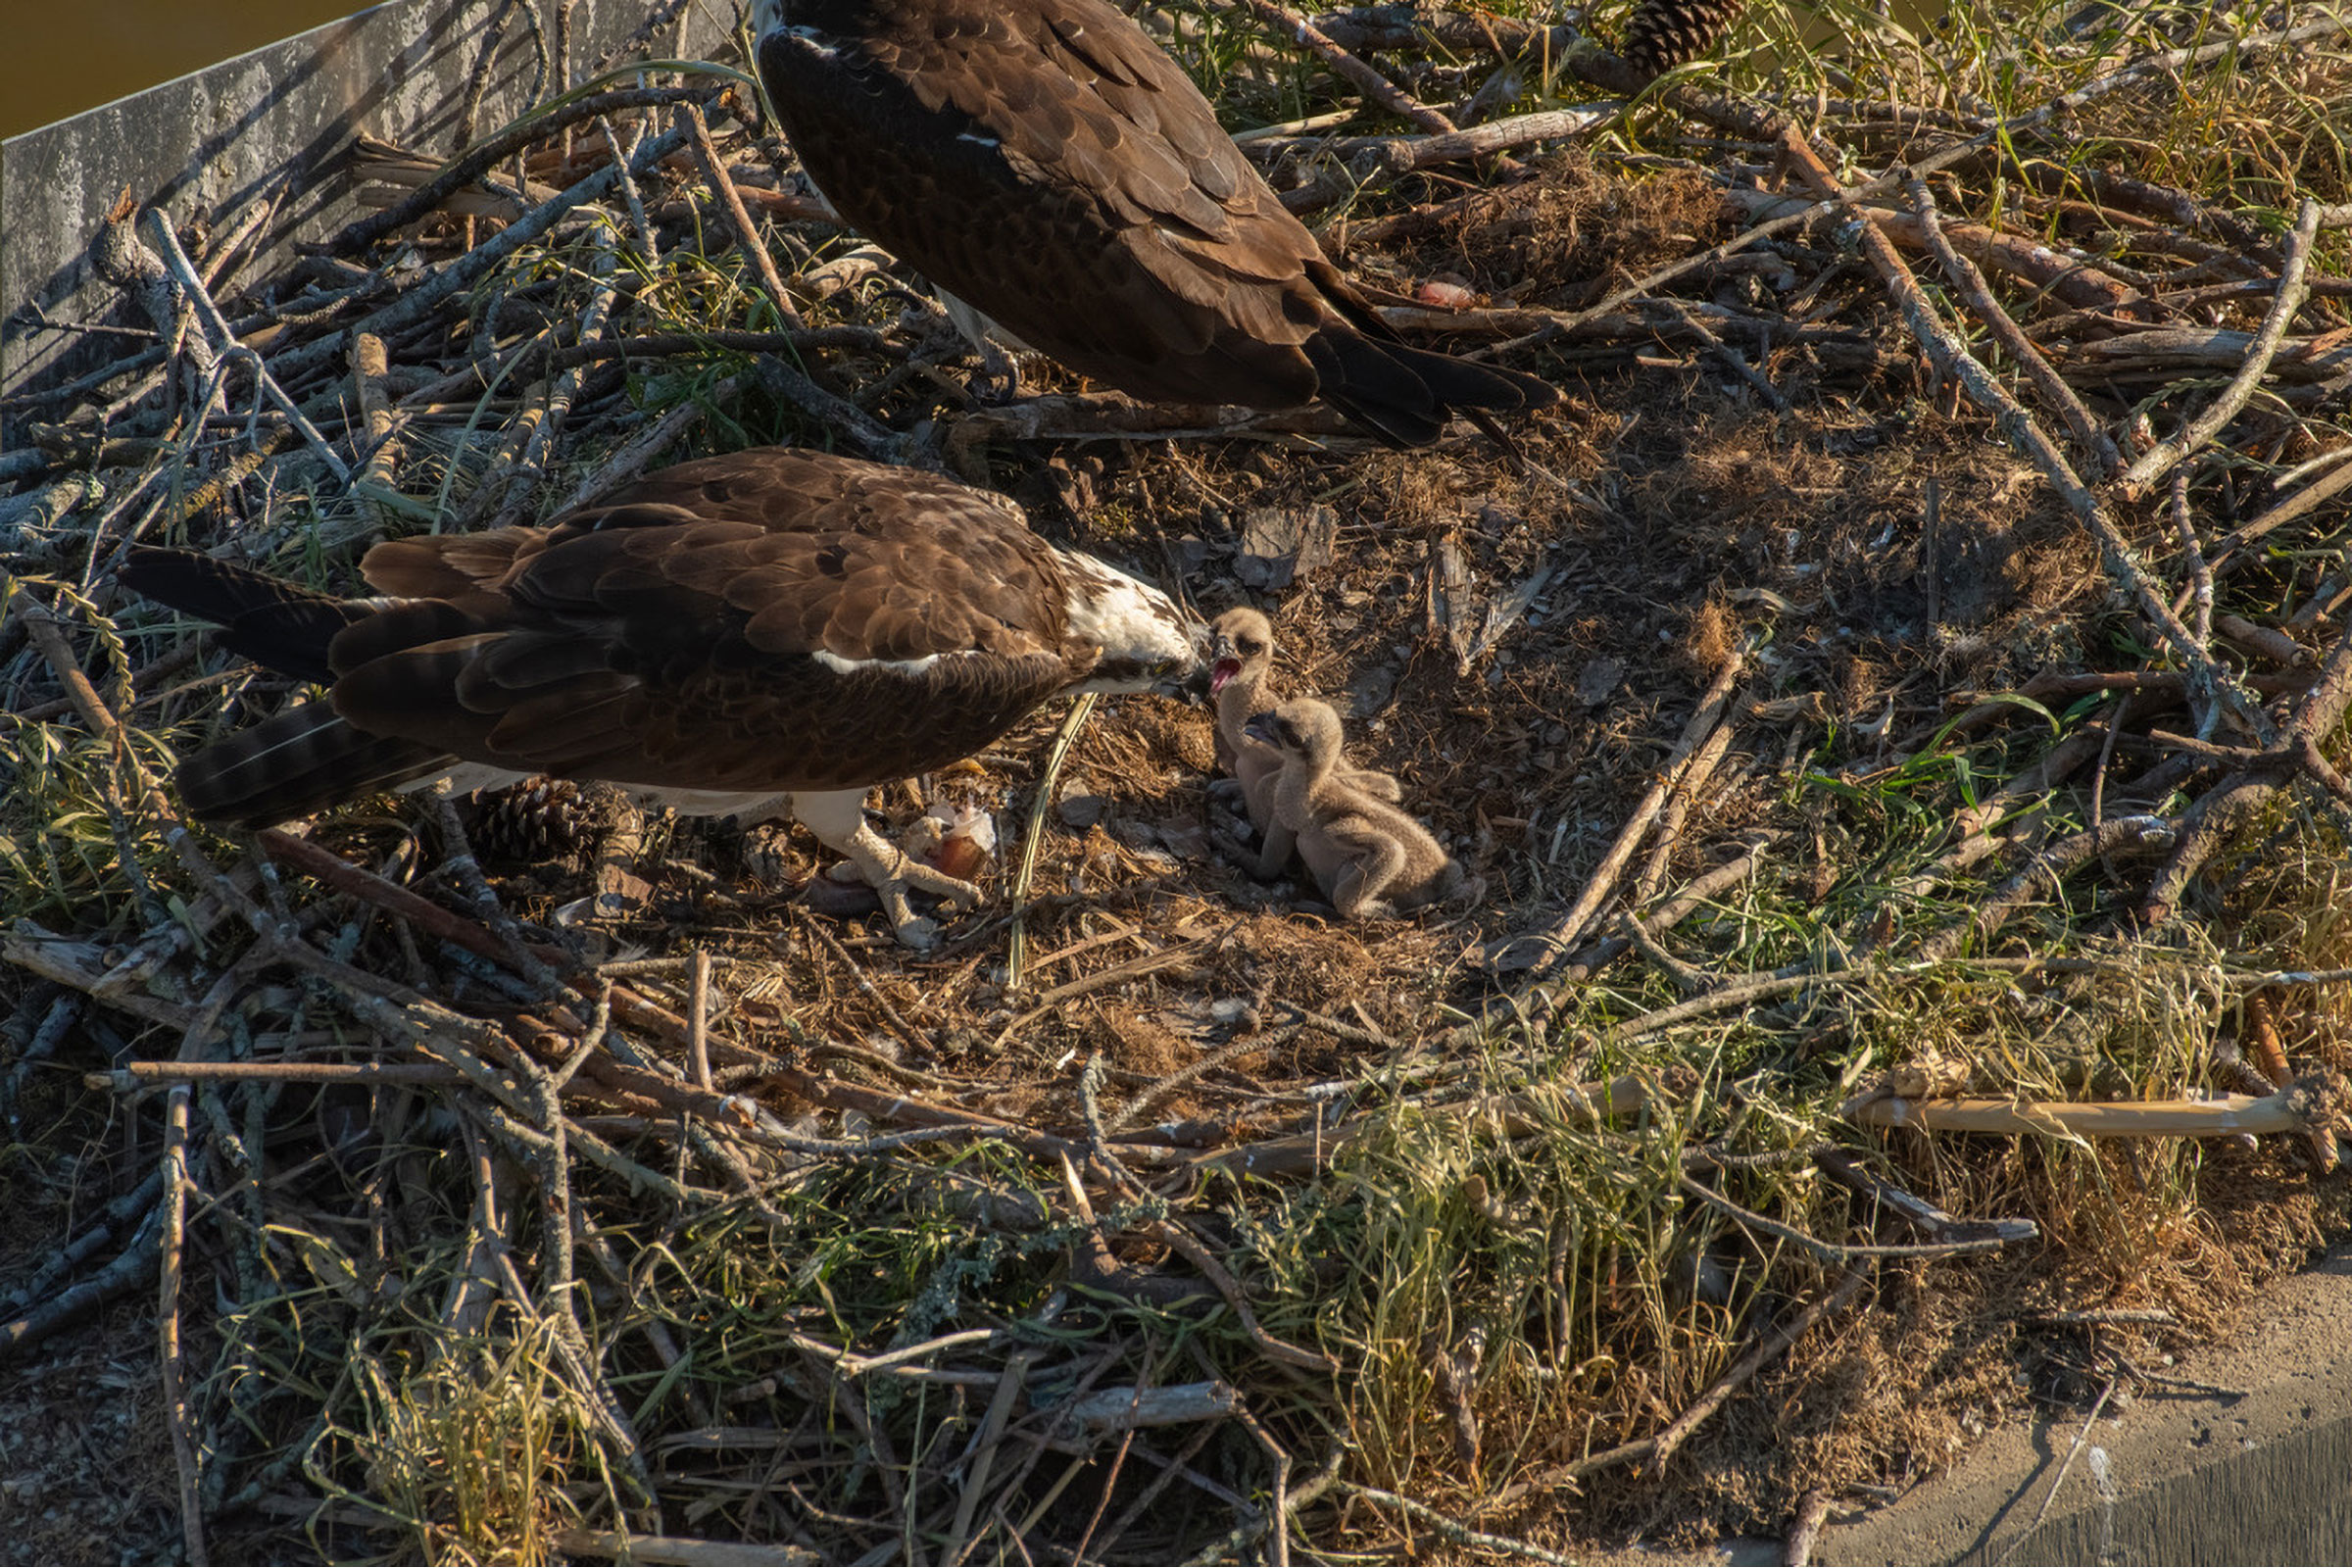
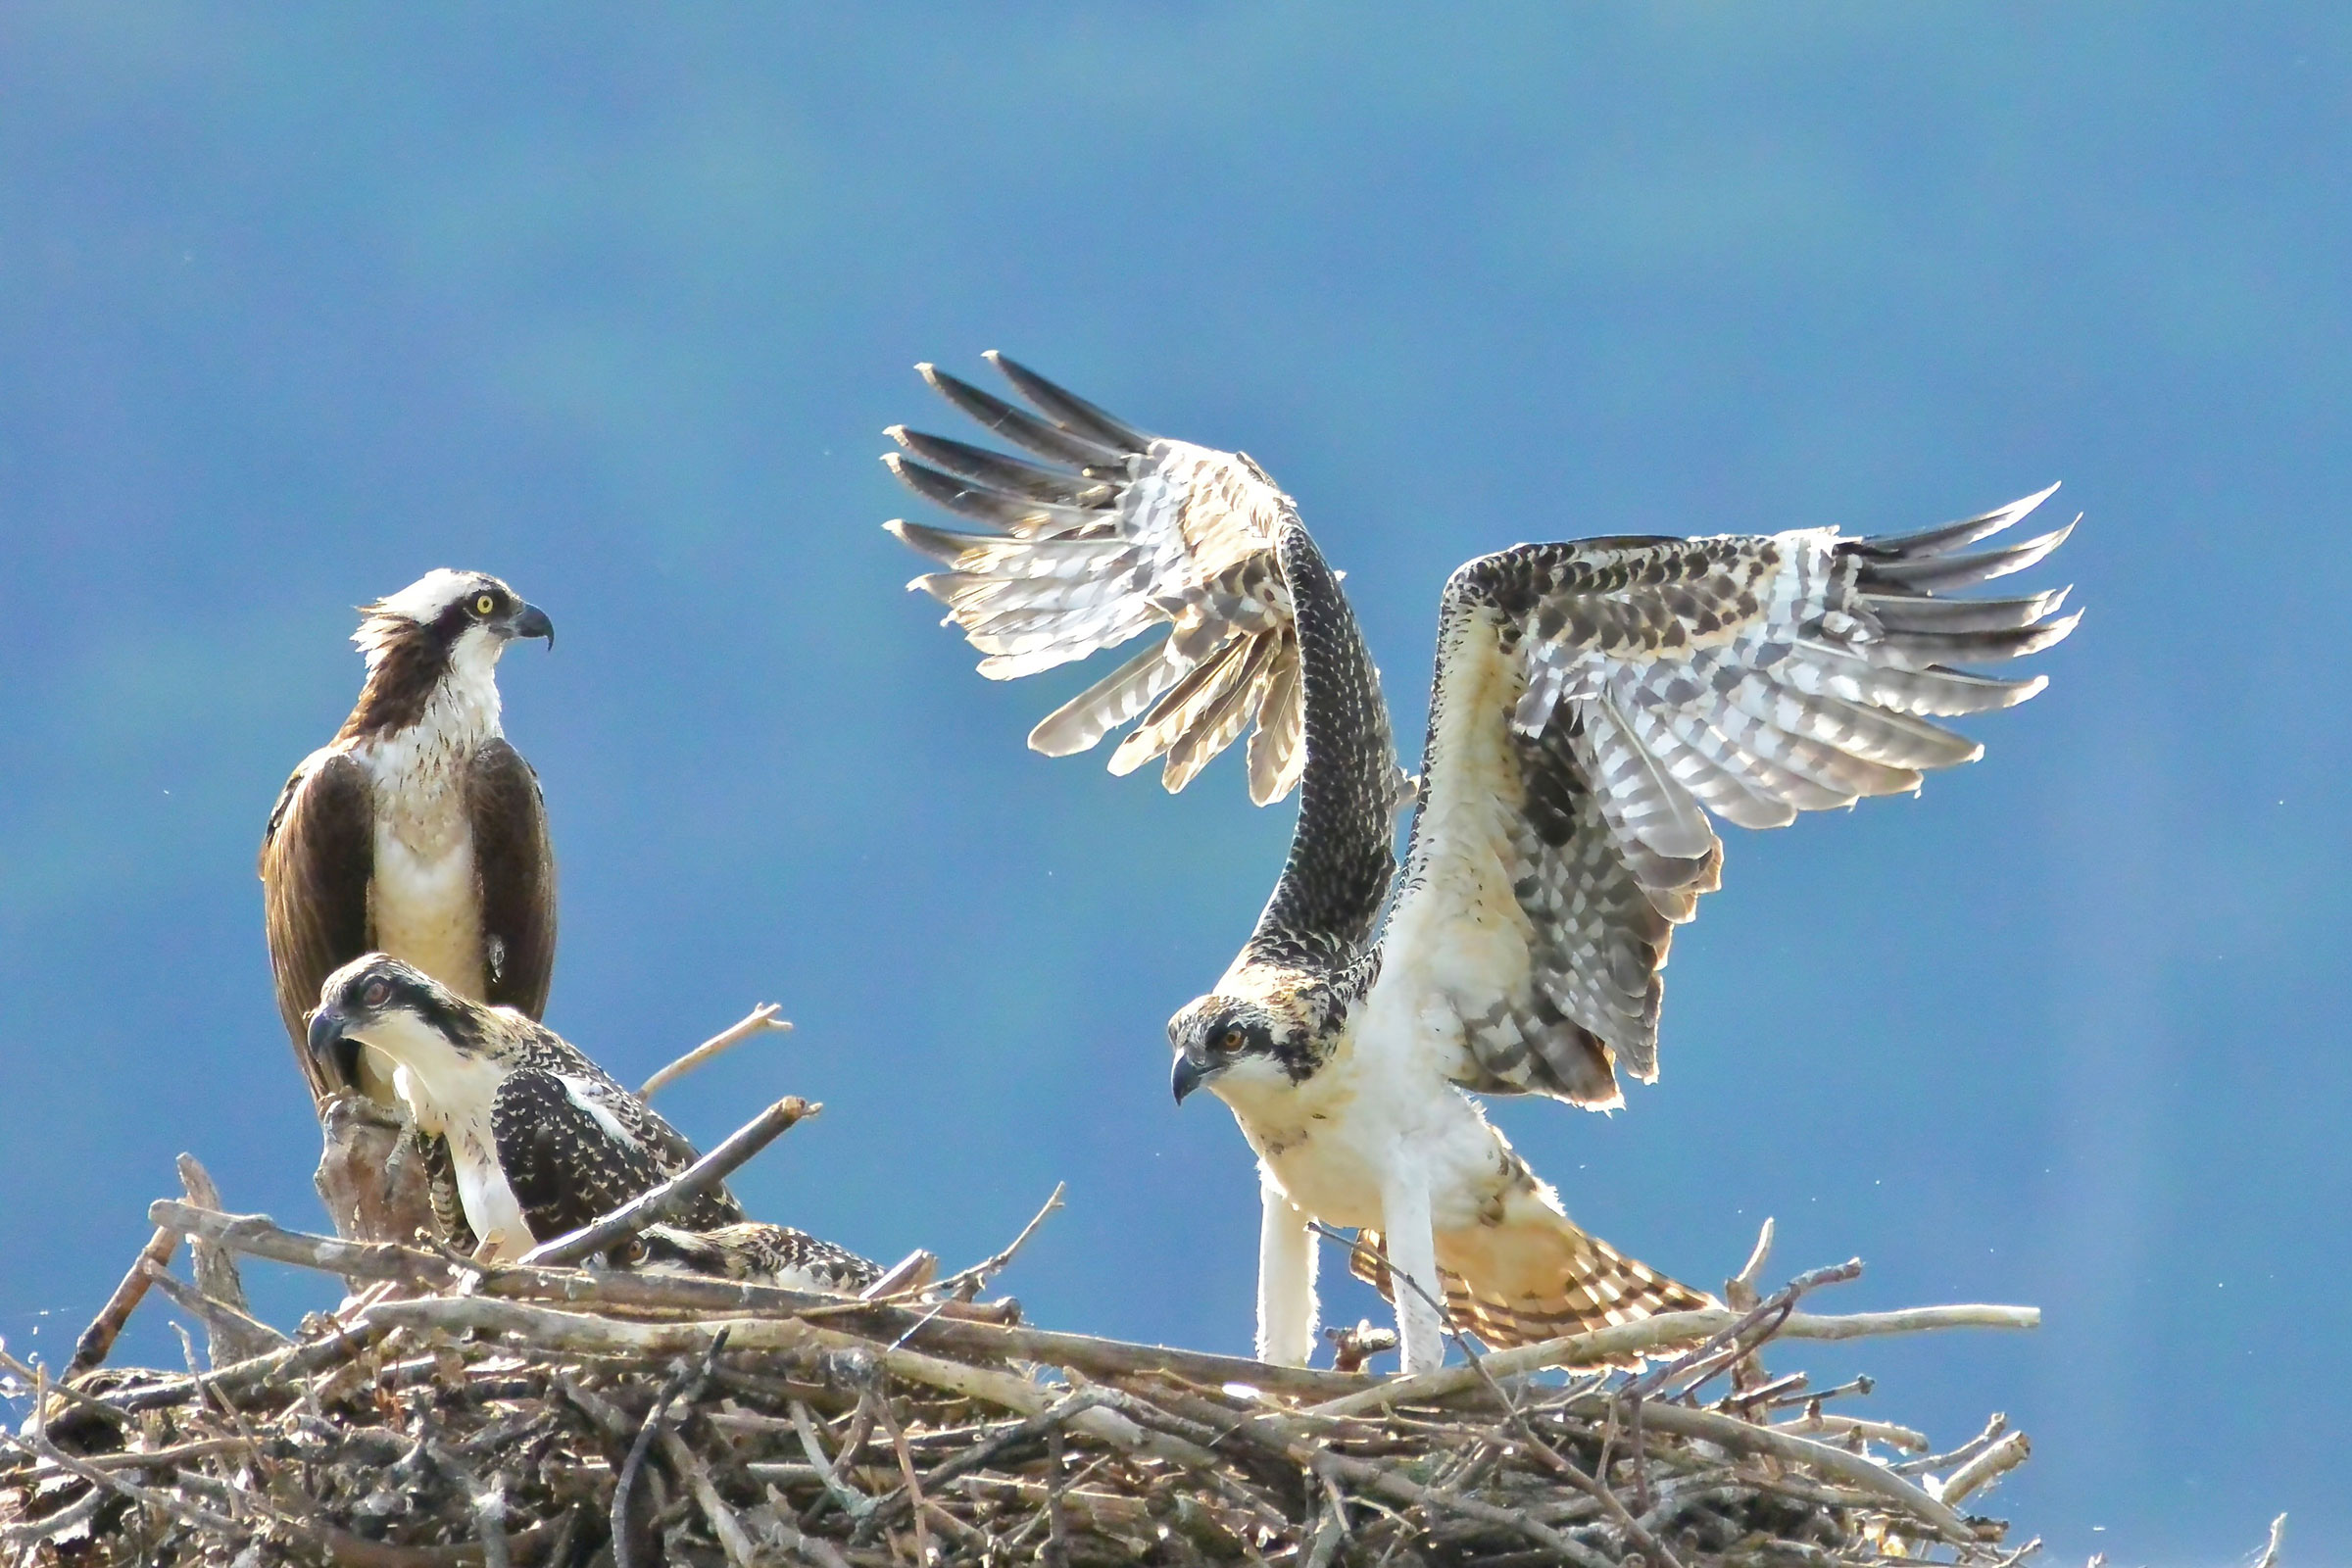
The earliest confirmed breeding behavior was recorded in late February when occupied nests were observed. This behavior was also the most frequently recorded throughout the season, as their large stick nests are easily observed. Another commonly documented behavior was nests with young (May 10 – August 30). For more general information on the breeding habits of the Osprey, please refer to All About Birds.

Figure 4: Osprey breeding observations from the Second Atlas (2016–2020). The colored boxes illustrate Atlas blocks (approximately 10 mi2 [26 km2] survey units) where the species was detected. The colors show the highest breeding category recorded in a block. The numbers within the colors in the legend correspond to the number of blocks with that breeding evidence category.
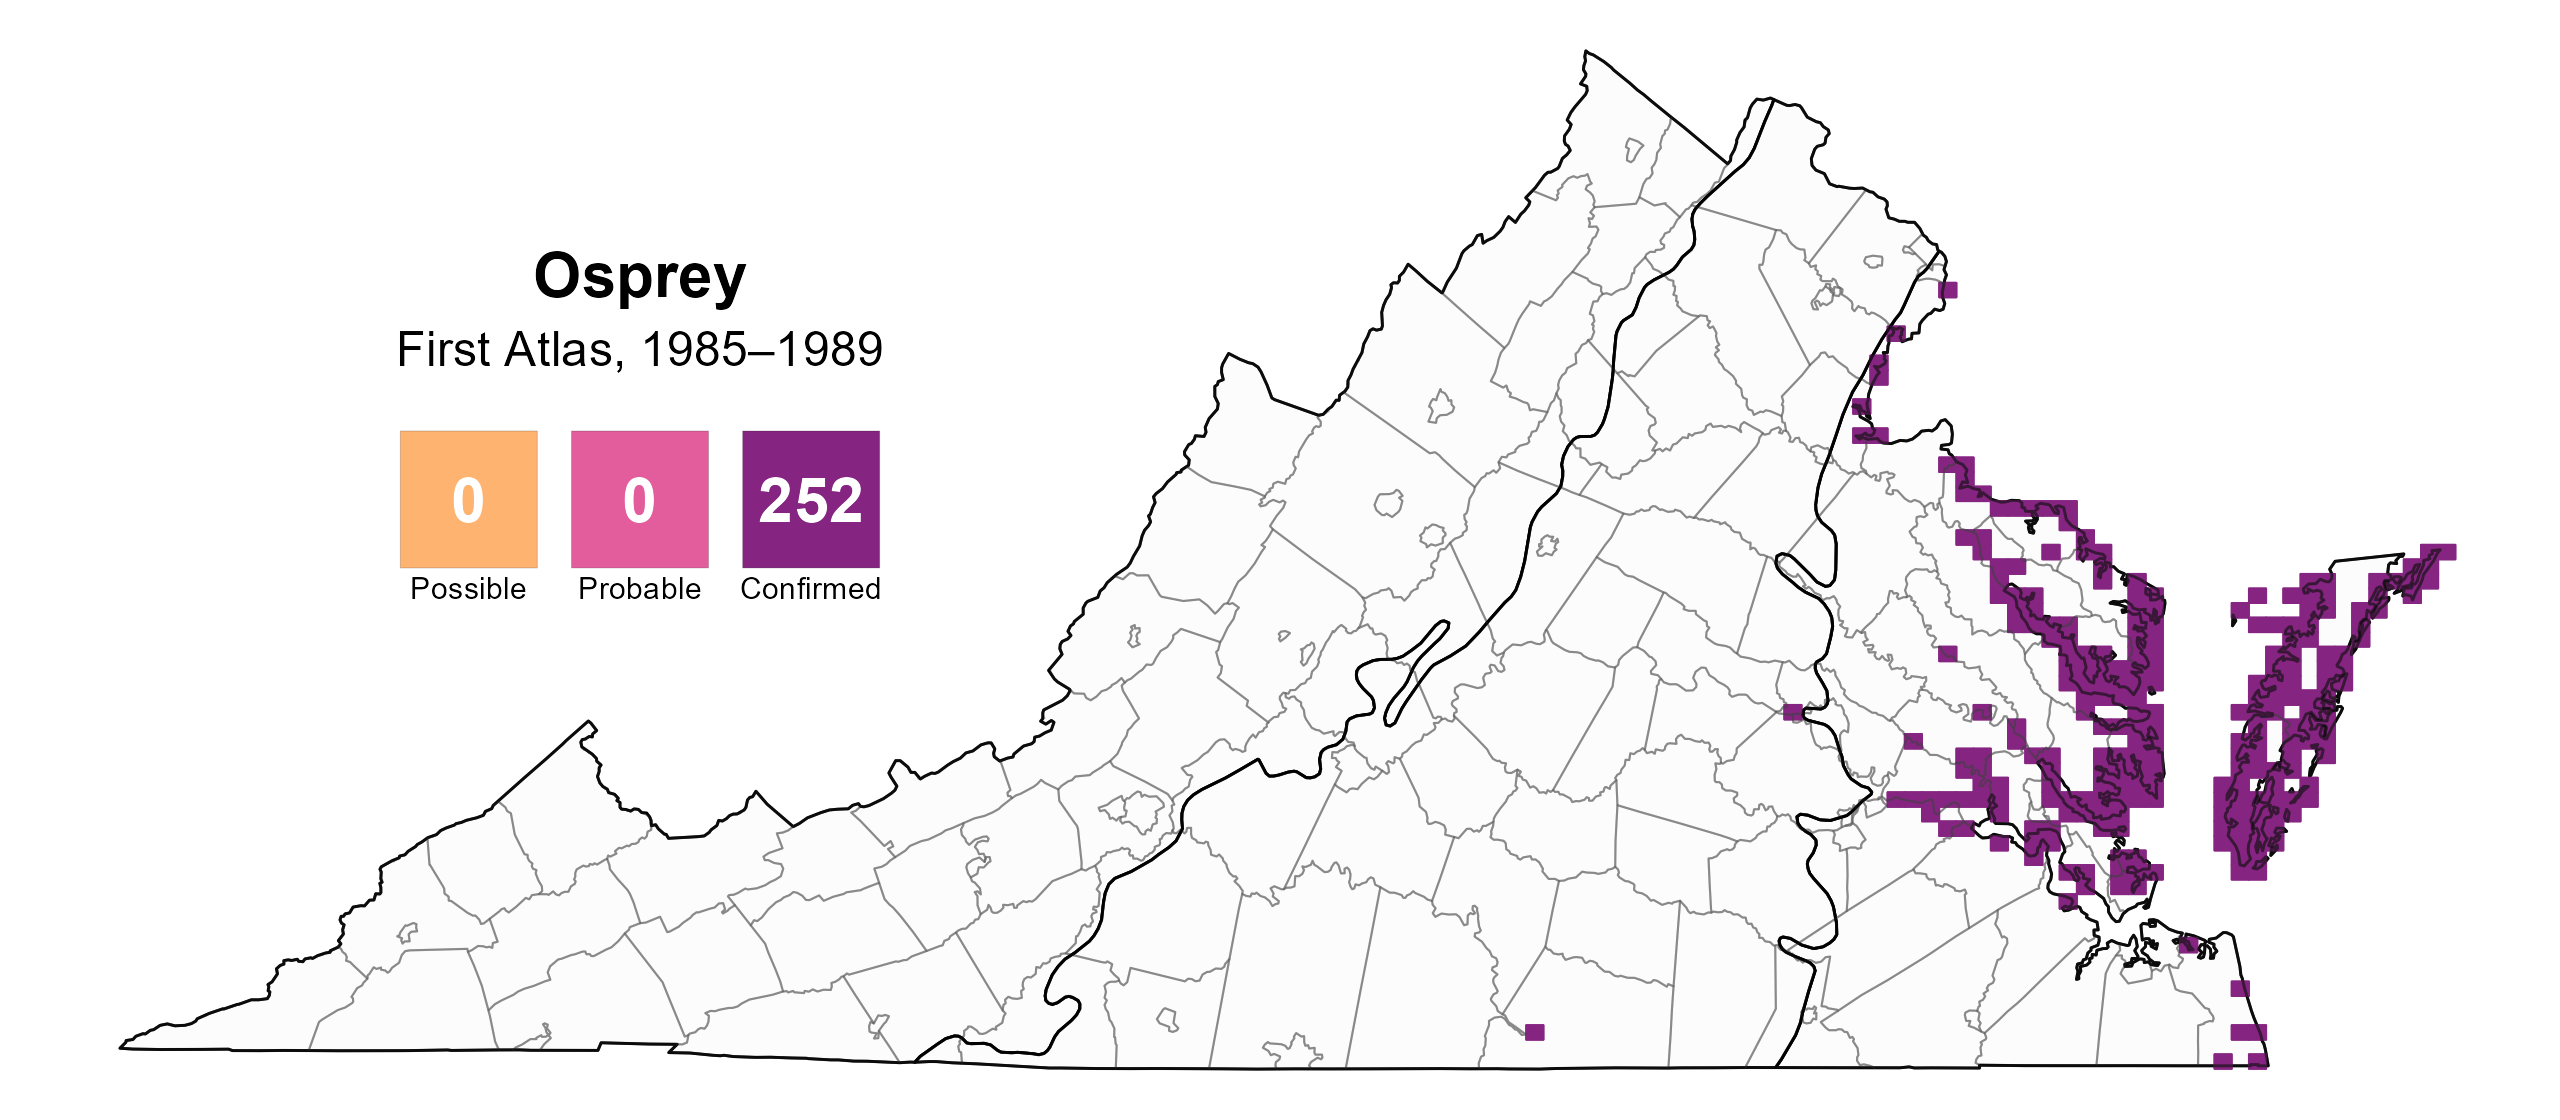
Figure 5: Osprey breeding observations from the First Atlas (1985–1989). The colored boxes illustrate Atlas blocks (approximately 10 mi2 [26 km2] survey units) where the species was detected. The colors show the highest breeding category recorded in a block. The numbers within the colors in the legend correspond to the number of blocks with that breeding evidence category.

Figure 6: Osprey phenology: confirmed breeding codes. This graph shows a timeline of confirmed breeding behaviors. Tick marks represent individual observations of the behavior.
Population Status
Osprey relative abundance was estimated to be highest in the Coastal Plain region, especially along the major rivers and on the eastern edge of the Eastern Shore, while it was estimated to be moderate in the northern portion of the central Piedmont region (Figure 7).
The total estimated Osprey population in the state is approximately 41,000 individuals (with a range between 12,000 and 143,000). Based North American Breeding Bird Survey (BBS) trend data for the Atlantic Flyway, as the BBS data do not produce a credible trend for Virginia, the Osprey population increased by a significant 2.5% annually from 1966–2022 (Hostetler et al. 2023; Figure 8). Between Atlases, BBS data showed a similar significant increase of 2.56% per year from 1987–2018 for the same region.
Additionally, there were an estimated 8,000 to 10,000 breeding pairs in the Chesapeake Bay region by 2020, making it one of the largest breeding populations of Osprey in the world (Watts and Paxton 2007; Watts et al. 2023).
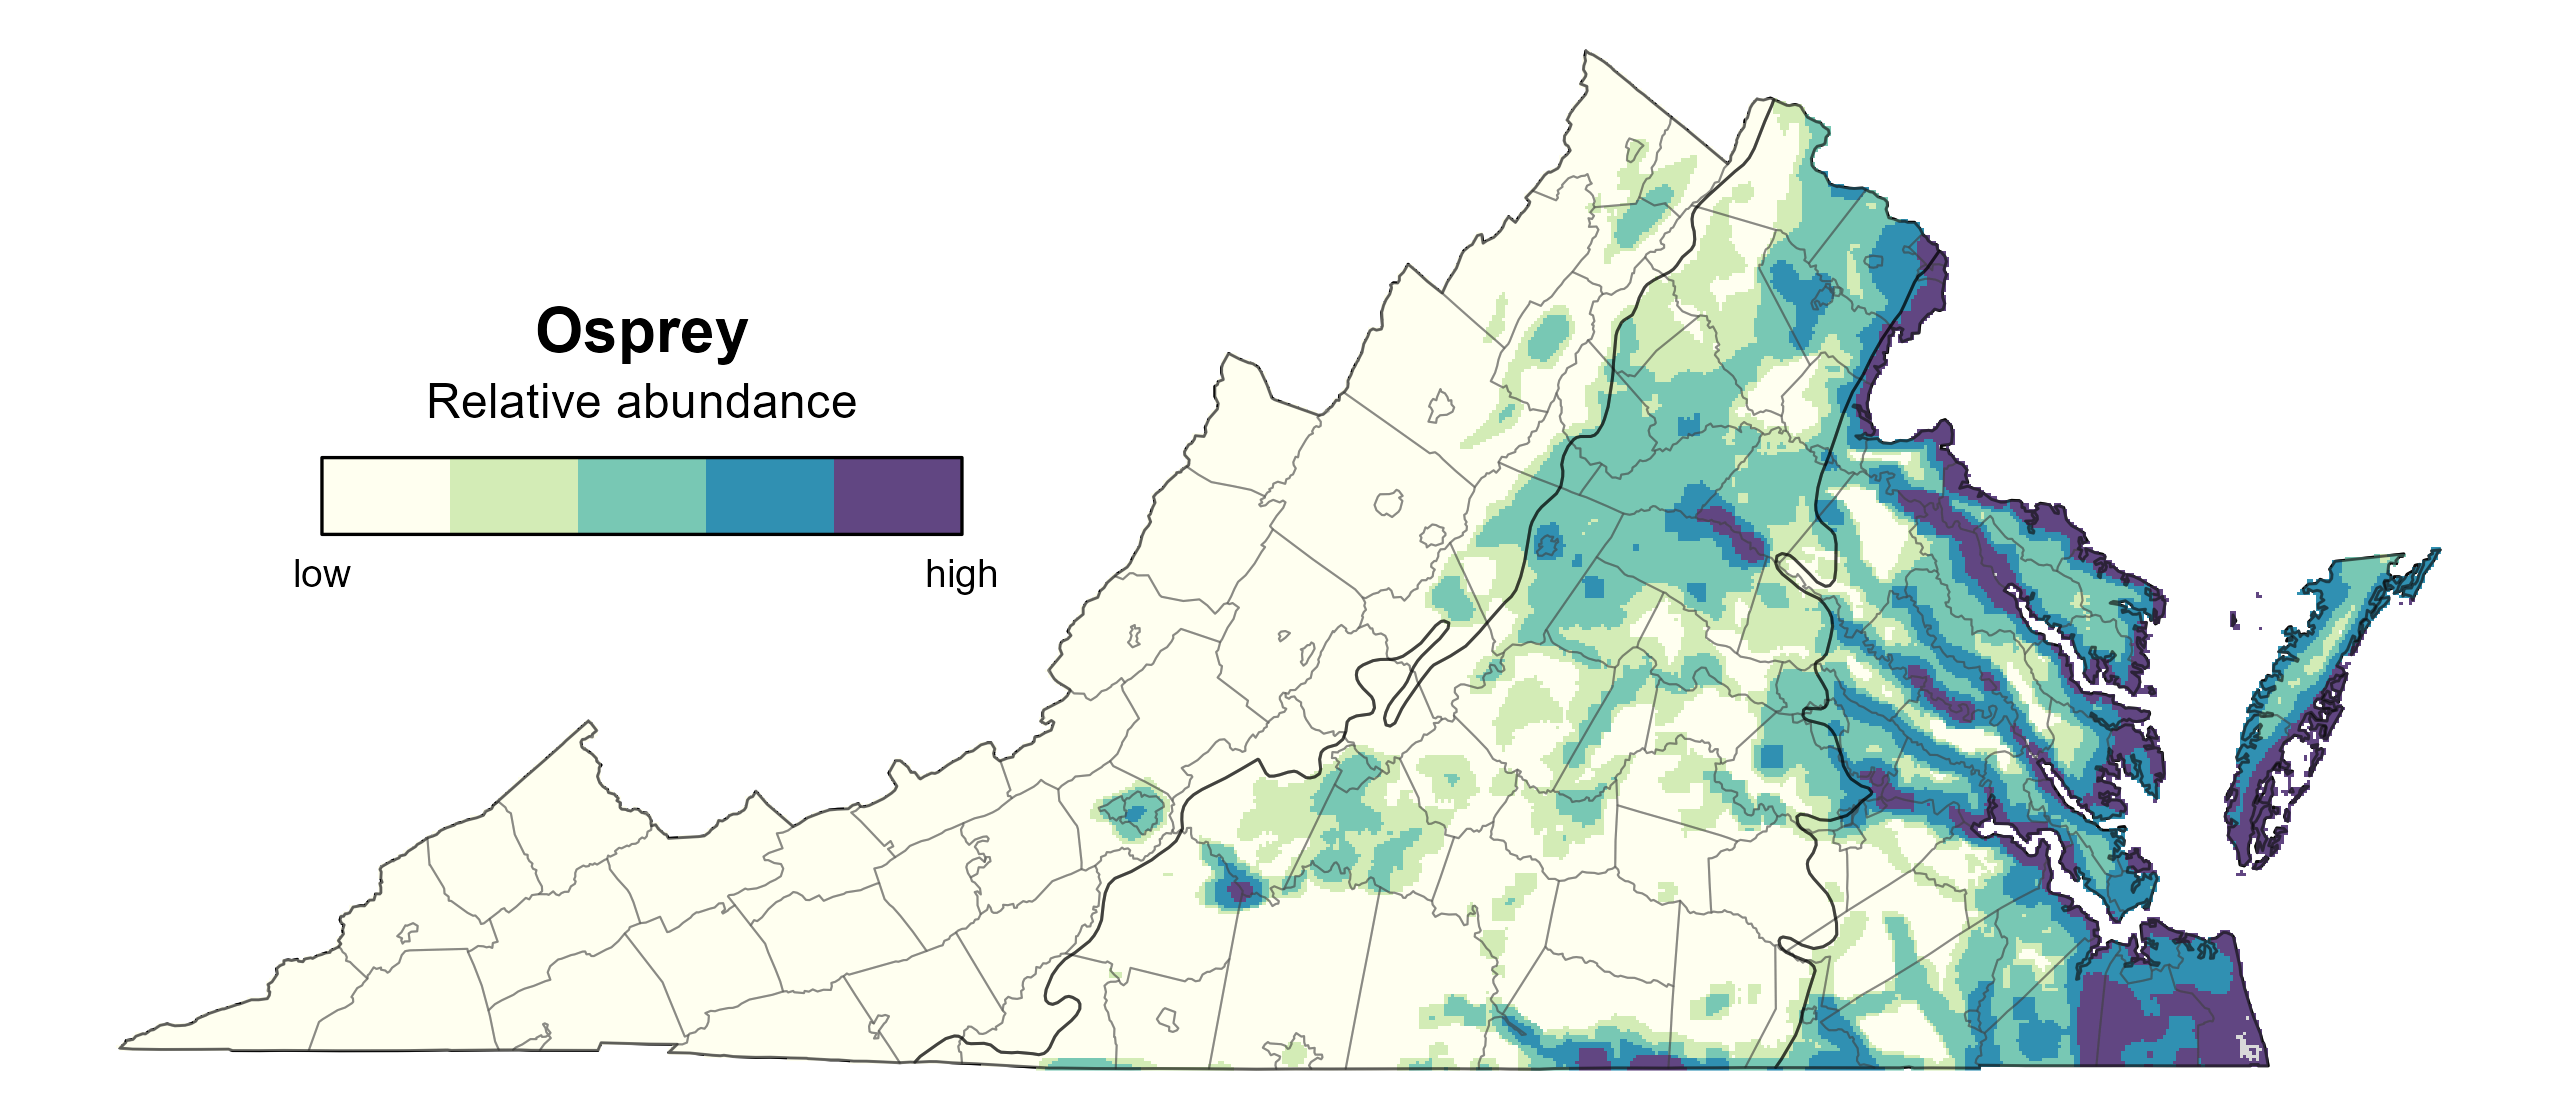
Figure 7: Osprey relative abundance (Second Atlas, 2016–2020). This map indicates the predicted abundance of this species at a 0.4 mi2 (1 km2) scale based on environmental (including habitat) factors. Abundance values are presented on a relative scale of low to high.

Figure 8: Osprey population trend for the Atlantic Flyway as estimated by the North American Breeding Bird Survey. The vertical axis shows species abundance; the horizontal axis shows the year. The solid line indicates the estimated population trend; there is a 97.5% probability that the true population trend falls between the dashed lines. The shaded bars indicate the First and Second Atlas periods.
Conservation
As is the case for the Bald Eagle (Haliaeetus leucocephalus), which uses similar habitats, the population growth of Osprey in Virginia has stabilized in recent years, likely owing to habitat saturation. However, there may be additional factors playing a role. In 2023, the Center for Conservation Biology at the College of William and Mary documented the highest nest failure rate ever observed in the lower Chesapeake Bay as only 10% of 167 nests monitored during the season produced young (CCB 2023). Researchers believe that high rates of nest failure in this high-salinity area of the Bay are being driven by lack of access to Atlantic menhaden (Brevoortia tyrannus) (Academia and Watts 2023; Watts et al. 2024). Menhaden and other small schooling fish, such as sardines and anchovies, are responsible for the transfer of energy from plankton to higher-level predators, such as Osprey (Watts et al. 2024). When forage fish are not available, the food web could possibly be disrupted, and higher-level predators may suffer (Watts et al. 2024).
The Bay study was expanded in 2024 and again in 2025 to include a larger sample of sites (encompassing 1,025 pairs) distributed across the salinity gradient from salt to tidal fresh waters. Breeding output varied with salinity, with saltier areas collectively averaging 0.33 young per pair vs. freshwater areas averaging 1.0 young per pair (CCB 2025). Loss of young to starvation was the largest contributing factor, although in 2025 a large number of pairs did not lay eggs and weather events also caused nest losses throughout the region (CCB 2025). The implication of these findings is that should current patterns persist, Osprey populations in the higher salinity areas of the Chesapeake Bay will continue to see declines while those in the freshwater areas may continue to increase (CCB 2025).
Interactive Map
The interactive map contains up to six Atlas layers (probability of occurrence for the First and Second Atlases, change in probability of occurrence between Atlases, breeding evidence for the First and Second Atlases, and abundance for the Second Atlas) that can be viewed one at a time. To view an Atlas map layer, mouse over the layer box in the upper left. County lines and physiographic regional boundaries (Mountains and Valleys, Piedmont, and Coastal Plain) can be turned on and off by checking or unchecking the box below the layer box. Within the map window, users can hover on a block to see its value for each layer and pan and zoom to see roads, towns, and other features of interest that are visible beneath a selected layer.
View Interactive Map in Full Screen
References
Academia, M. H, and B. D. Watts (2023). Food supplementation increases reproductive performance of ospreys in the lower Chesapeake Bay. Frontiers in Marine Science 10:1172787. https://doi.org/10.3389/fmars.2023.1172787.
Bierregaard, R. O., A. F. Poole, M. S. Martell, P. Pyle, and M. A. Patten (2020). Osprey (Pandion haliaetus), version 1.0. In Birds of the World (P. G. Rodewald, Editor). Cornell Lab of Ornithology, Ithaca, NY, USA. https://doi.org/10.2173/bow.osprey.01.
Center for Conservation Biology (CCB). (2023). The Center for Conservation Biology documents unprecedented Osprey nest failures within the Lower Chesapeake Bay. https://ccbbirds.org/2023/07/14/the-center-for-conservation-biology-documents-unprecedented-osprey-nest-failures-within-the-lower-chesapeake-bay/.
Center for Conservation Biology (CCB). (2025). Deficit in breeding performance expands for Chesapeake Bay ospreys. https://ccbbirds.org/2025/10/01/deficit-in-breeding-performance-expands-for-chesapeake-bay-ospreys/.
Hostetler, J. A., J. R. Sauer, J. E. Hines, D. Ziolkowski, and M. Lutmerding (2023). The North American breeding bird survey, analysis results 1966–2022. U.S. Geological Survey, Laurel, MD, USA. https://doi.org/10.5066/P9SC7T11.
Watts, B. D., and B. J. Paxton (2007). Ospreys of the Chesapeake Bay: population recovery, ecological requirements, and current threats. Waterbirds 30:39–49. https://doi.org/10.1675/1524-4695(2007)030[0039:OOTCBP]2.0.CO;2.
Watts, B.D., C. H. Stinson, P. K. McLean, K. A. Glass, M. H. Academia, and M. A. Byrd (2024). Demographic response of osprey within the lower Chesapeake Bay to fluctuations in menhaden stock. Frontiers in Marine Science 10:1284462. https://doi.org/10.3389/fmars.2023.1284462.