Introduction
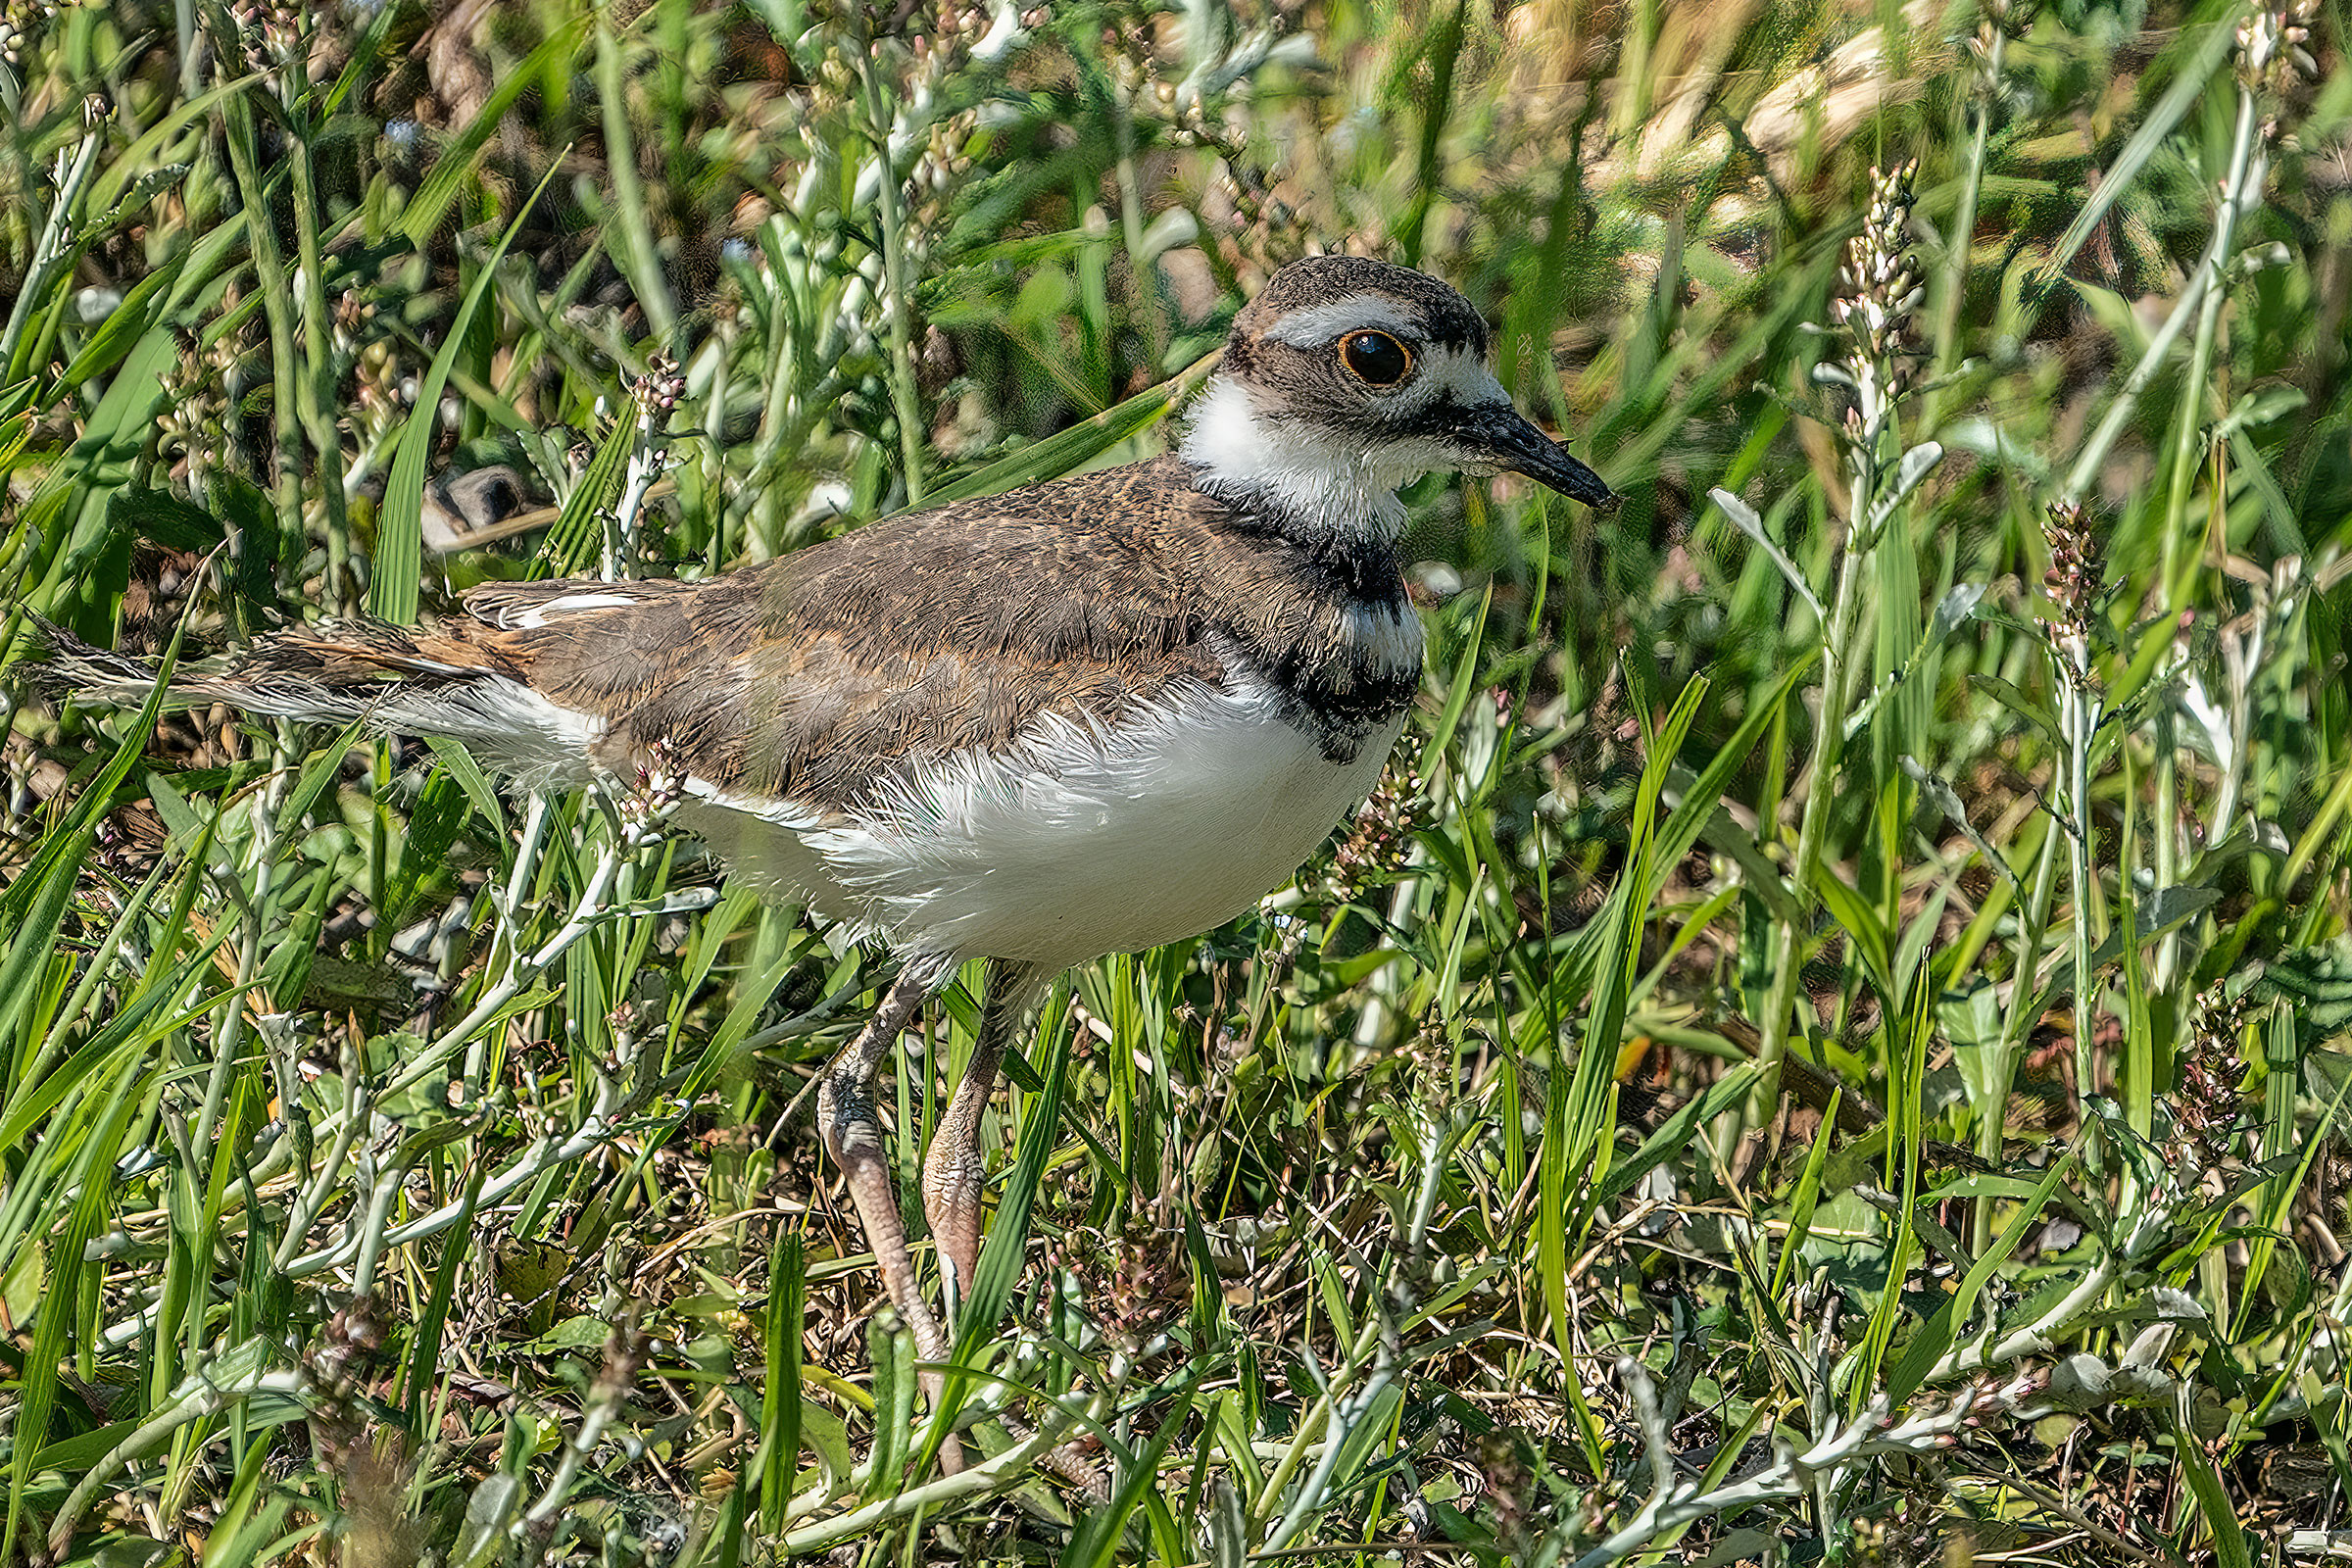
A ubiquitous bird on human-dominated landscapes, the Killdeer is a familiar sight across the Commonwealth. Its strident, anxious call is a common sound in habitats ranging from rural mudflats and pastures to urban sports fields and parking lots (Jackson and Jackson 2020). Although the Killdeer is present throughout the year, it is unclear what proportion of individuals are true residents versus visitors because this species is only partially migratory, and its movements are not well-understood (Jackson and Jackson 2020).
Breeding Distribution
Killdeer are found across much of the state but are most likely to occur in the Coastal Plain region and the Shenandoah Valley (Figure 1). Breeding typically occurs at lower elevations, which is most likely due to land cover needs. However, breeding also occurs in Highland County, which has the highest average elevation in the state but also extensive agricultural cover (Dewitz 2021). Thus, the lack of Killdeer breeding in the Blue Ridge Mountains and other mountainous areas is more likely due to land cover and land use than to purely elevation. In fact, in Virginia, the likely occurrence of this species in a block is positively associated with number of habitat types and amount of agricultural lands and negatively associated with forest cover.
Between Atlases (Figures 1 and 2), overall, there was not strong evidence for substantial change in the Killdeer’s likelihood of occurrence at the statewide level, but there were some potential areas with changes. In Northern Virginia, its probable occurrence decreased, possibly caused by the conversion of agricultural land to urban cover (Figure 3). Since the First Atlas, extensive development in the broader region of Northern Virginia has replaced many pastures (Slonecker et al. 2010). Other small areas of potential decrease occurred in the Mountains and Valleys region and around Richmond in the Piedmont region with possible scattered small areas of potential increases in occurrence in the Coastal Plain region.
View Environmental Associations
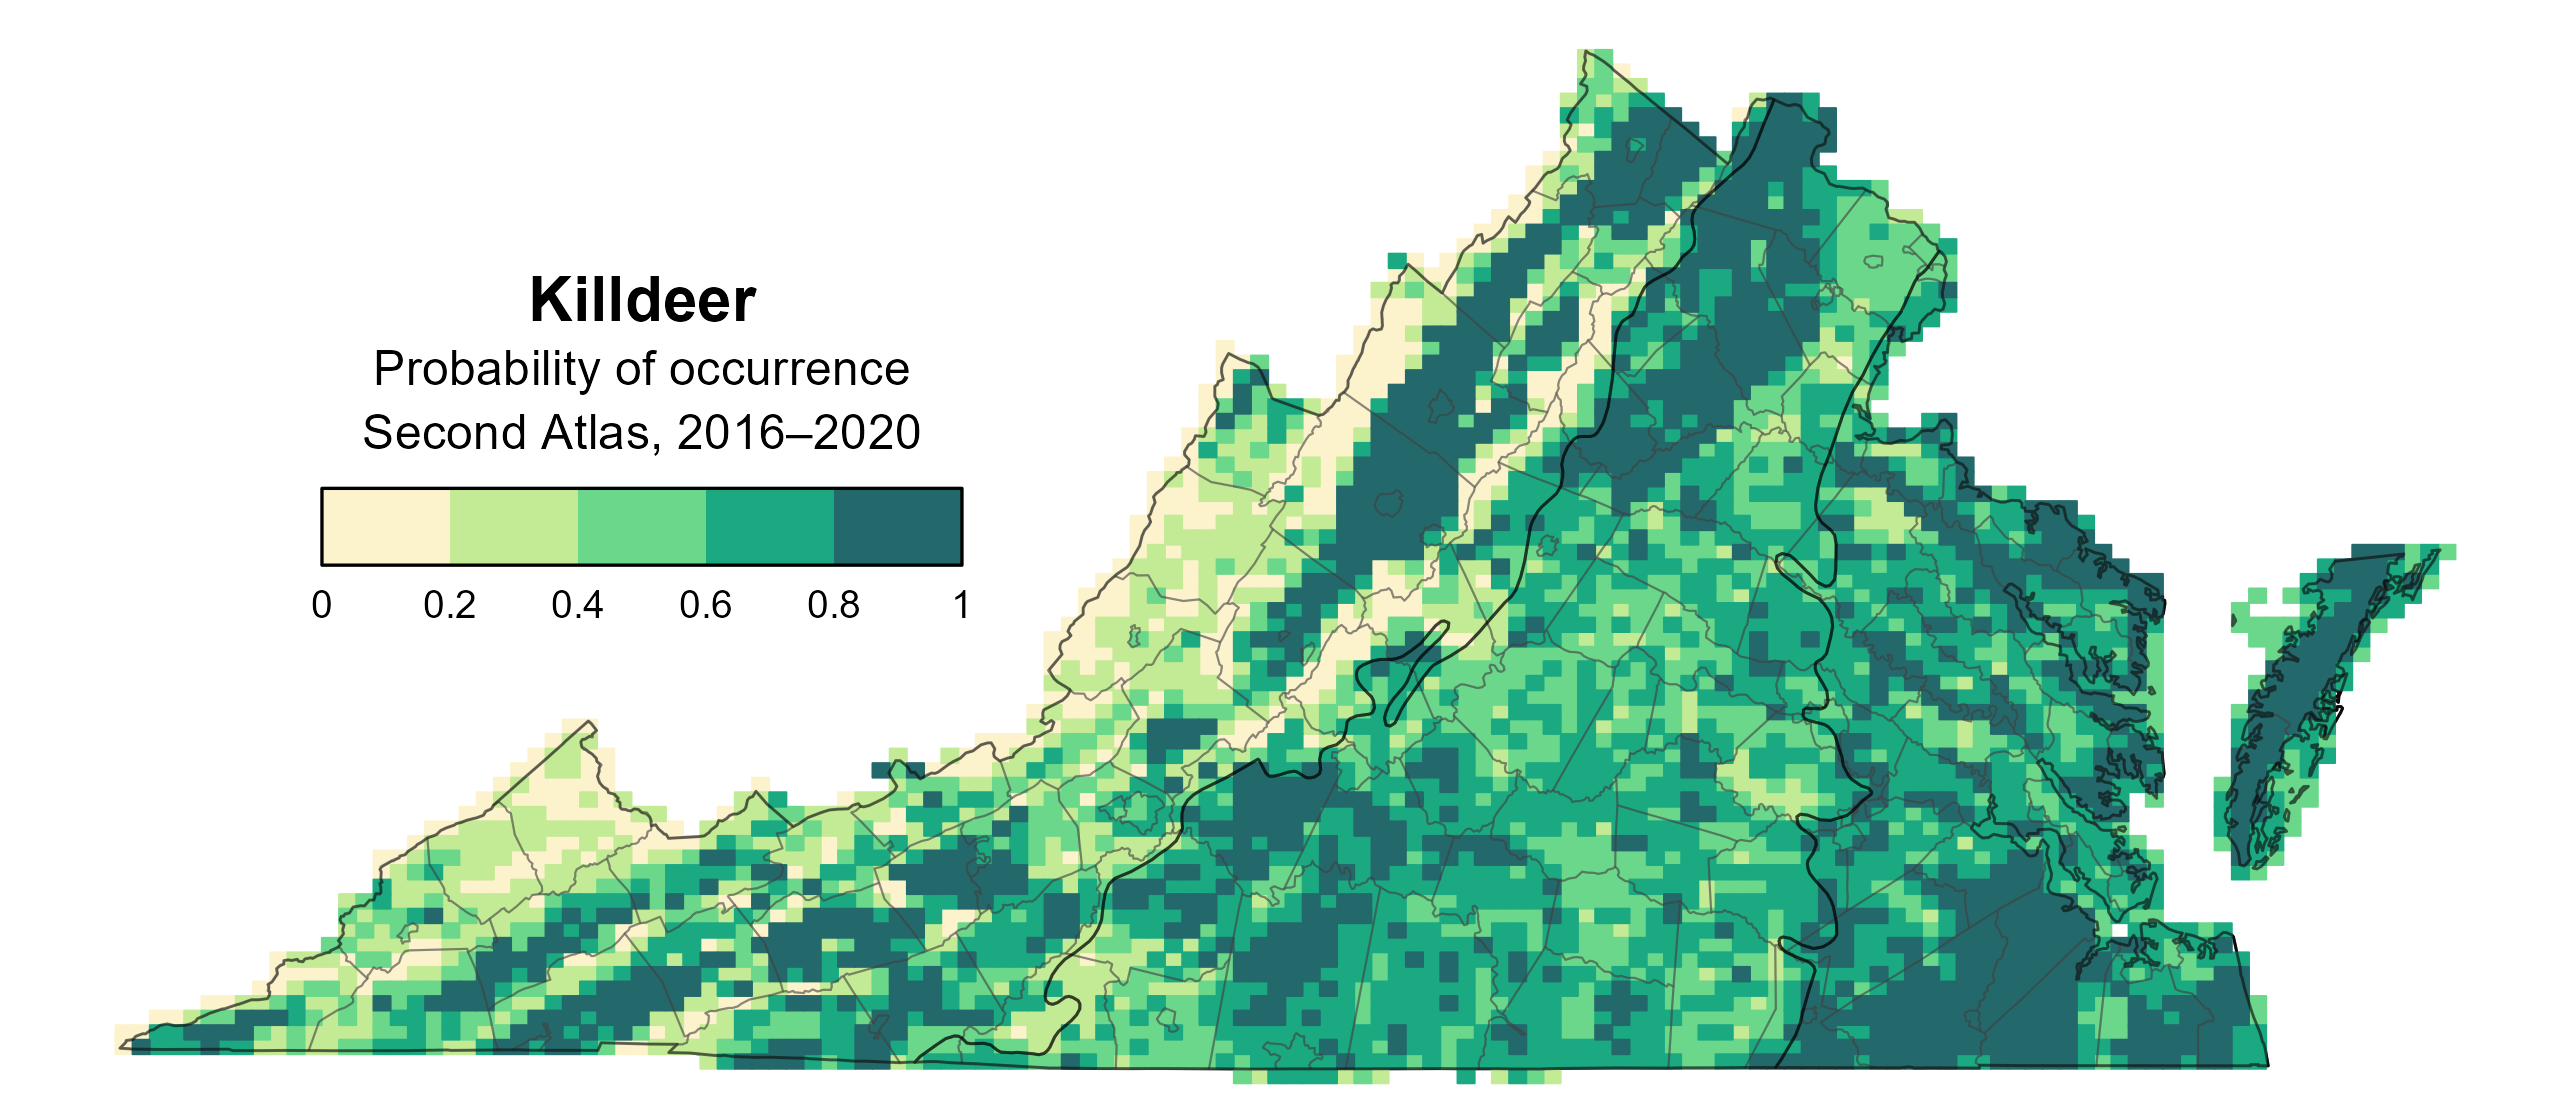
Figure 1: Killdeer breeding distribution based on probability of occurrence (Second Atlas, 2016–2020). This map indicates the probability that this species will occur in an Atlas block (an approximately 10 mi2 [26 km2] survey unit) based on environmental (including habitat) factors and after adjusting for the probability of detection (variation in survey effort among blocks).

Figure 2: Killdeer breeding distribution based on probability of occurrence (First Atlas, 1985–1989). This map indicates the probability that this species will occur in an Atlas block (an approximately 10 mi2 [26 km2] survey unit) based on environmental (including habitat) factors and after adjusting for the probability of detection (variation in survey effort among blocks). Blocks in white were not surveyed during the First Atlas and were not modeled.
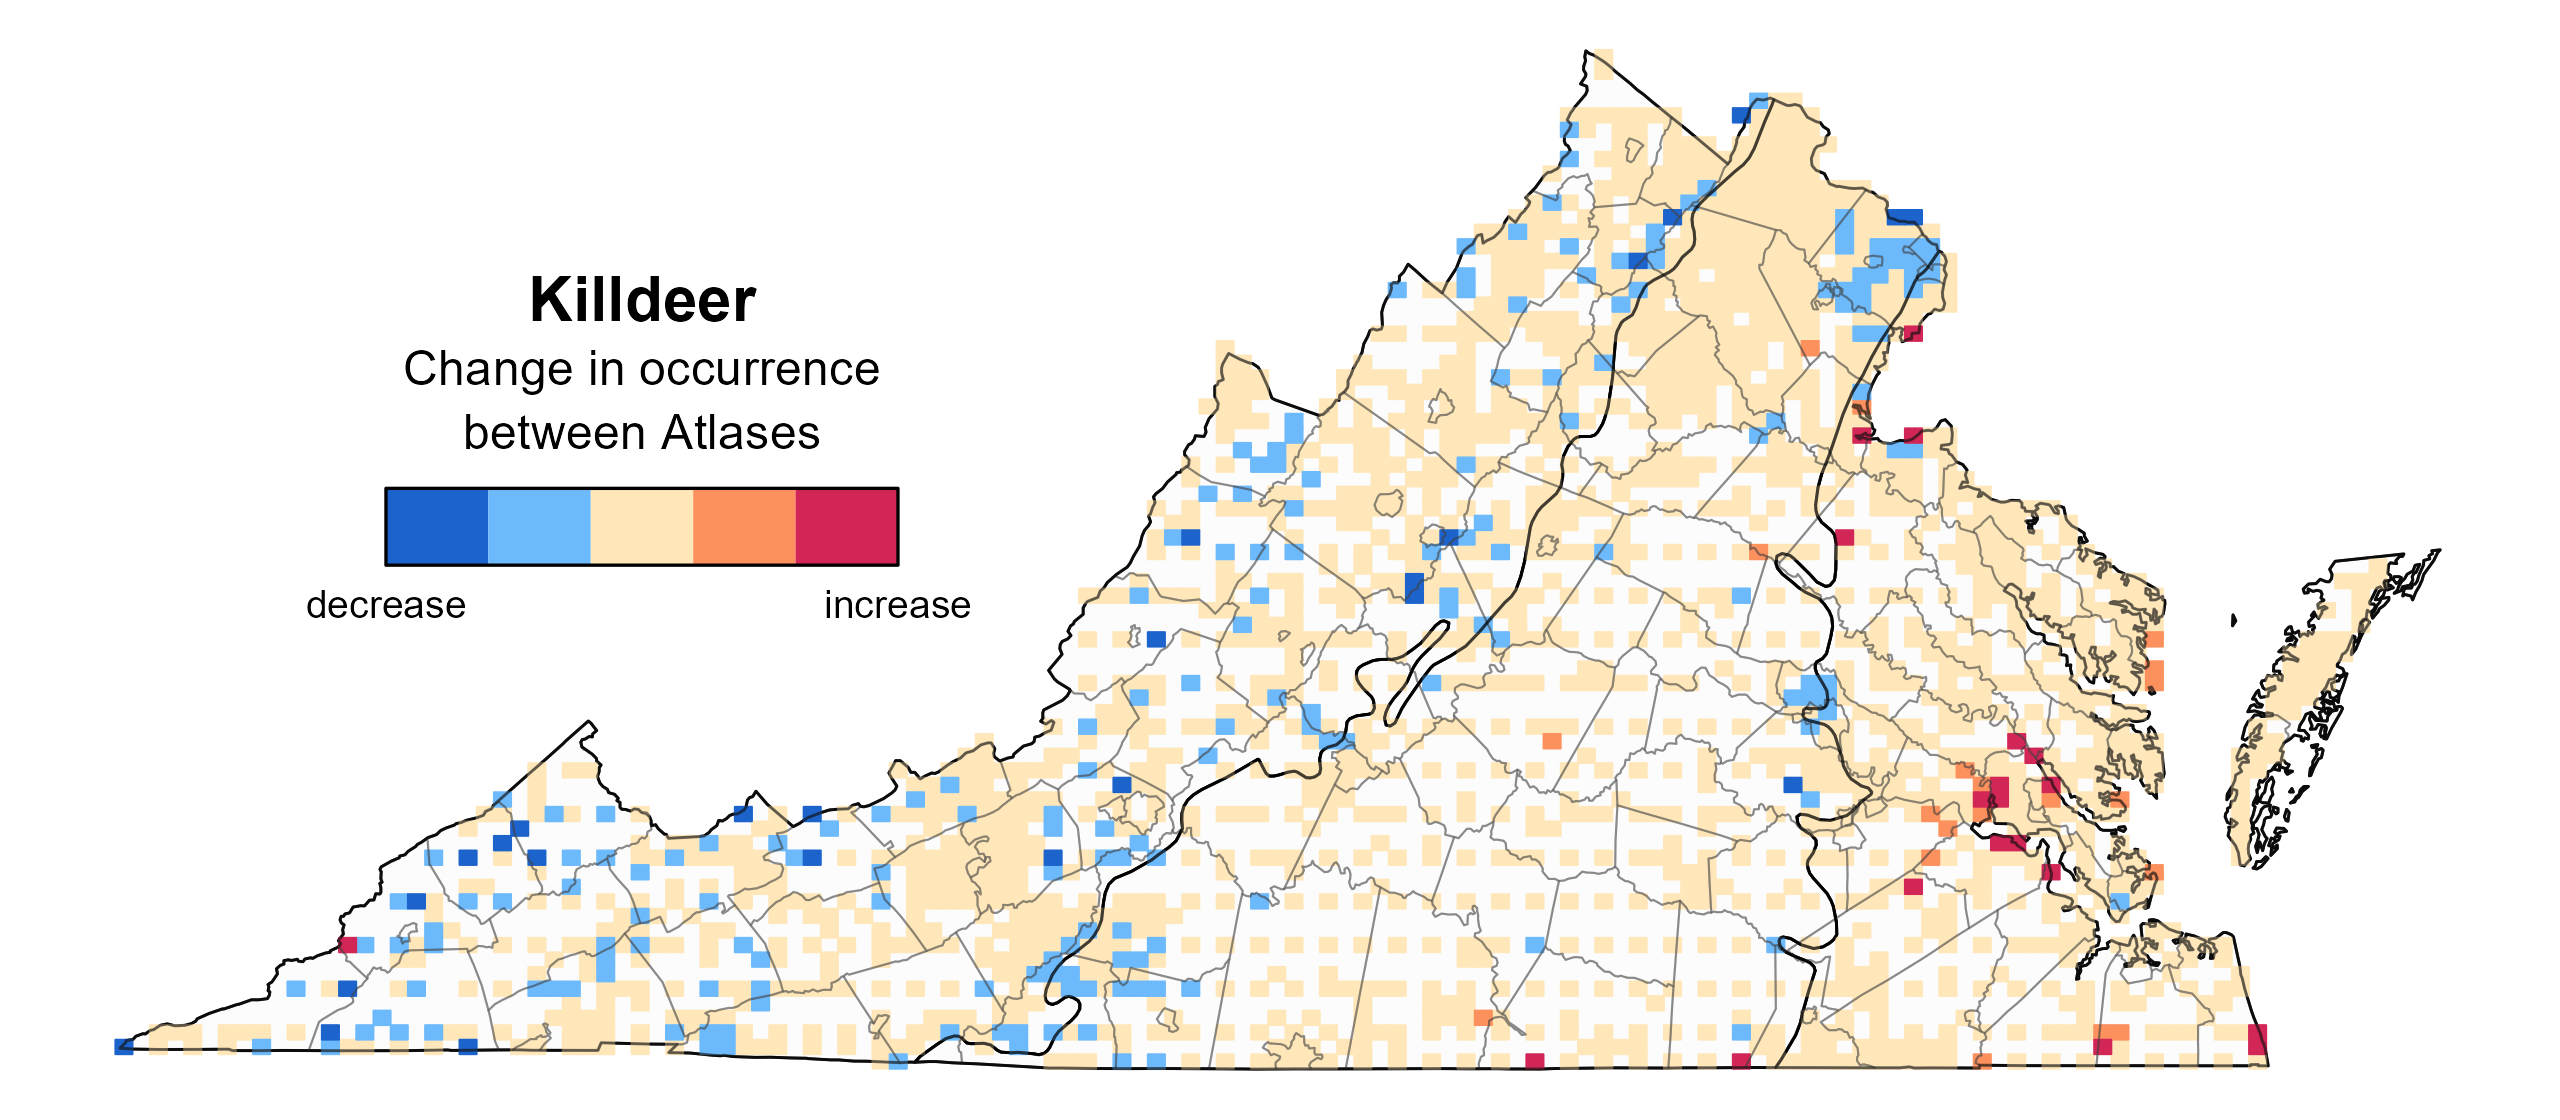
Figure 3: Killdeer change in breeding distribution between Atlases (1985–1989 and 2016–2020) based on probability of occurrence. This map indicates the change in the probability that this species will occur in a block (an approximately 10 mi2 [26 km2] survey unit) between Atlas periods. Blocks with no change may have constant presence or constant absence. Blocks in white were not surveyed during the First Atlas and were not modeled.
Breeding Evidence
Killdeer were confirmed breeders in 402 blocks and 104 counties and probable breeders in an additional five counties (Figure 4). Breeding observations were recorded throughout the state during the First Atlas as well (Figure 5).
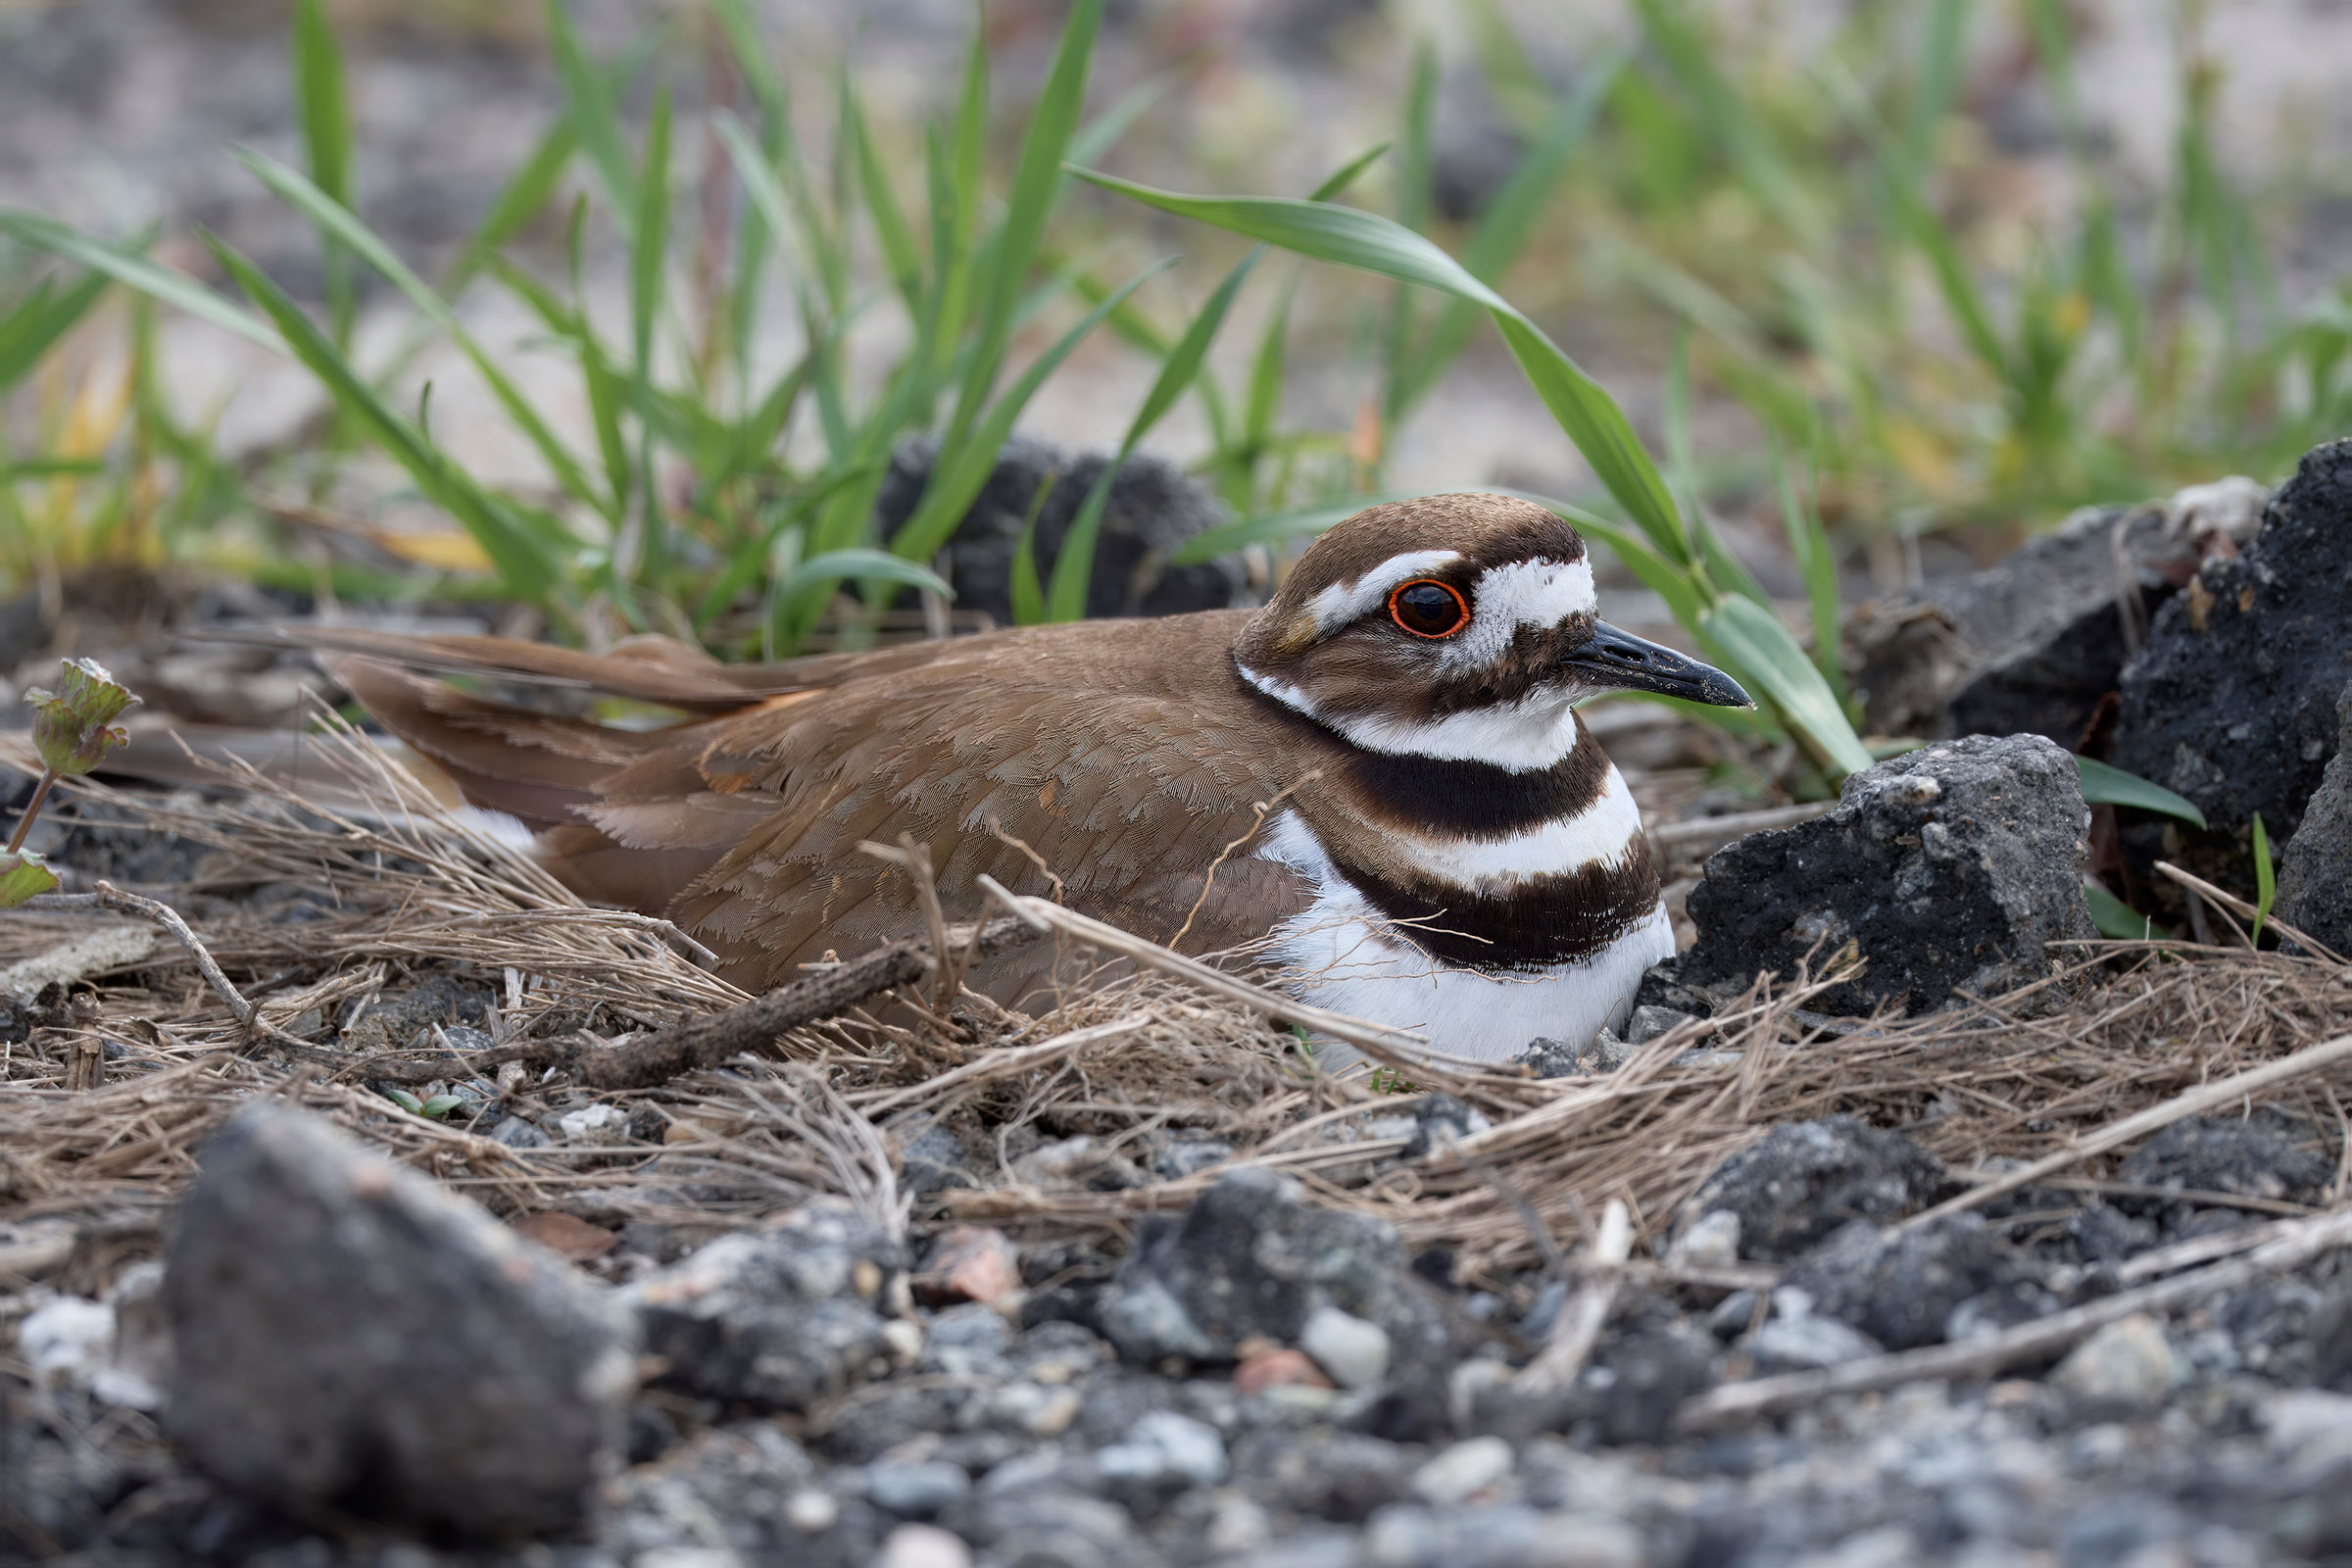
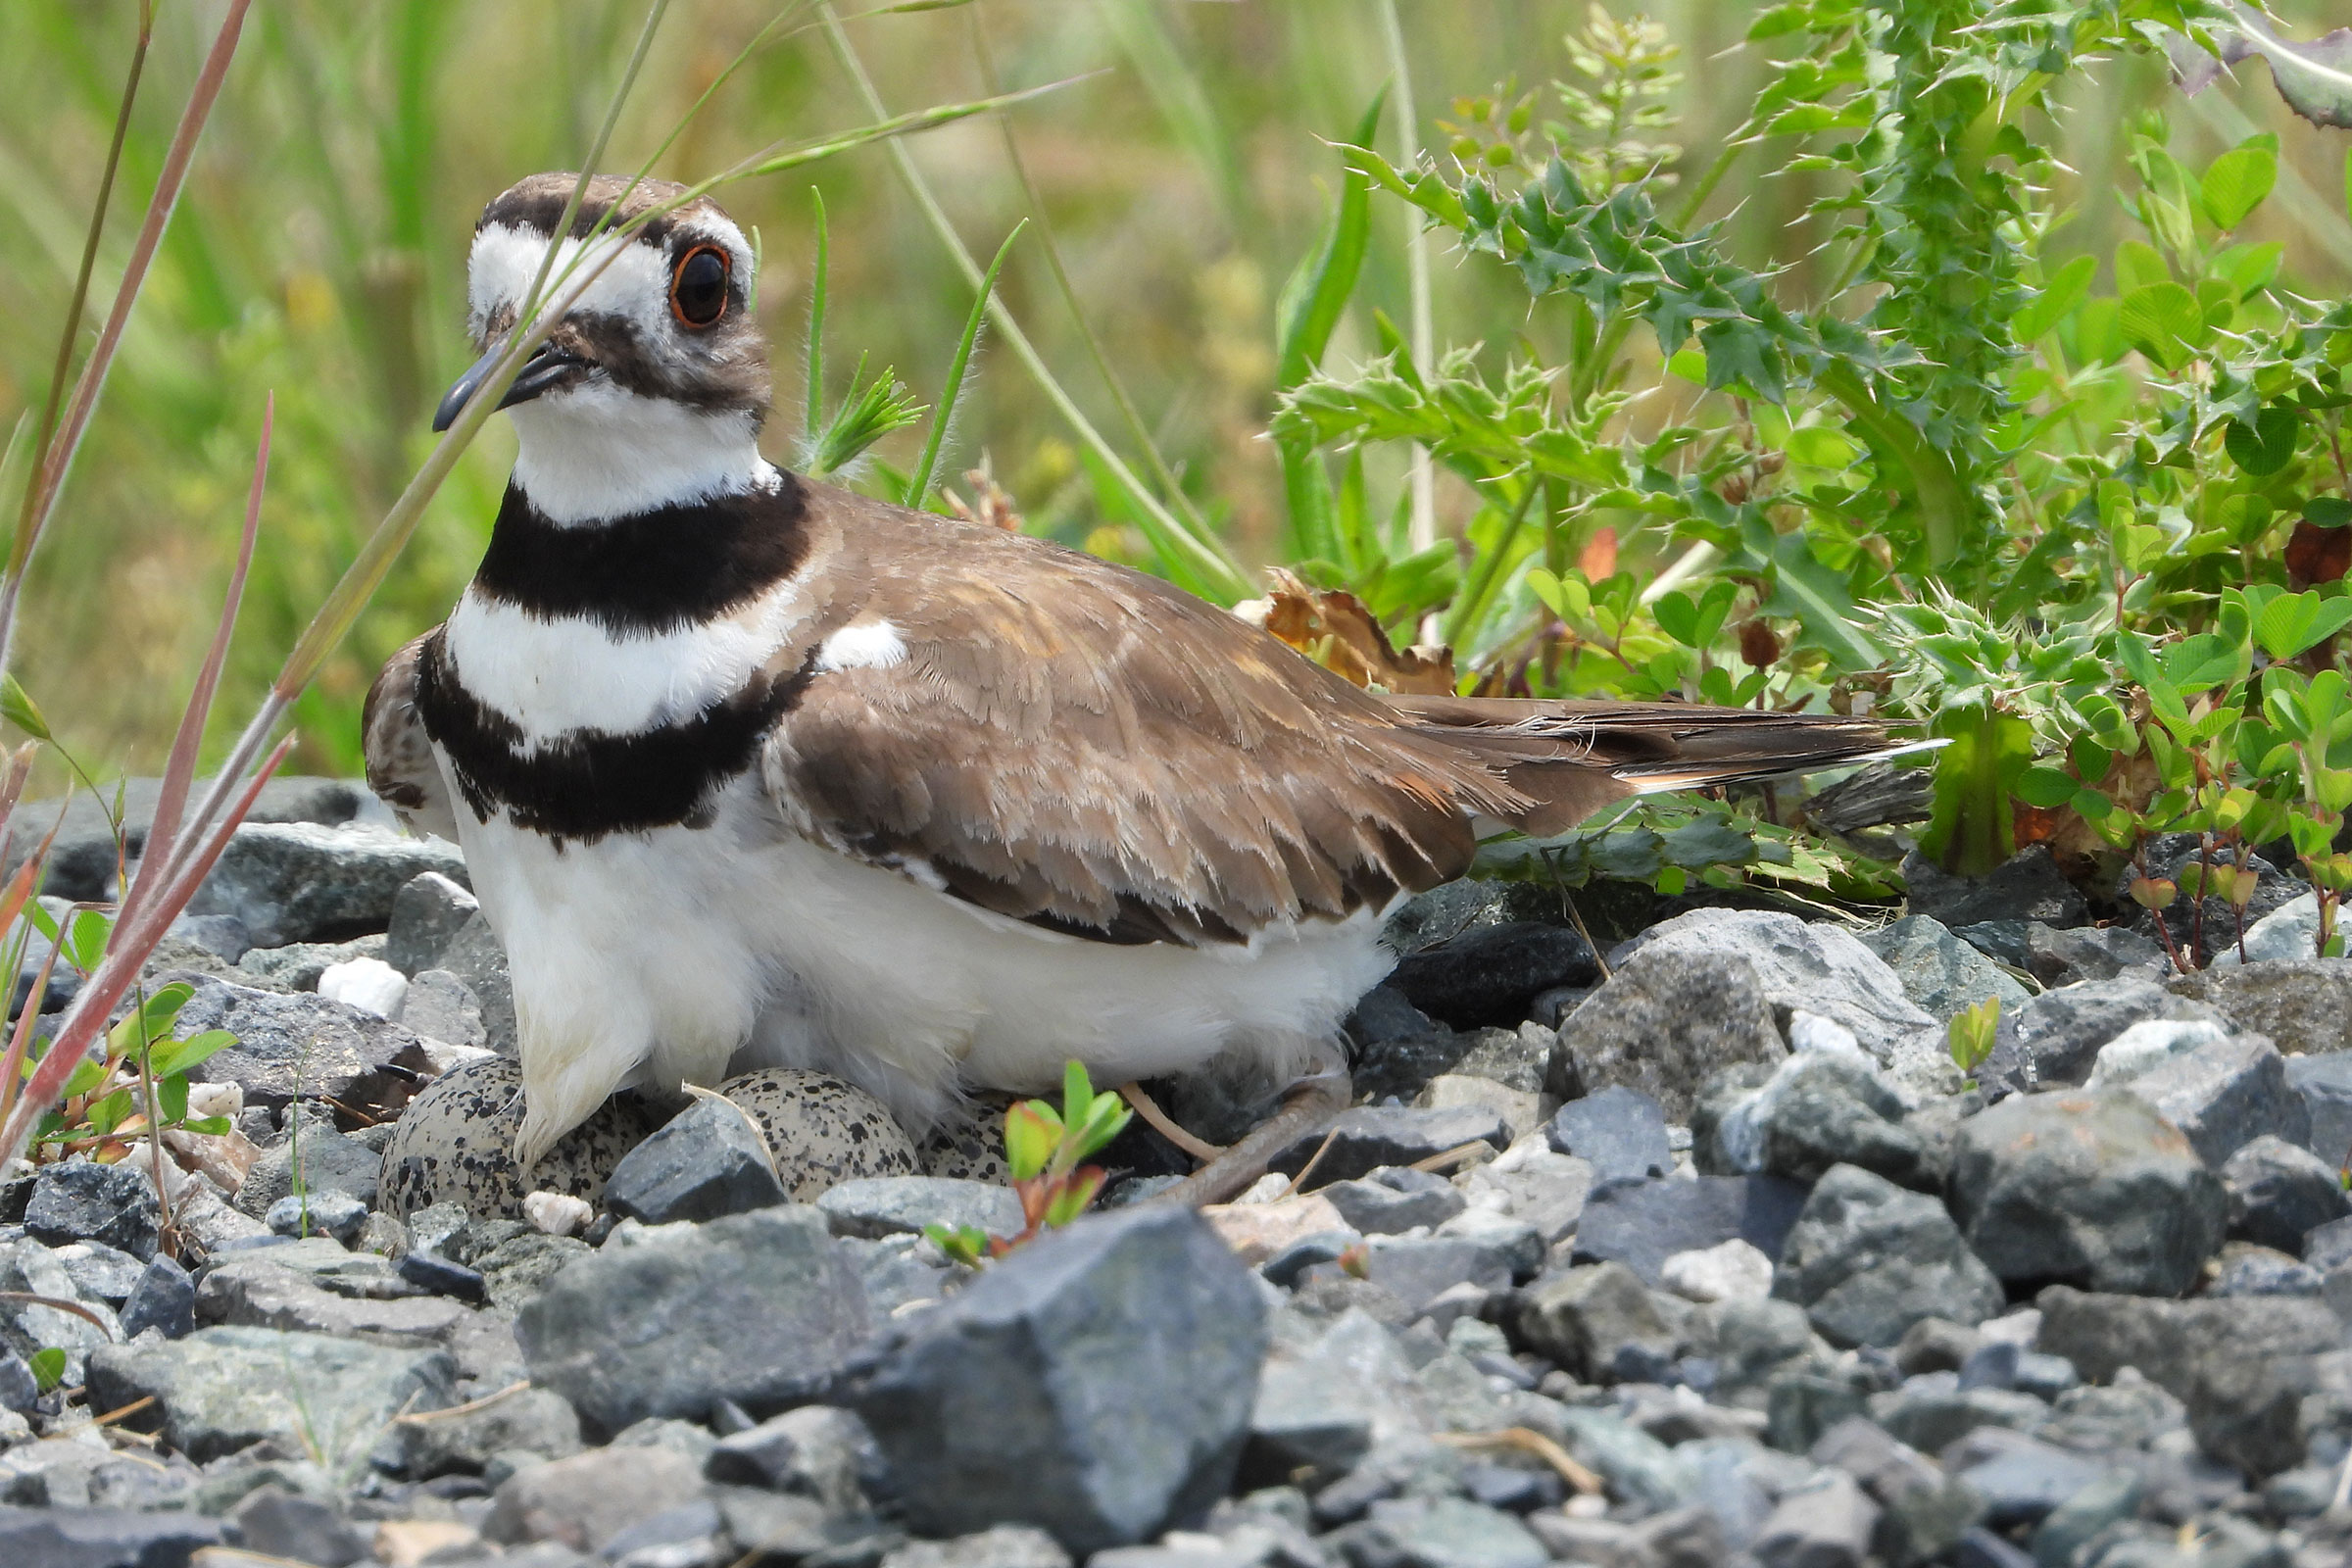
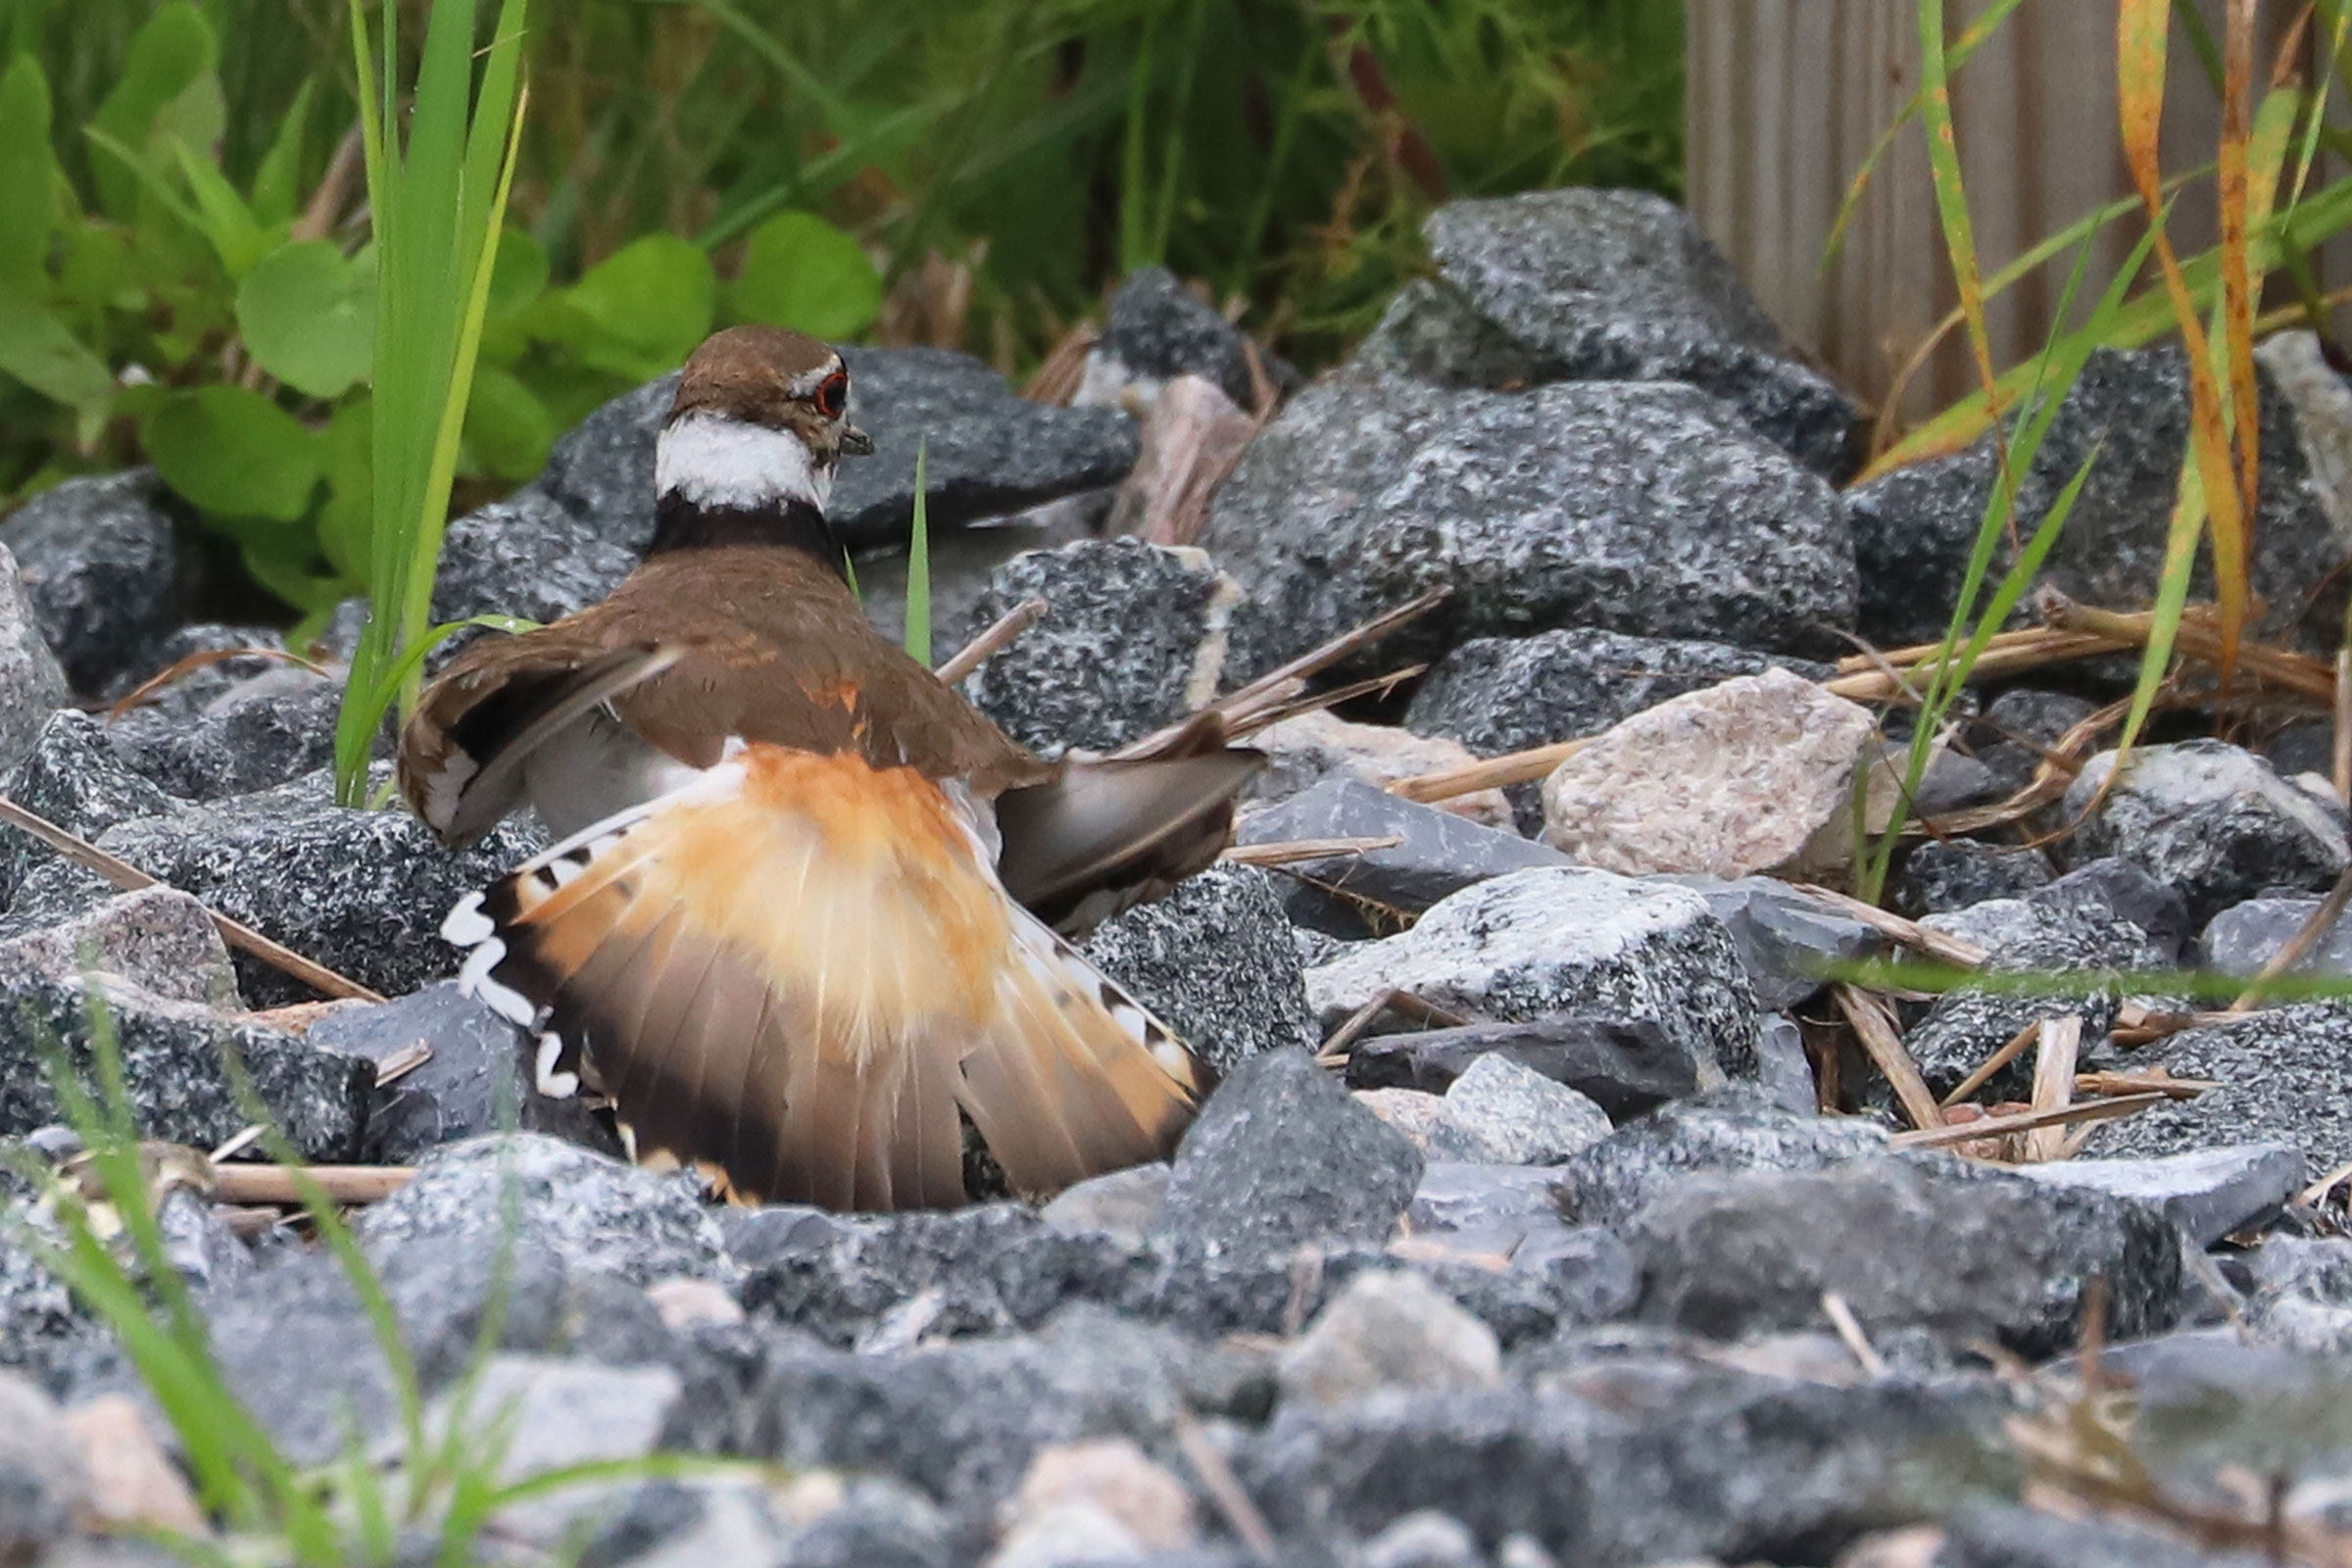
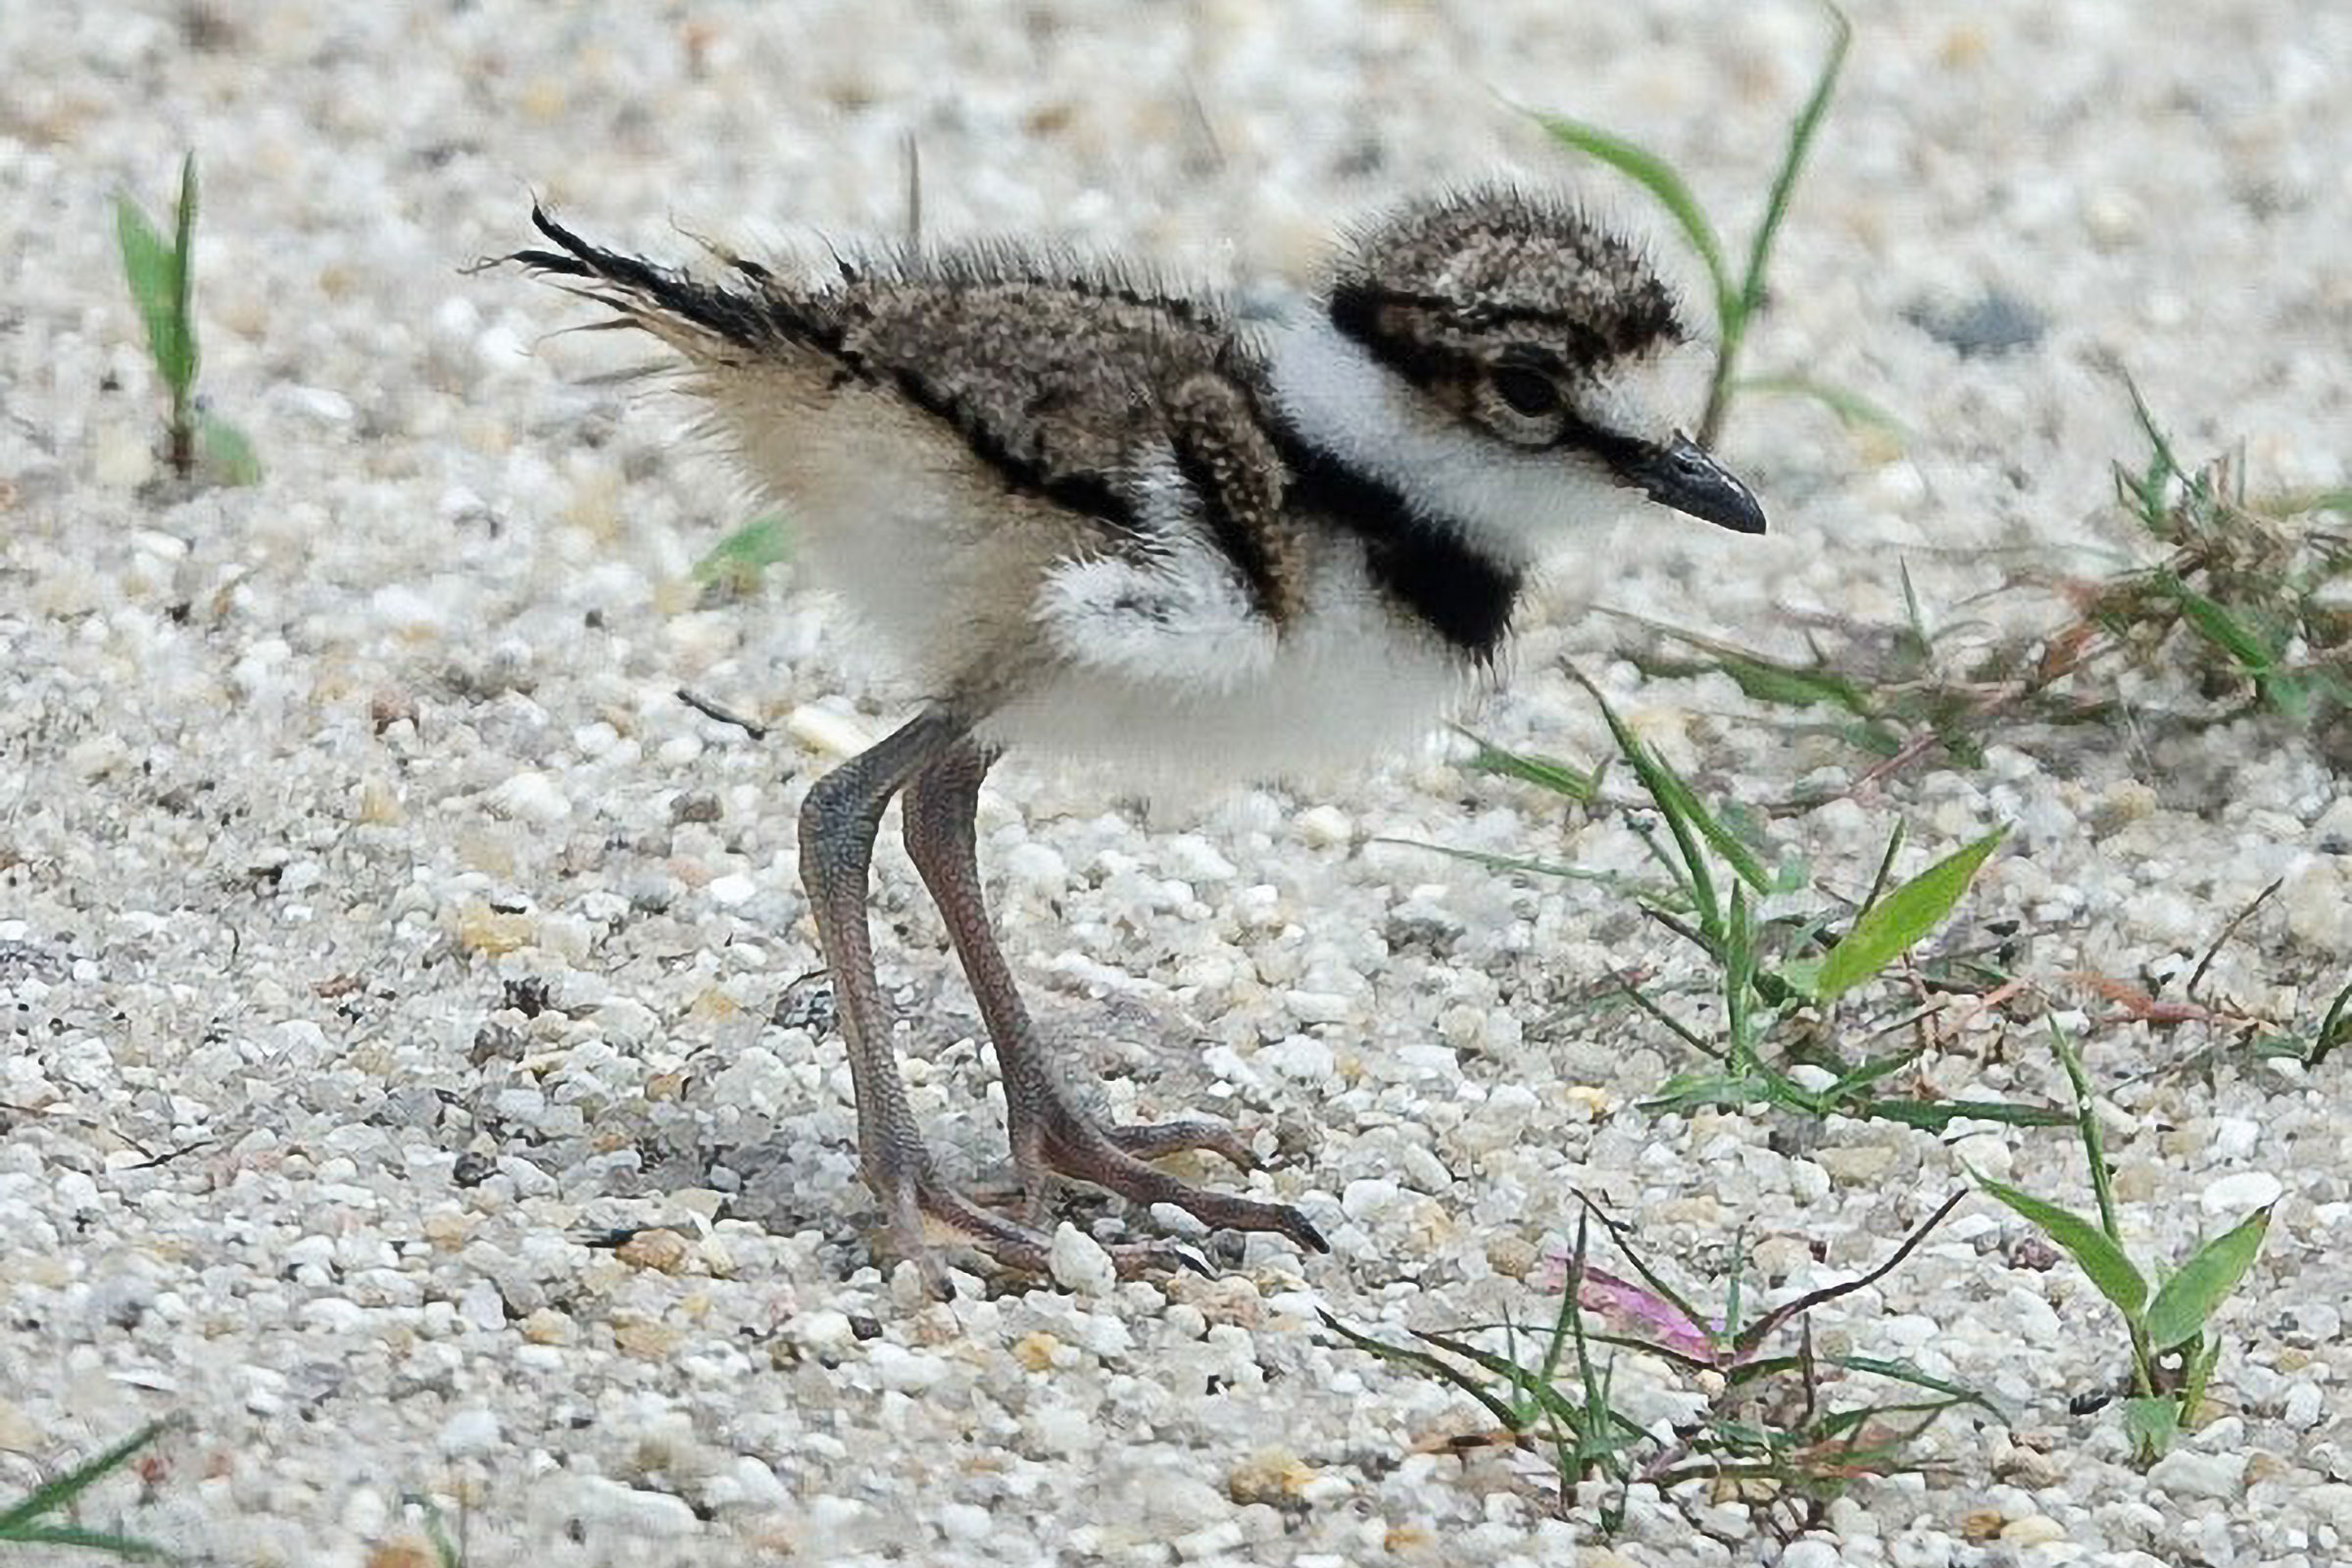
Confirmed nesting was documented from March 10 (nest with eggs) to August 28 (recently fledged young) (Figure 6). More specifically, a nest scrape expertly camouflaged amidst the gravel was a less common confirmation of their breeding than the limping, broken-winged distraction display of an agitated adult. By far the most common source of breeding confirmation was the observation of recently fledged young, which for a precocial shorebird means the downy stage prior to leaving their parents. For more general information on the breeding habits of this species, please refer to All About Birds.
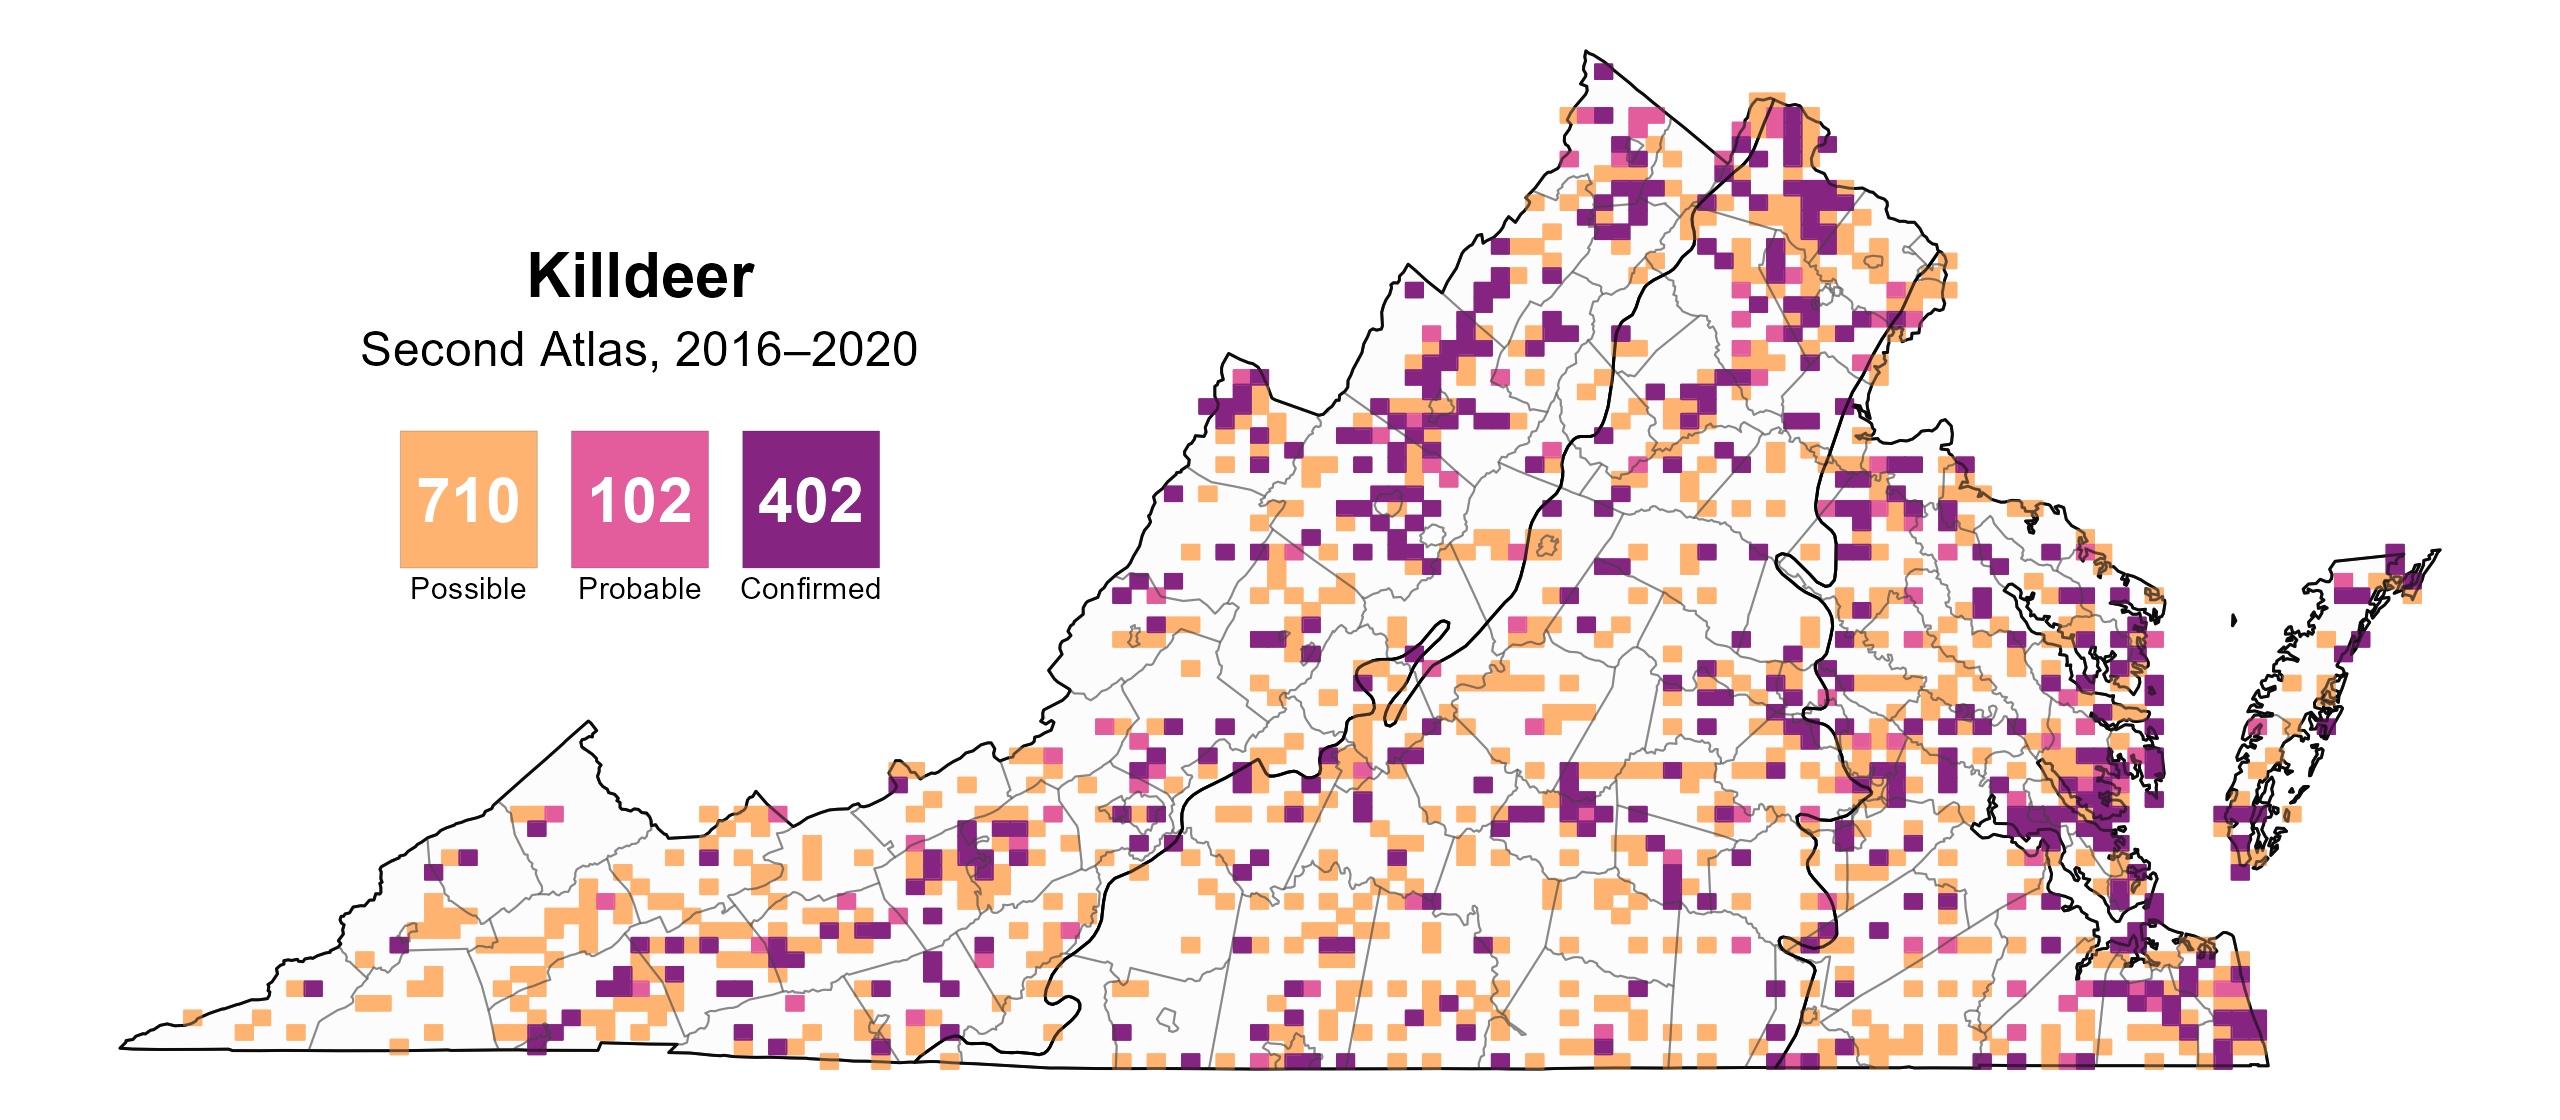
Figure 4: Killdeer breeding observations from the Second Atlas (2016–2020). The colored boxes illustrate Atlas blocks (approximately 10 mi2 [26 km2] survey units) where the species was detected. The colors show the highest breeding category recorded in a block. The numbers within the colors in the legend correspond to the number of blocks with that breeding evidence category.
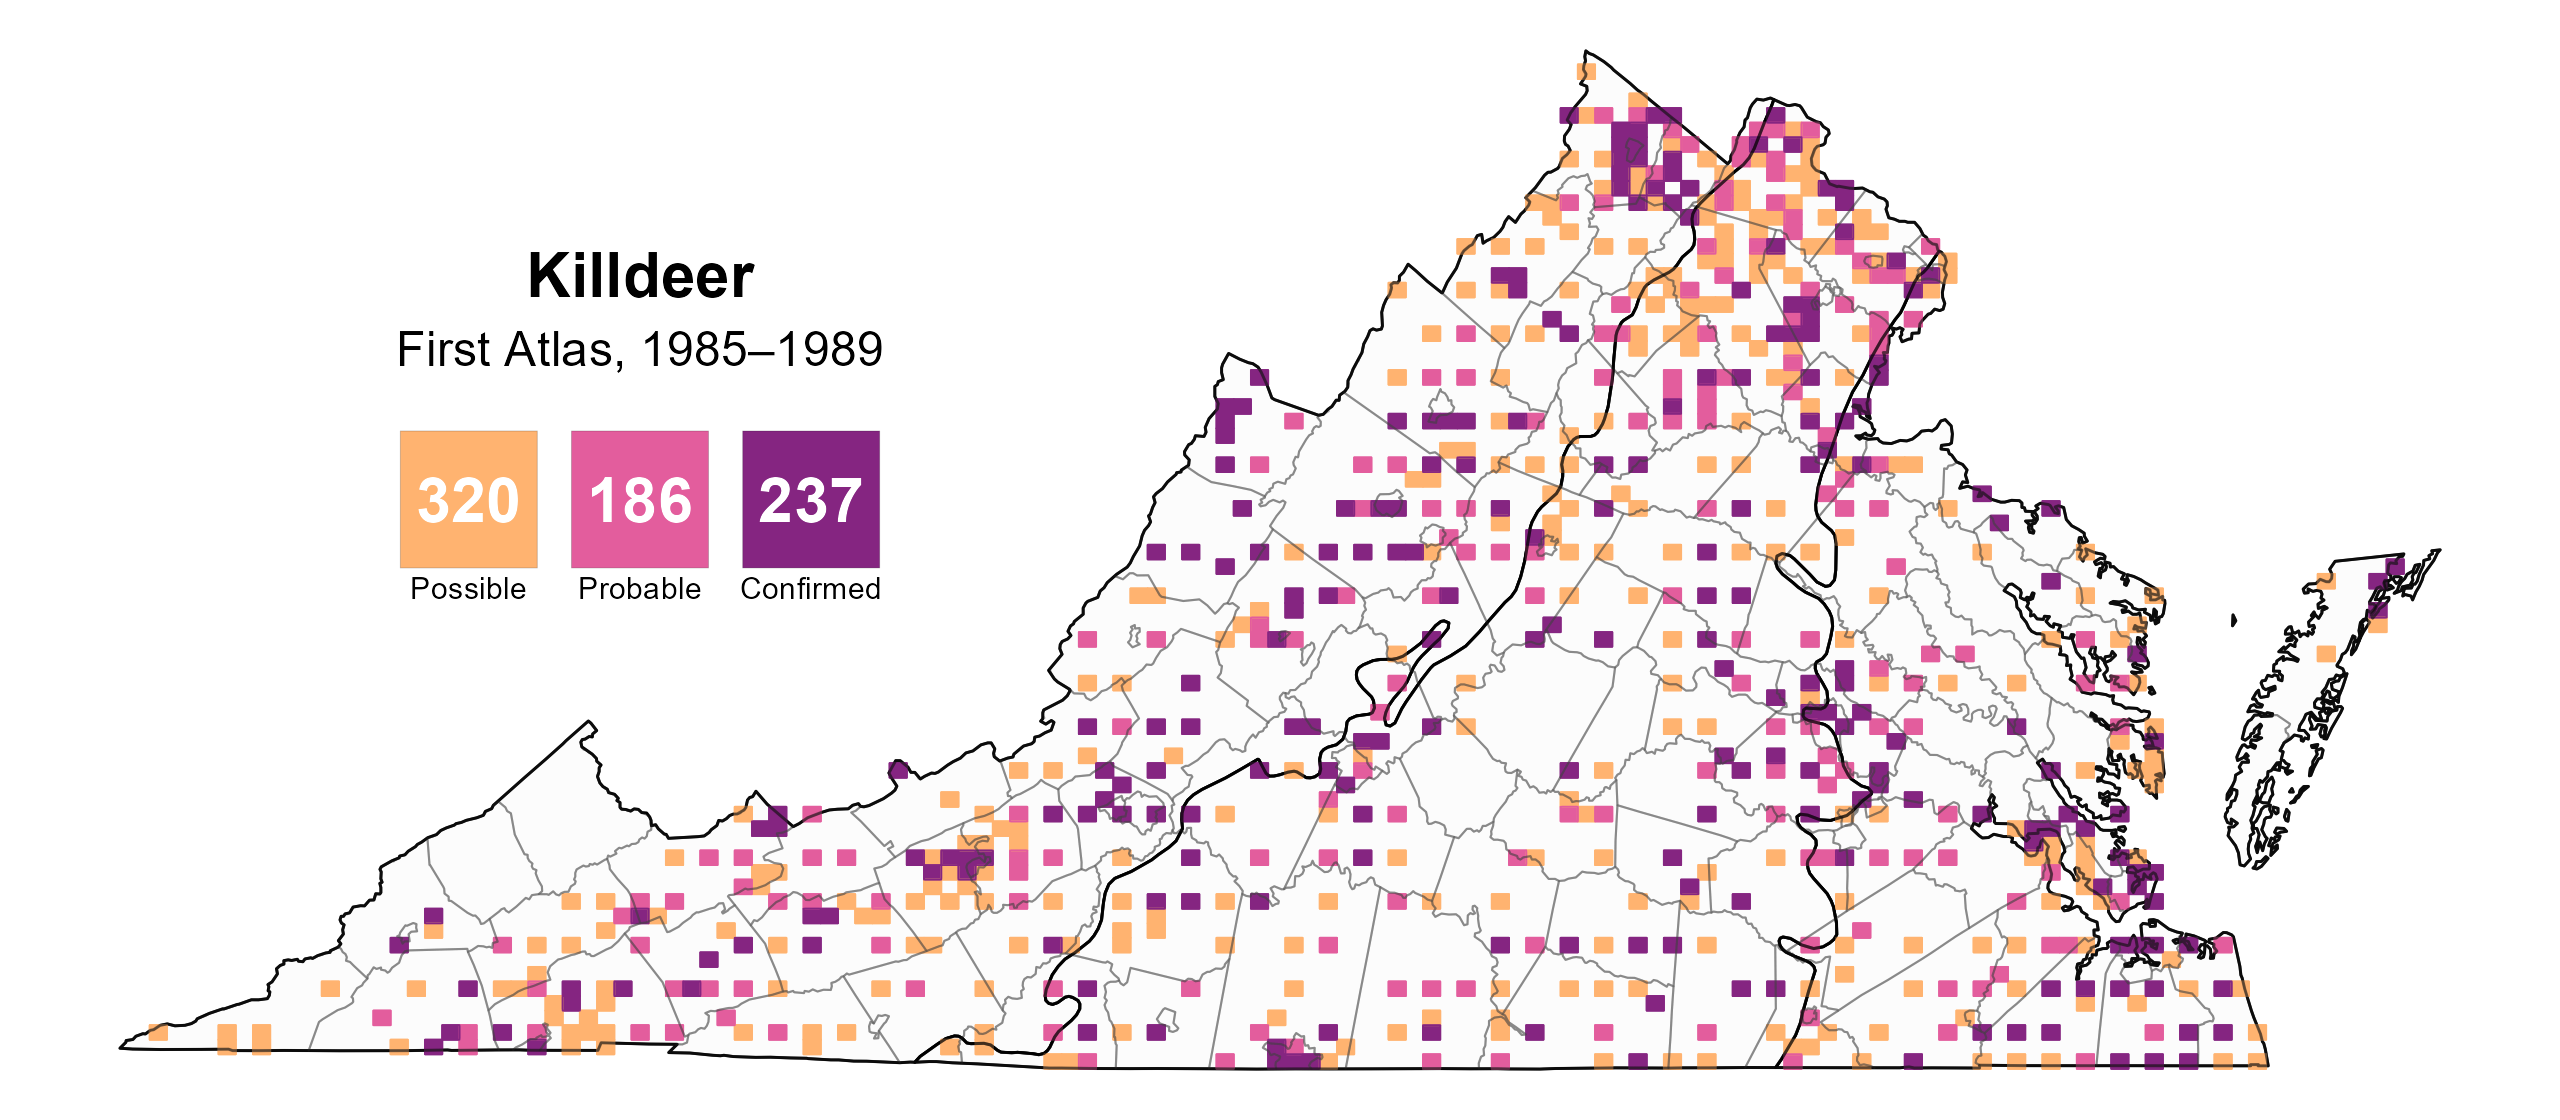
Figure 5: Killdeer breeding observations from the First Atlas (1985–1989). The colored boxes illustrate Atlas blocks (approximately 10 mi2 [26 km2] survey units) where the species was detected. The colors show the highest breeding category recorded in a block. The numbers within the colors in the legend correspond to the number of blocks with that breeding evidence category.
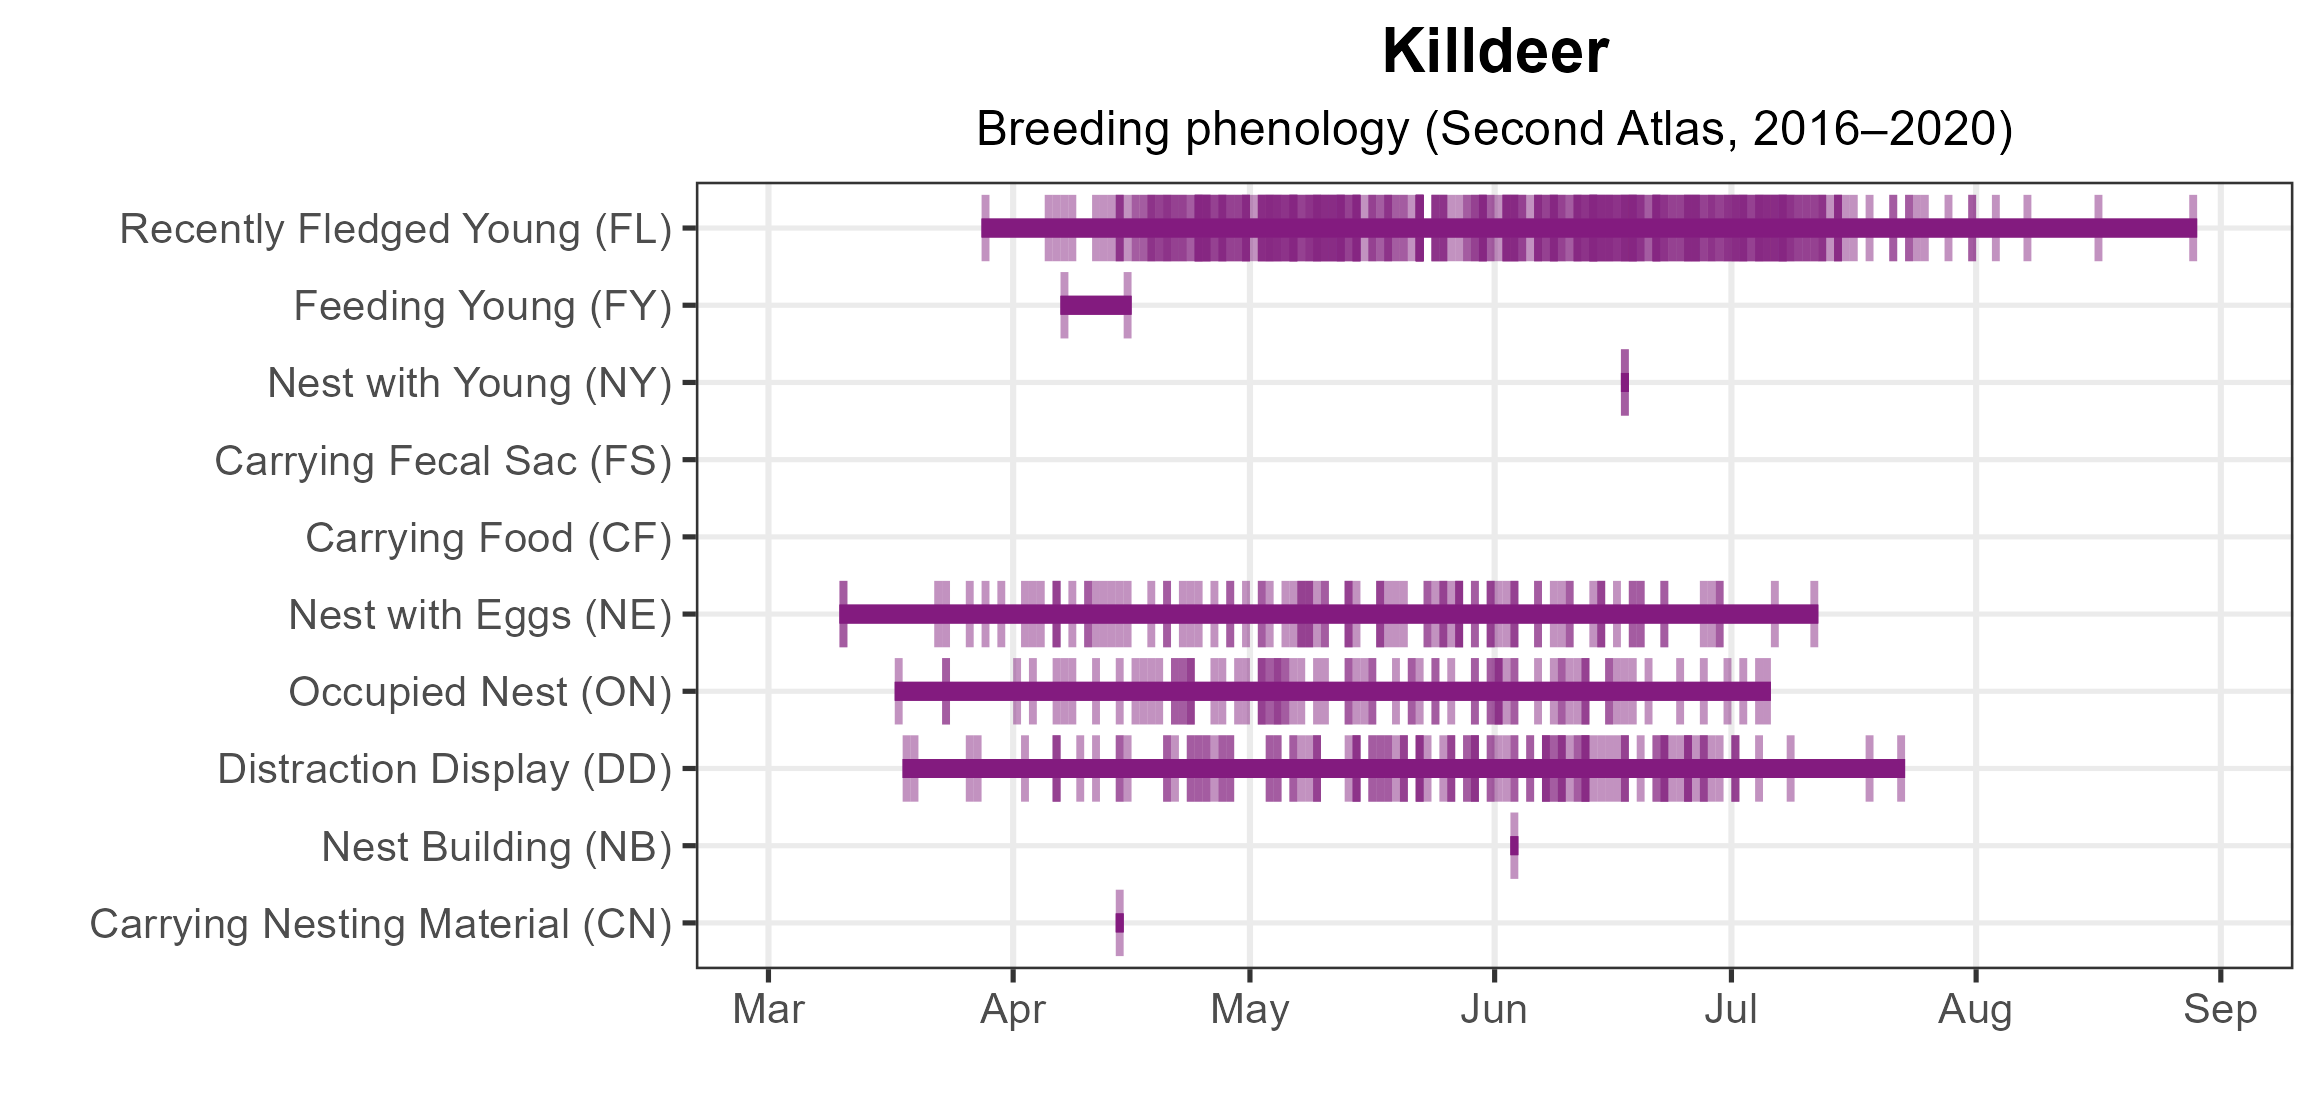
Figure 6: Killdeer phenology: confirmed breeding codes. This graph shows a timeline of confirmed breeding behaviors. Tick marks represent individual observations of the behavior.
Population Status
Killdeer relative abundance was estimated to be highest in the Coastal Plain region, particularly in the cities of Chesapeake and Virginia Beach and on the Eastern Shore, where agricultural cover is abundant (Figure 7). This species occurs at lower abundances throughout the rest of the state, particularly in the high-elevation areas of the Mountains and Valleys region and the Appalachian Plateau.
The total estimated population in the state is approximately 68,000 individuals (with a range between 37,000 and 126,000). Population trends for Killdeer appear stable in Virginia. The North American Breeding Bird Survey (BBS) population trend shows a nonsignificant increase of 0.28% per year from 1966–2022 (Hostetler et al. 2023; Figure 8). Between Atlas periods, the BBS trend showed a nonsignificant decline of 0.34% per year from 1987–2018.
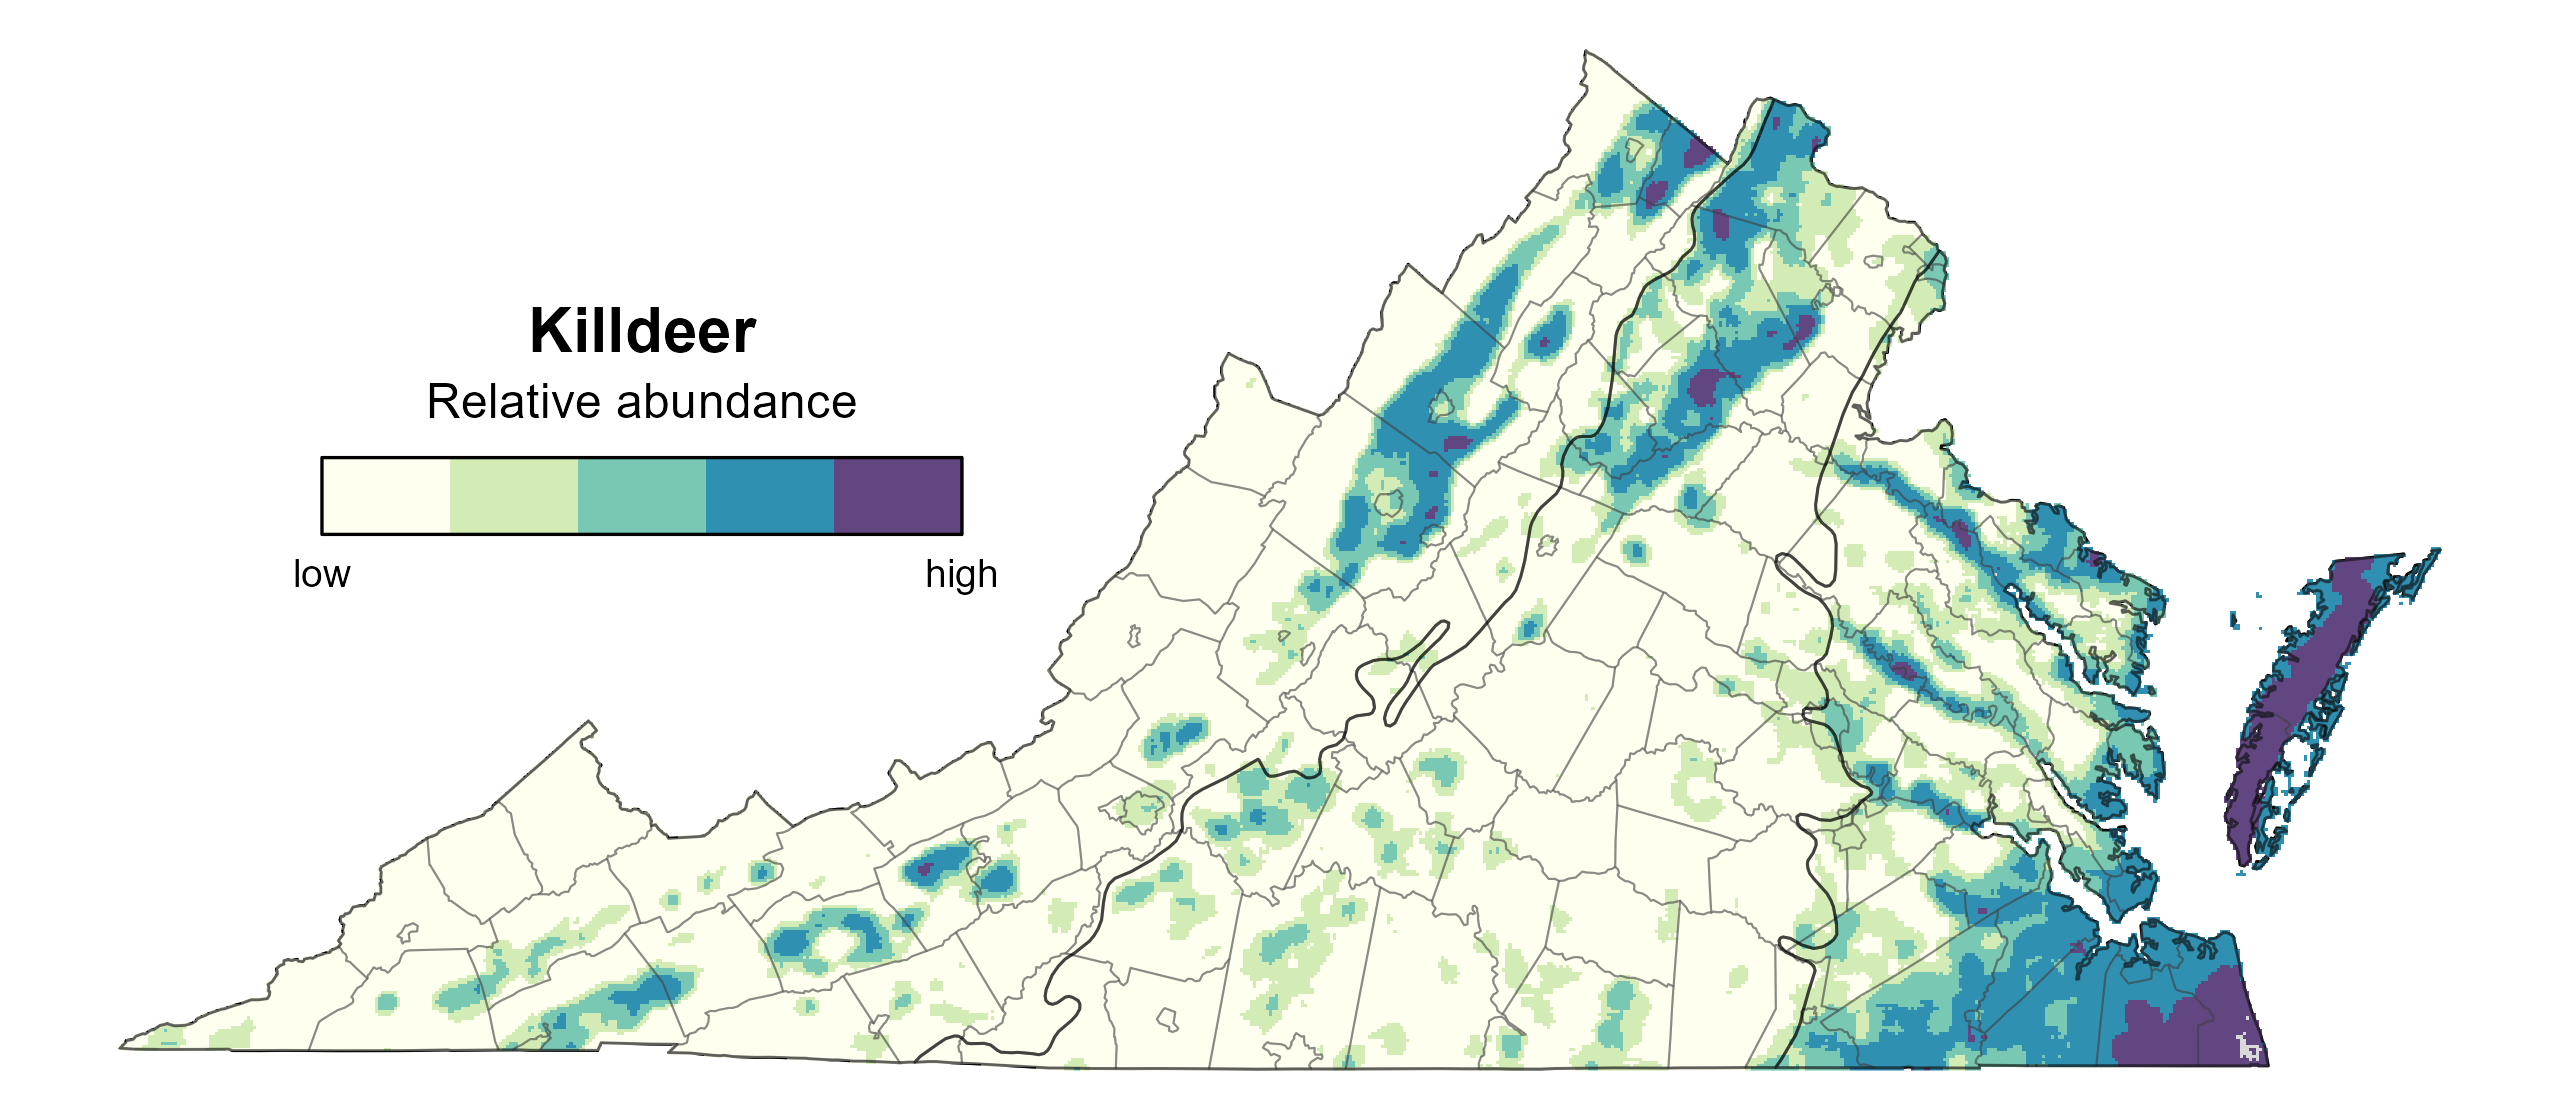
Figure 7: Killdeer relative abundance (Second Atlas, 2016–2020). This map indicates the predicted abundance of this species at a 0.4 mi2 (1 km2) scale based on environmental (including habitat) factors. Abundance values are presented on a relative scale of low to high.
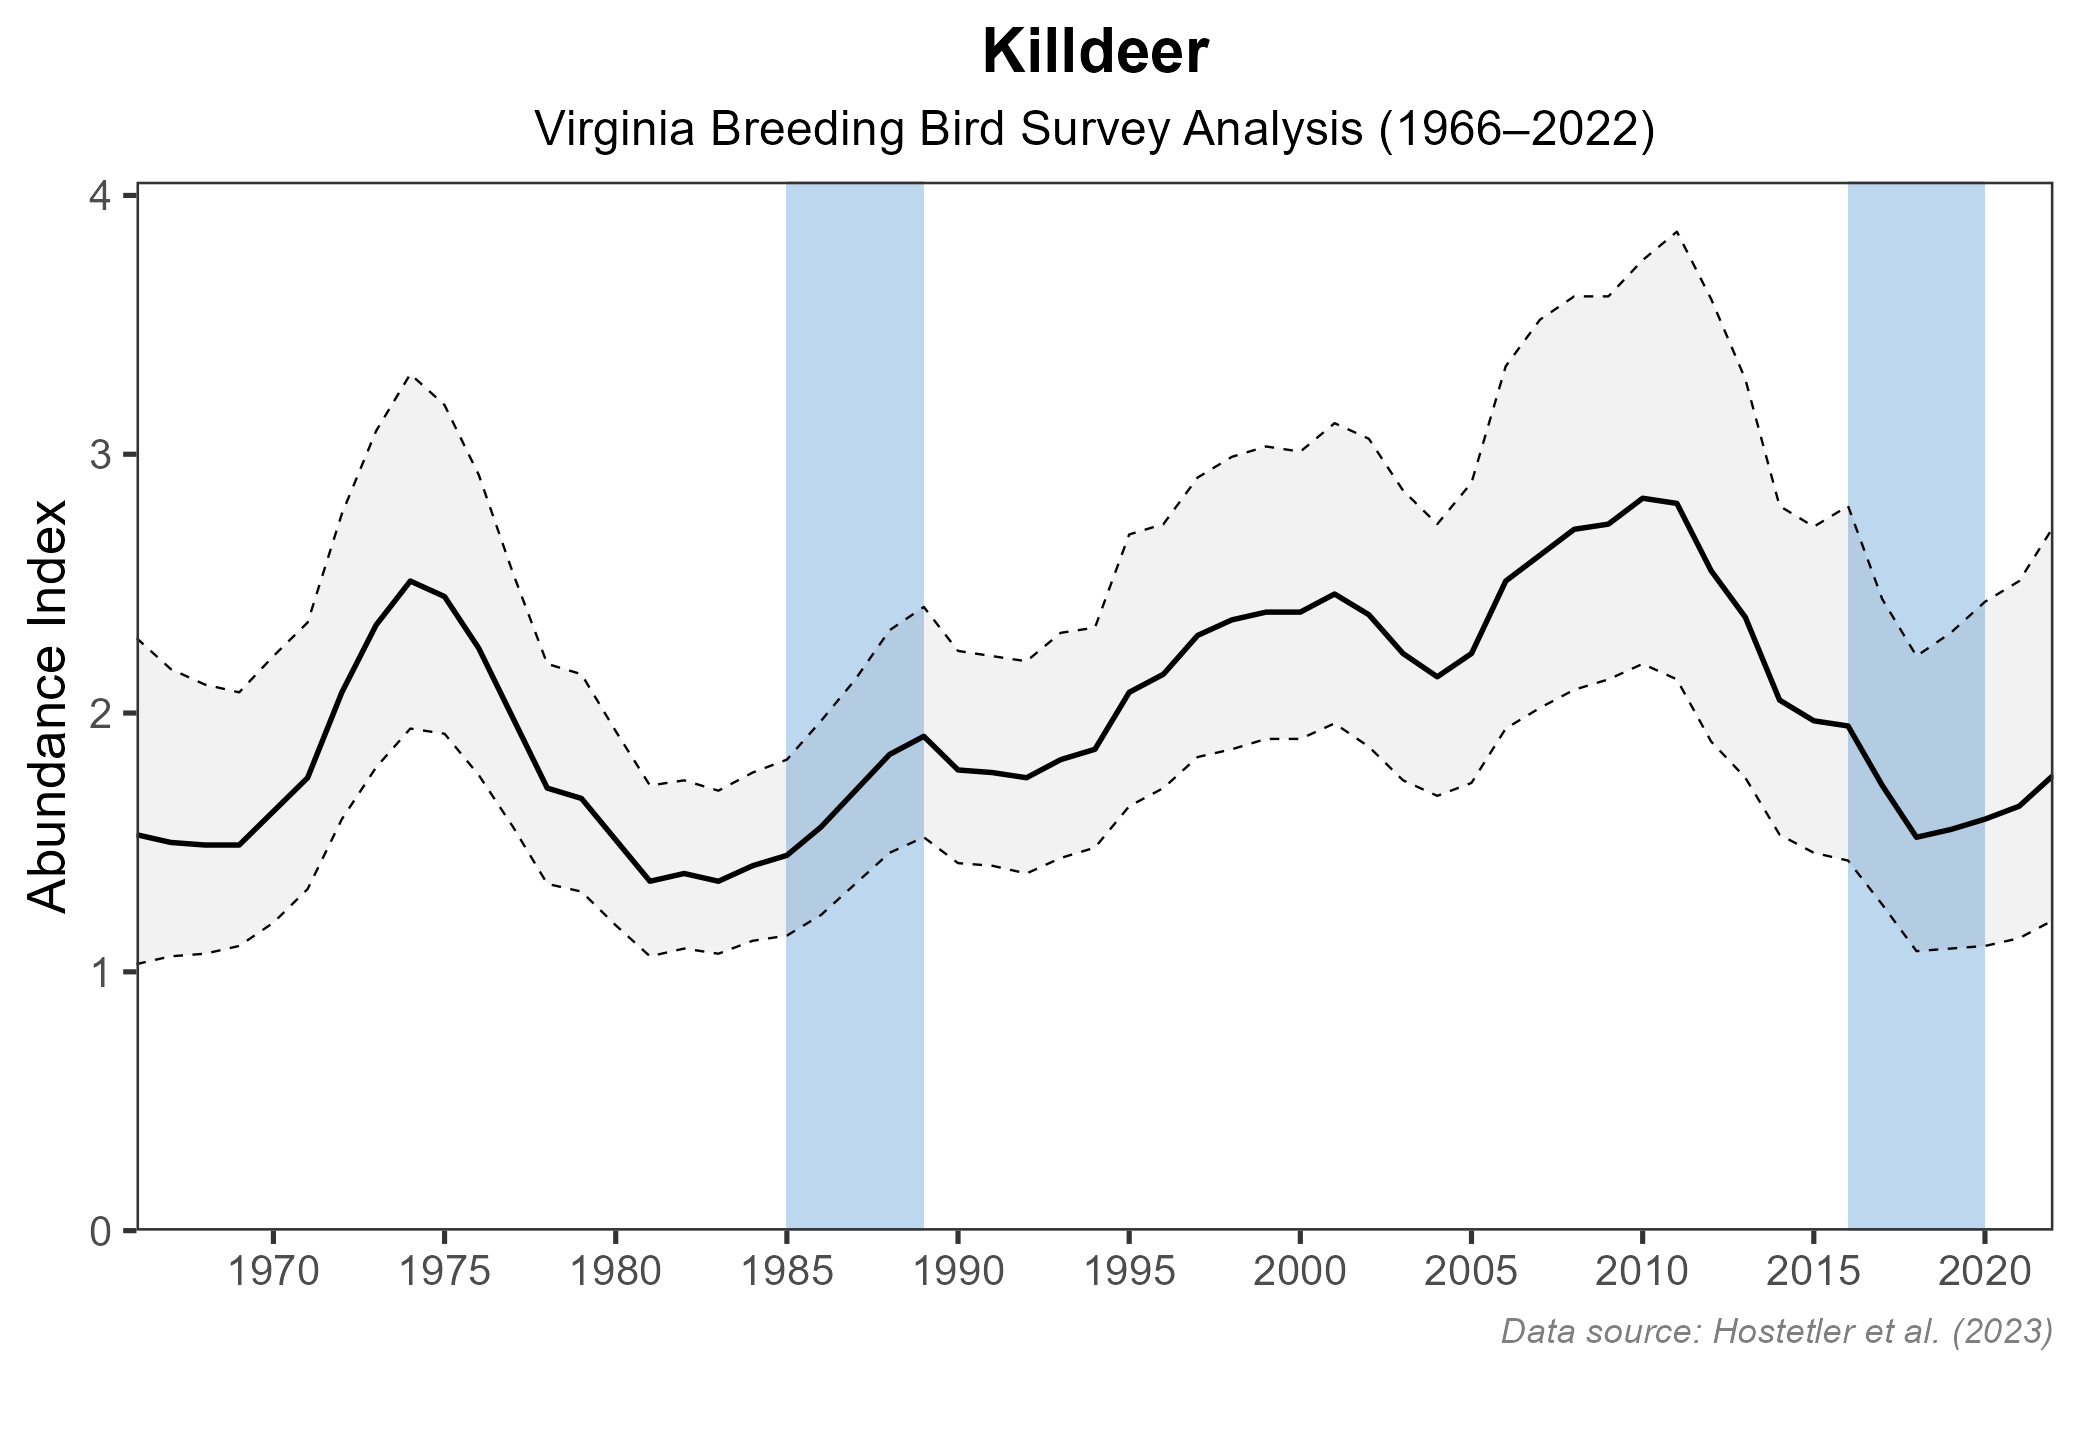
Figure 8: Killdeer population trend for Virginia as estimated by the North American Breeding Bird Survey. The vertical axis shows species abundance; the horizontal axis shows the year. The solid line indicates the estimated population trend; there is a 97.5% probability that the true population trend falls between the dashed lines. The shaded bars indicate the First and Second Atlas periods.
Conservation
Because Killdeer populations are stable, this species is not the focus of any specific conservation efforts in Virginia. Despite their stability at the population level, individual Killdeer are at risk of collisions with human structures, exposure to environmental pollutants, and collision strikes by vehicles because they often live in such close association with humans. Urban areas can provide attractive nesting habitat on flat gravel rooftops that cause chicks to become trapped after hatching or die while leaping off (Jackson and Jackson 2020).
Interactive Map
The interactive map contains up to six Atlas layers (probability of occurrence for the First and Second Atlases, change in probability of occurrence between Atlases, breeding evidence for the First and Second Atlases, and abundance for the Second Atlas) that can be viewed one at a time. To view an Atlas map layer, mouse over the layer box in the upper left. County lines and physiographic regional boundaries (Mountains and Valleys, Piedmont, and Coastal Plain) can be turned on and off by checking or unchecking the box below the layer box. Within the map window, users can hover on a block to see its value for each layer and pan and zoom to see roads, towns, and other features of interest that are visible beneath a selected layer.
View Interactive Map in Full Screen
References
Dewitz, J. (2021). National land cover database (NLCD) 2019 products, version 2.0. U.S. Geological Survey data release. https://doi.org/10.5066/P9KZCM54.
Hostetler, J. A., J. R. Sauer, J. E. Hines, D. Ziolkowski, and M. Lutmerding (2023). The North American breeding bird survey, analysis results 1966–2022. U.S. Geological Survey, Laurel, MD, USA. https://doi.org/10.5066/P9SC7T11.
Jackson, B. J., and J. A. Jackson (2020). Killdeer (Charadrius vociferus), version 1.0. In Birds of the World (A. F. Poole and F. B. Gill, Editors). Cornell Lab of Ornithology, Ithaca, NY, USA. https://birdsoftheworld.org/bow/species/killde.
Rottenborn, S. C., and E. S. Brinkley (Editors) (2007). Virginia’s birdlife: An annotated checklist. 4th edition. Virginia Society of Ornithology.
Slonecker, T., L. Milheim, and P. Claggett (2010). Landscape indicators and land cover change in the Mid-Atlantic region of the United States, 1973-2001. GIScience & Remote Sensing 47:163–86. https://doi.org/10.2747/1548-1603.47.2.163.