Introduction
The Fish Crow is often overshadowed by its larger relative, the American Crow (Corvus brachyrhynchos), but this southeastern endemic has undergone a surprising range and population expansion in the last 50 years. Historically, the Fish Crow was found mainly in coastal regions, but by expanding inland along major waterways, the species has become locally common even in the Mountains and Valleys region, where it was first documented breeding in Augusta County in 1979 (Rottenborn and Brinkley 2007). In Virginia, Fish Crows nest most frequently in pine trees, more so than American Crows, which may be due to their strong association with pine-rich coastal areas rather than any specific preference (Clapp and Banks 1993). Today, Fish and American Crows overlap throughout much of Virginia, and voice is the easiest way to distinguish them as the Fish Crow proclaims its identity with a high, nasal nuh-uh!
Breeding Distribution
Fish Crows are present year-round in Virginia, though some birds may be short-distance migrants. They occur in all regions of the state but are concentrated in coastal and urban areas and along major rivers at lower elevations in the Mountains and Valleys region (Figure 1). The likelihood of Fish Crow occurrence decreases in a block as the proportions of shrubland and grassland habitats, forest cover, and agricultural cover increase.
Between the First and Second Atlases (Figures 1 and 2), Fish Crow’s likelihood of occurrence decreased in the northwestern portion of the state, along some of the eastern area of the Piedmont, and the northern half of the Coastal Plain (Figure 3). However, its occurrence remained stable in its stronghold areas of the southeastern Coastal Plain and Eastern Shore. It should be noted that the environmental variables modeled may not have been sufficient for modeling the geographical limits of the species’ distribution (see Breeding Evidence).
View Environmental Associations
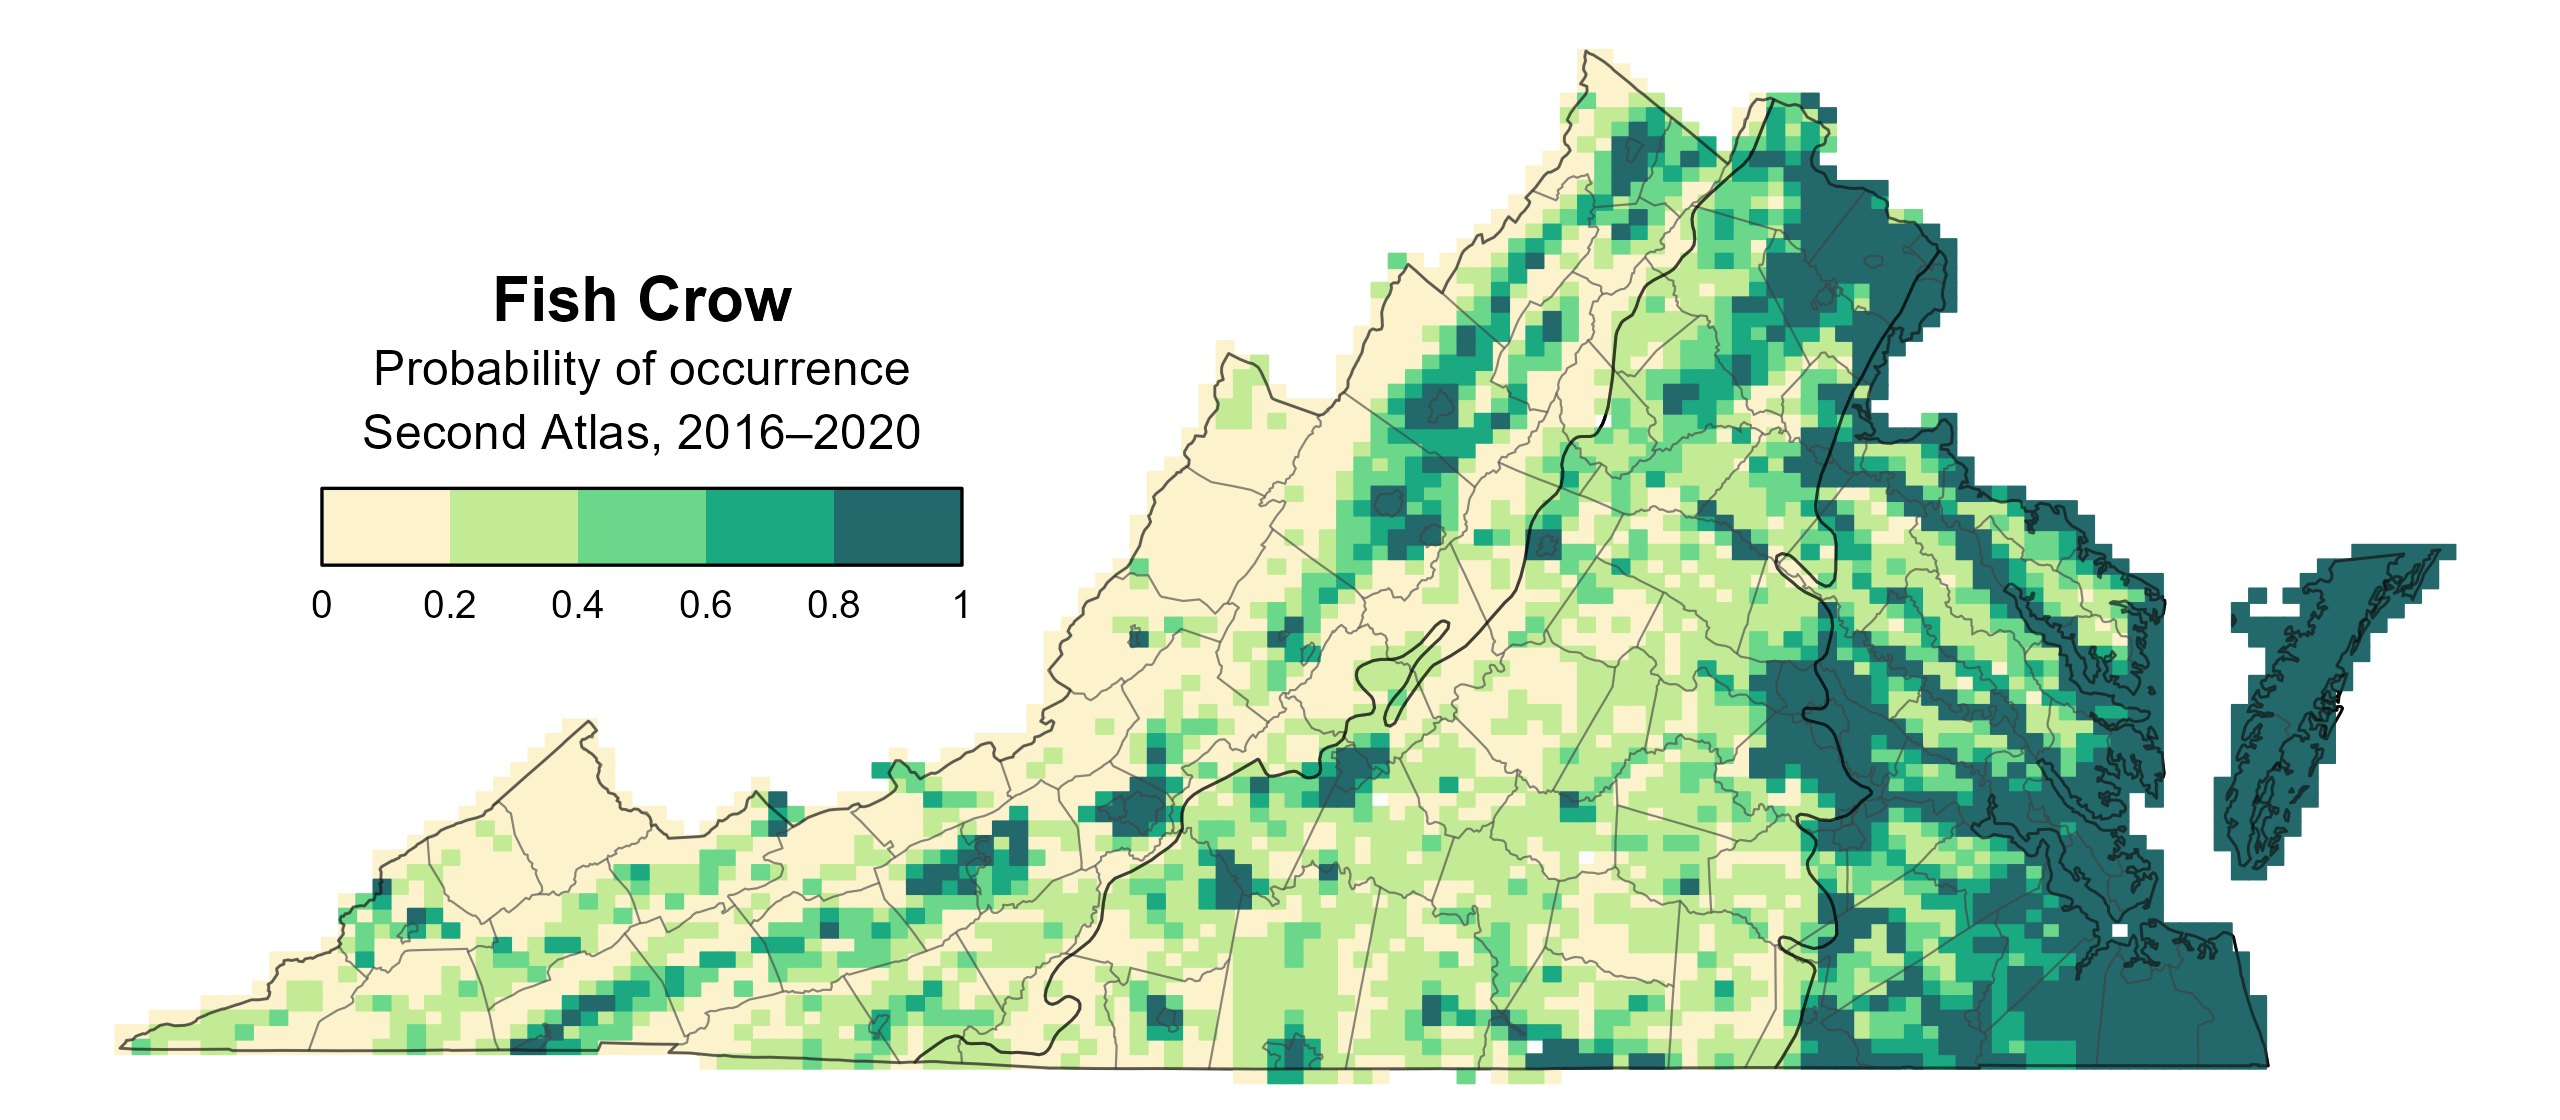
Figure 1: Fish Crow breeding distribution based on probability of occurrence (Second Atlas, 2016–2020). This map indicates the probability that this species will occur in an Atlas block (an approximately 10 mi2 [26 km2] survey unit) based on environmental (including habitat) factors and after adjusting for the probability of detection (variation in survey effort among blocks).
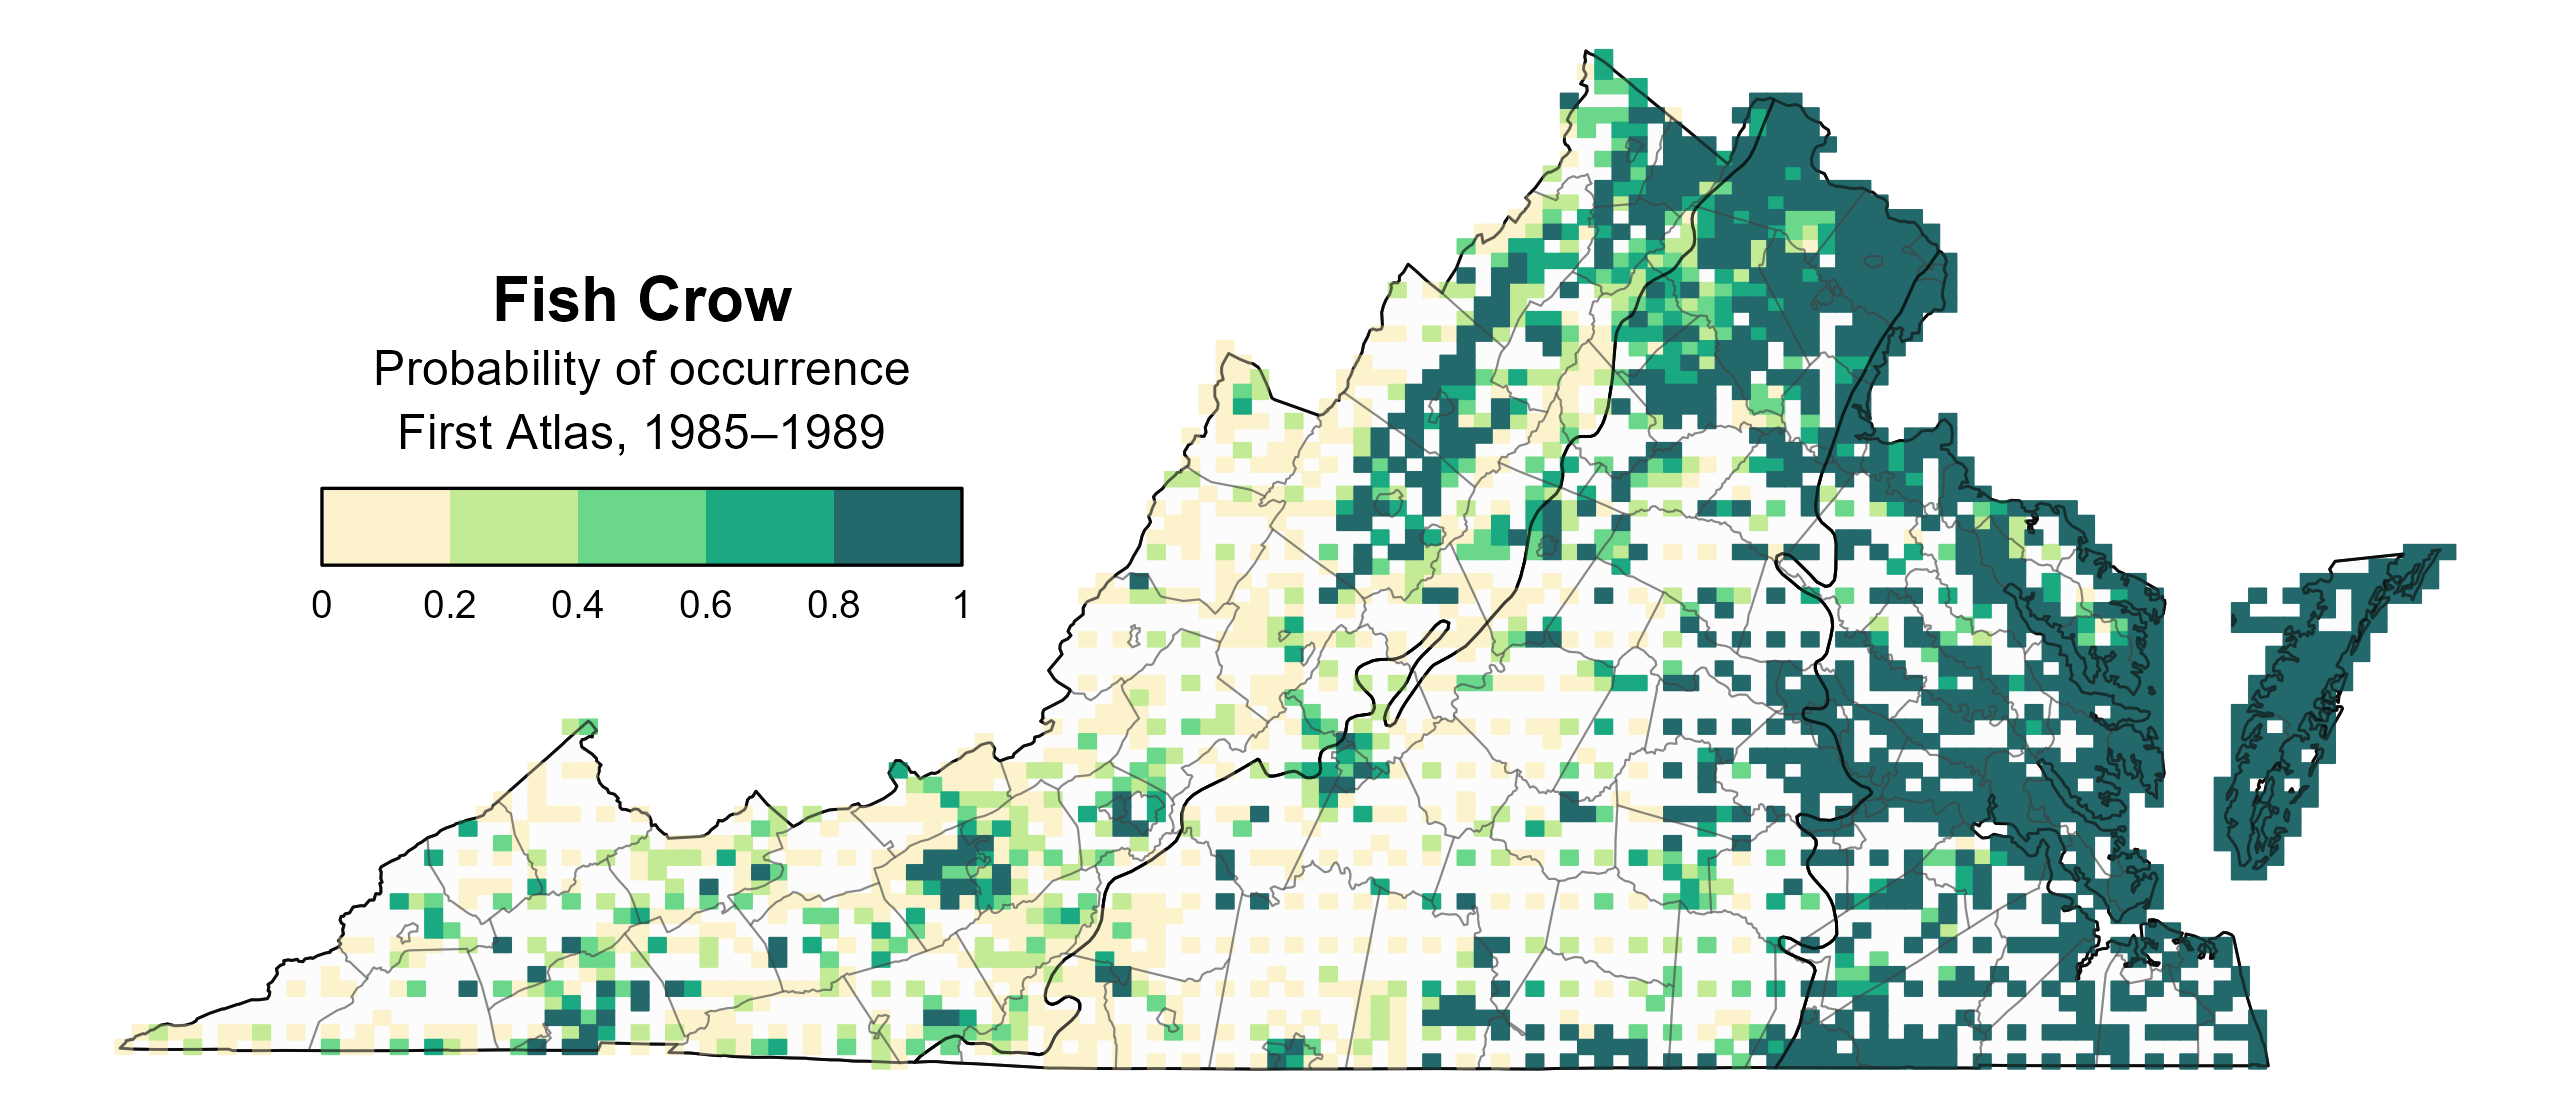
Figure 2: Fish Crow breeding distribution based on probability of occurrence (First Atlas, 1985–1989). This map indicates the probability that this species will occur in an Atlas block (an approximately 10 mi2 [26 km2] survey unit) based on environmental (including habitat) factors and after adjusting for the probability of detection (variation in survey effort among blocks). Blocks in white were not surveyed during the First Atlas and were not modeled.
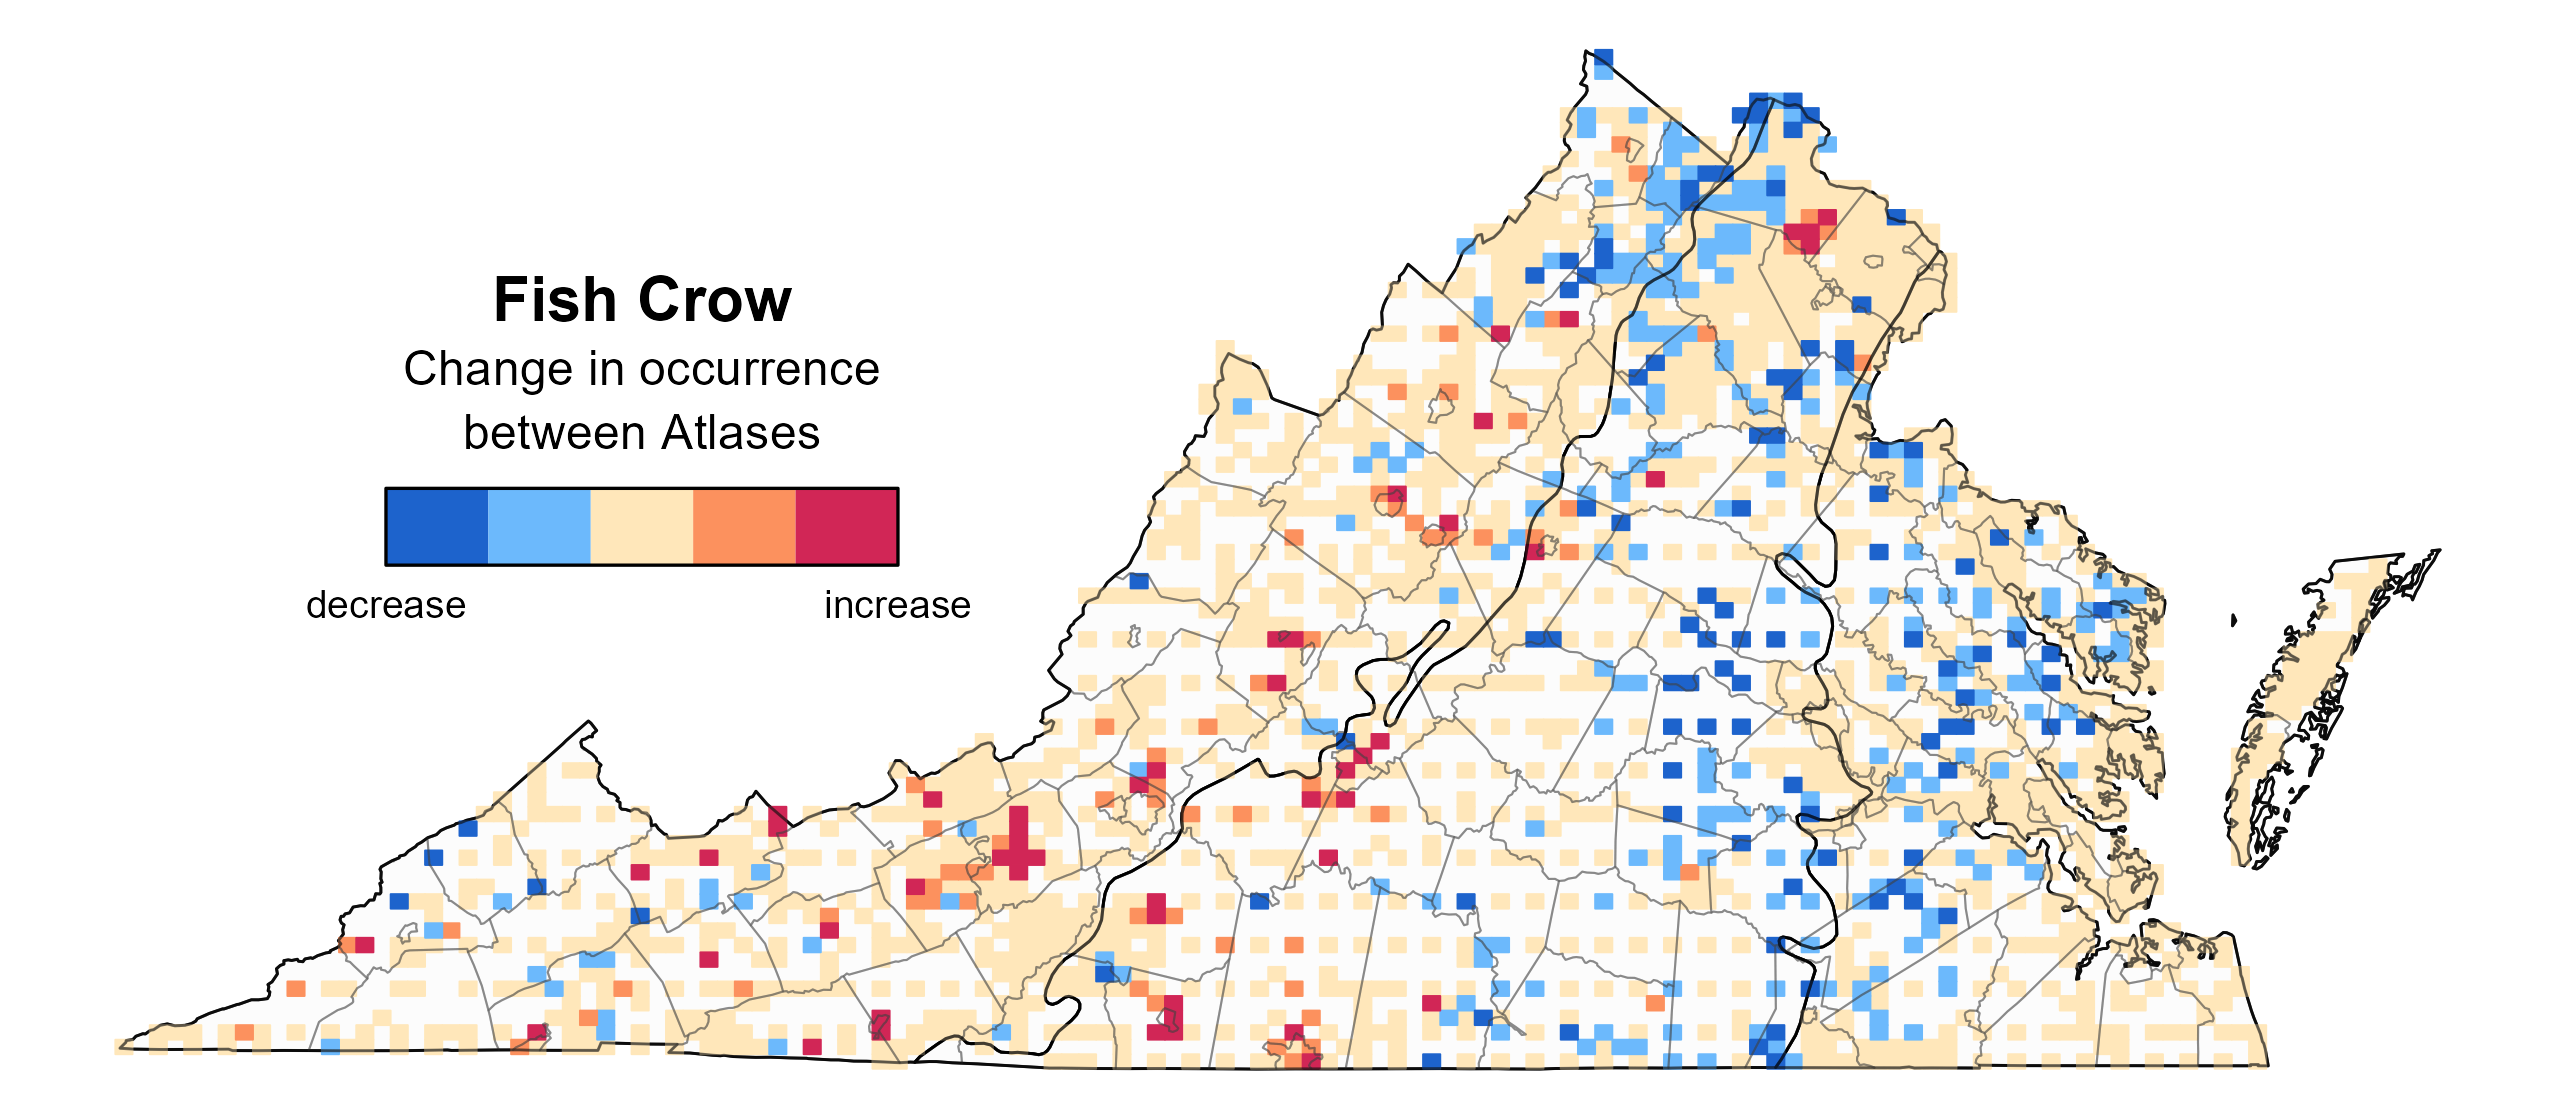
Figure 3: Fish Crow change in breeding distribution between Atlases (1985–1989 and 2016–2020) based on probability of occurrence. This map indicates the change in the probability that this species will occur in a block (an approximately 10 mi2 [26 km2] survey unit) between Atlas periods. Blocks with no change (tan) may have constant presence or constant absence. Blocks in white were not surveyed during the First Atlas and were not modeled.
Breeding Evidence
Fish Crows were confirmed breeders in 191 blocks and 66 counties and probable breeders in another nine counties (Figure 4). Between Atlas periods, Fish Crows appeared as breeders in new areas, particularly in the southwestern Mountains and Valleys region (Bristol city) and southern Piedmont region (including Amherst County, Franklin County, Lynchburg city, Pittsylvania County, Roanoke city, and Roanoke County) (Figures 4 and 5).
Fish Crows began collecting nesting material on March 14. Breeding was confirmed from March 28 (occupied nest) through August 21 (recently fledged young). Fish Crows typically nest one month later than American Crows (Clapp and Banks 1993), a finding supported by data from the Second Atlas. No nests with eggs were observed during the Second Atlas (Figure 6). For more general information on the breeding habits of the American Crow, please refer to All About Birds.
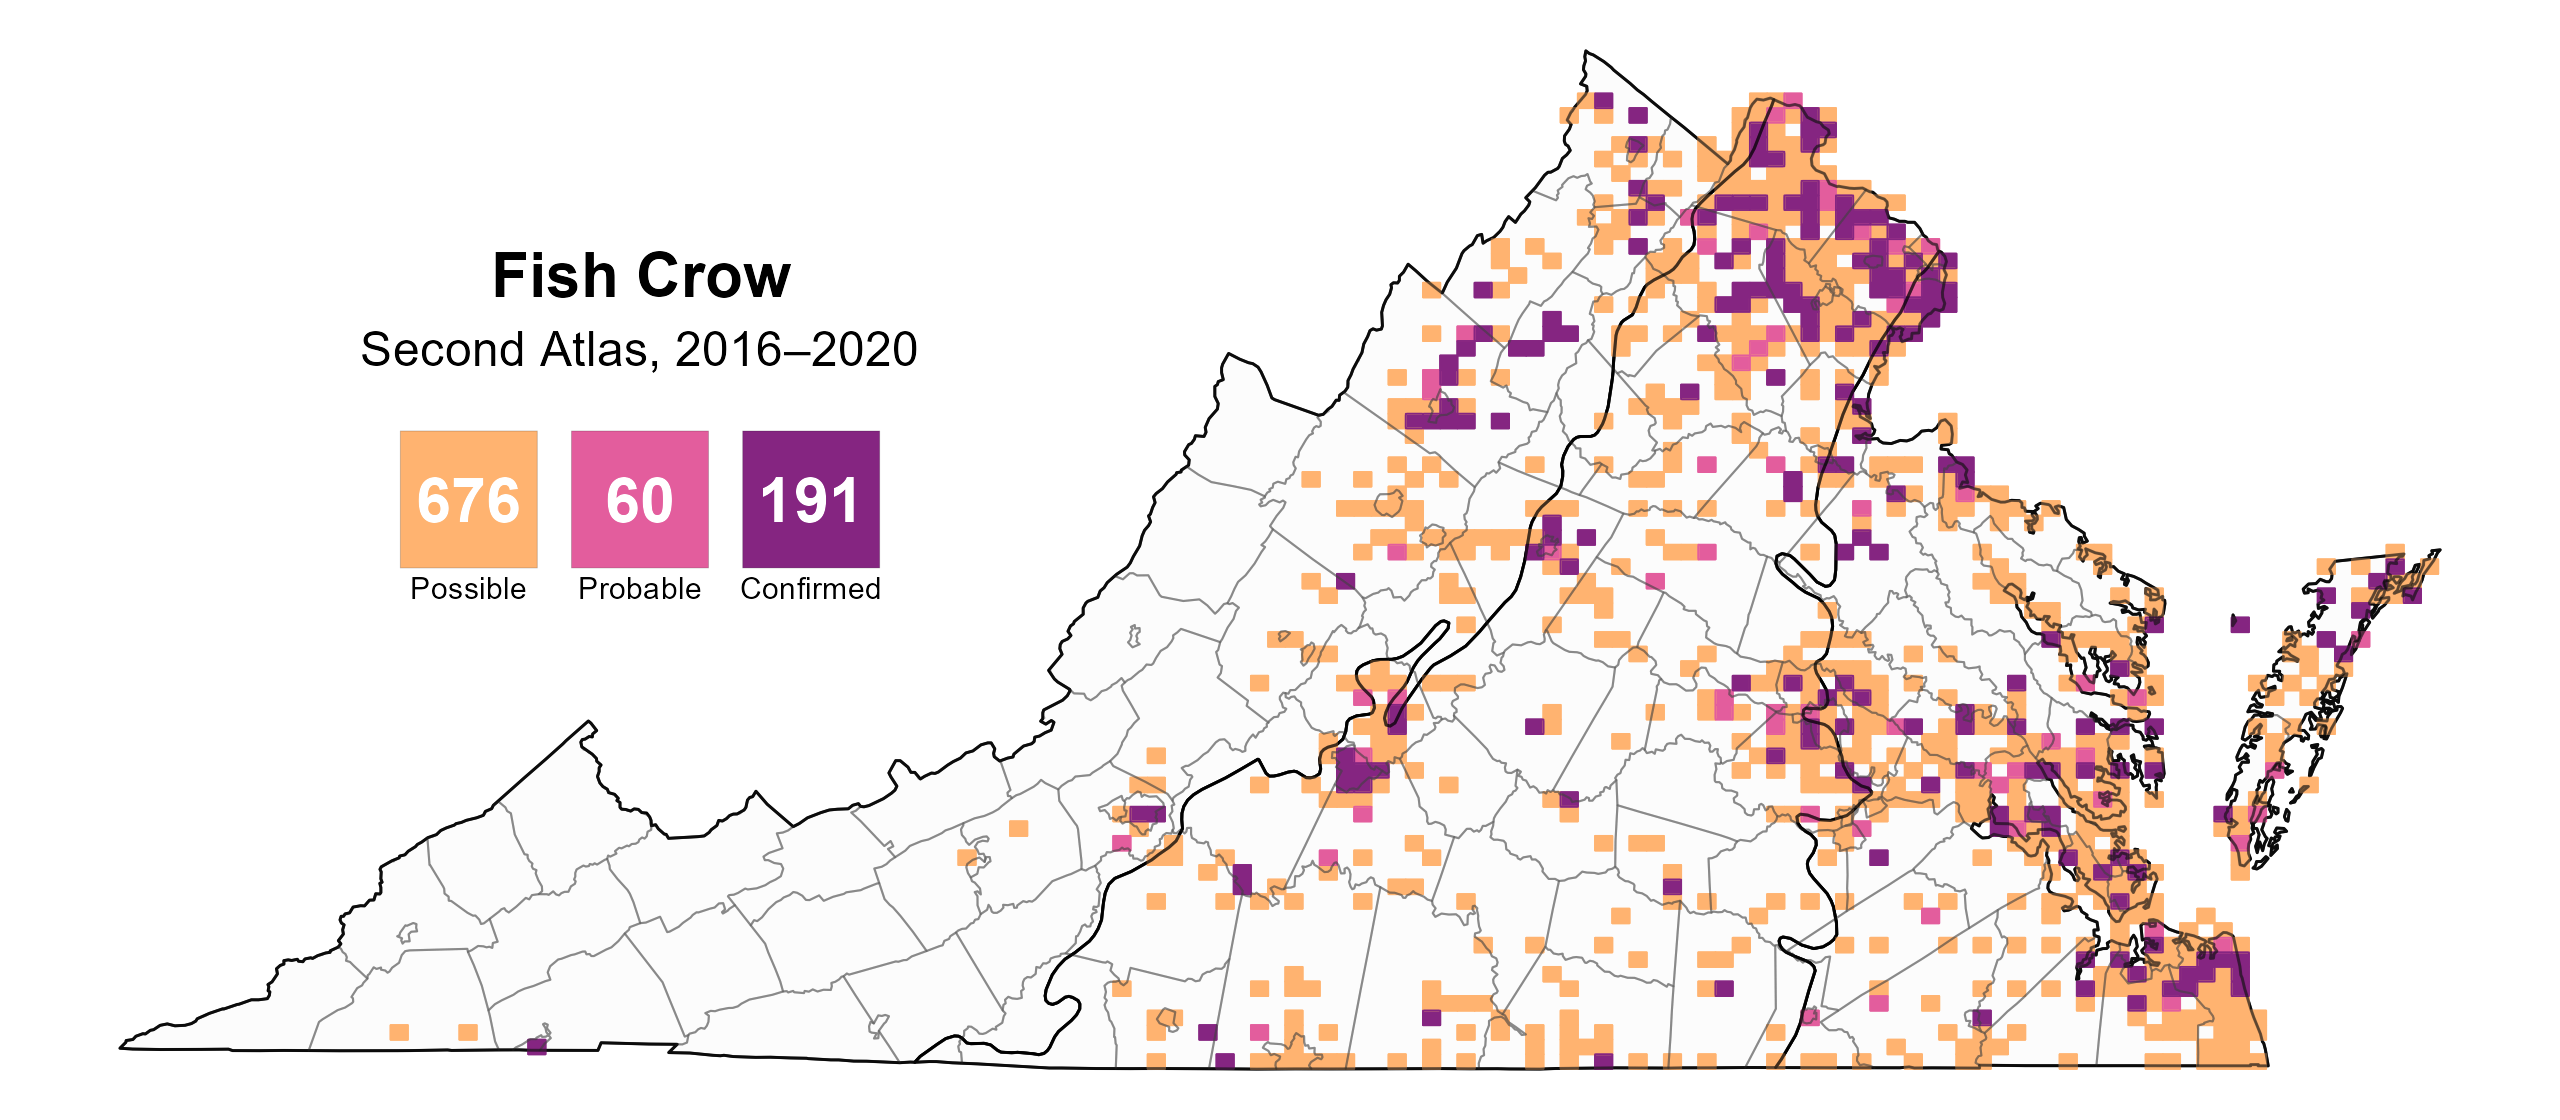
Figure 4: Fish Crow breeding observations from the Second Atlas (2016–2020). The colored boxes illustrate Atlas blocks (approximately 10 mi2 [26 km2] survey units) where the species was detected. The colors show the highest breeding category recorded in a block. The numbers within the colors in the legend correspond to the number of blocks with that breeding evidence category.
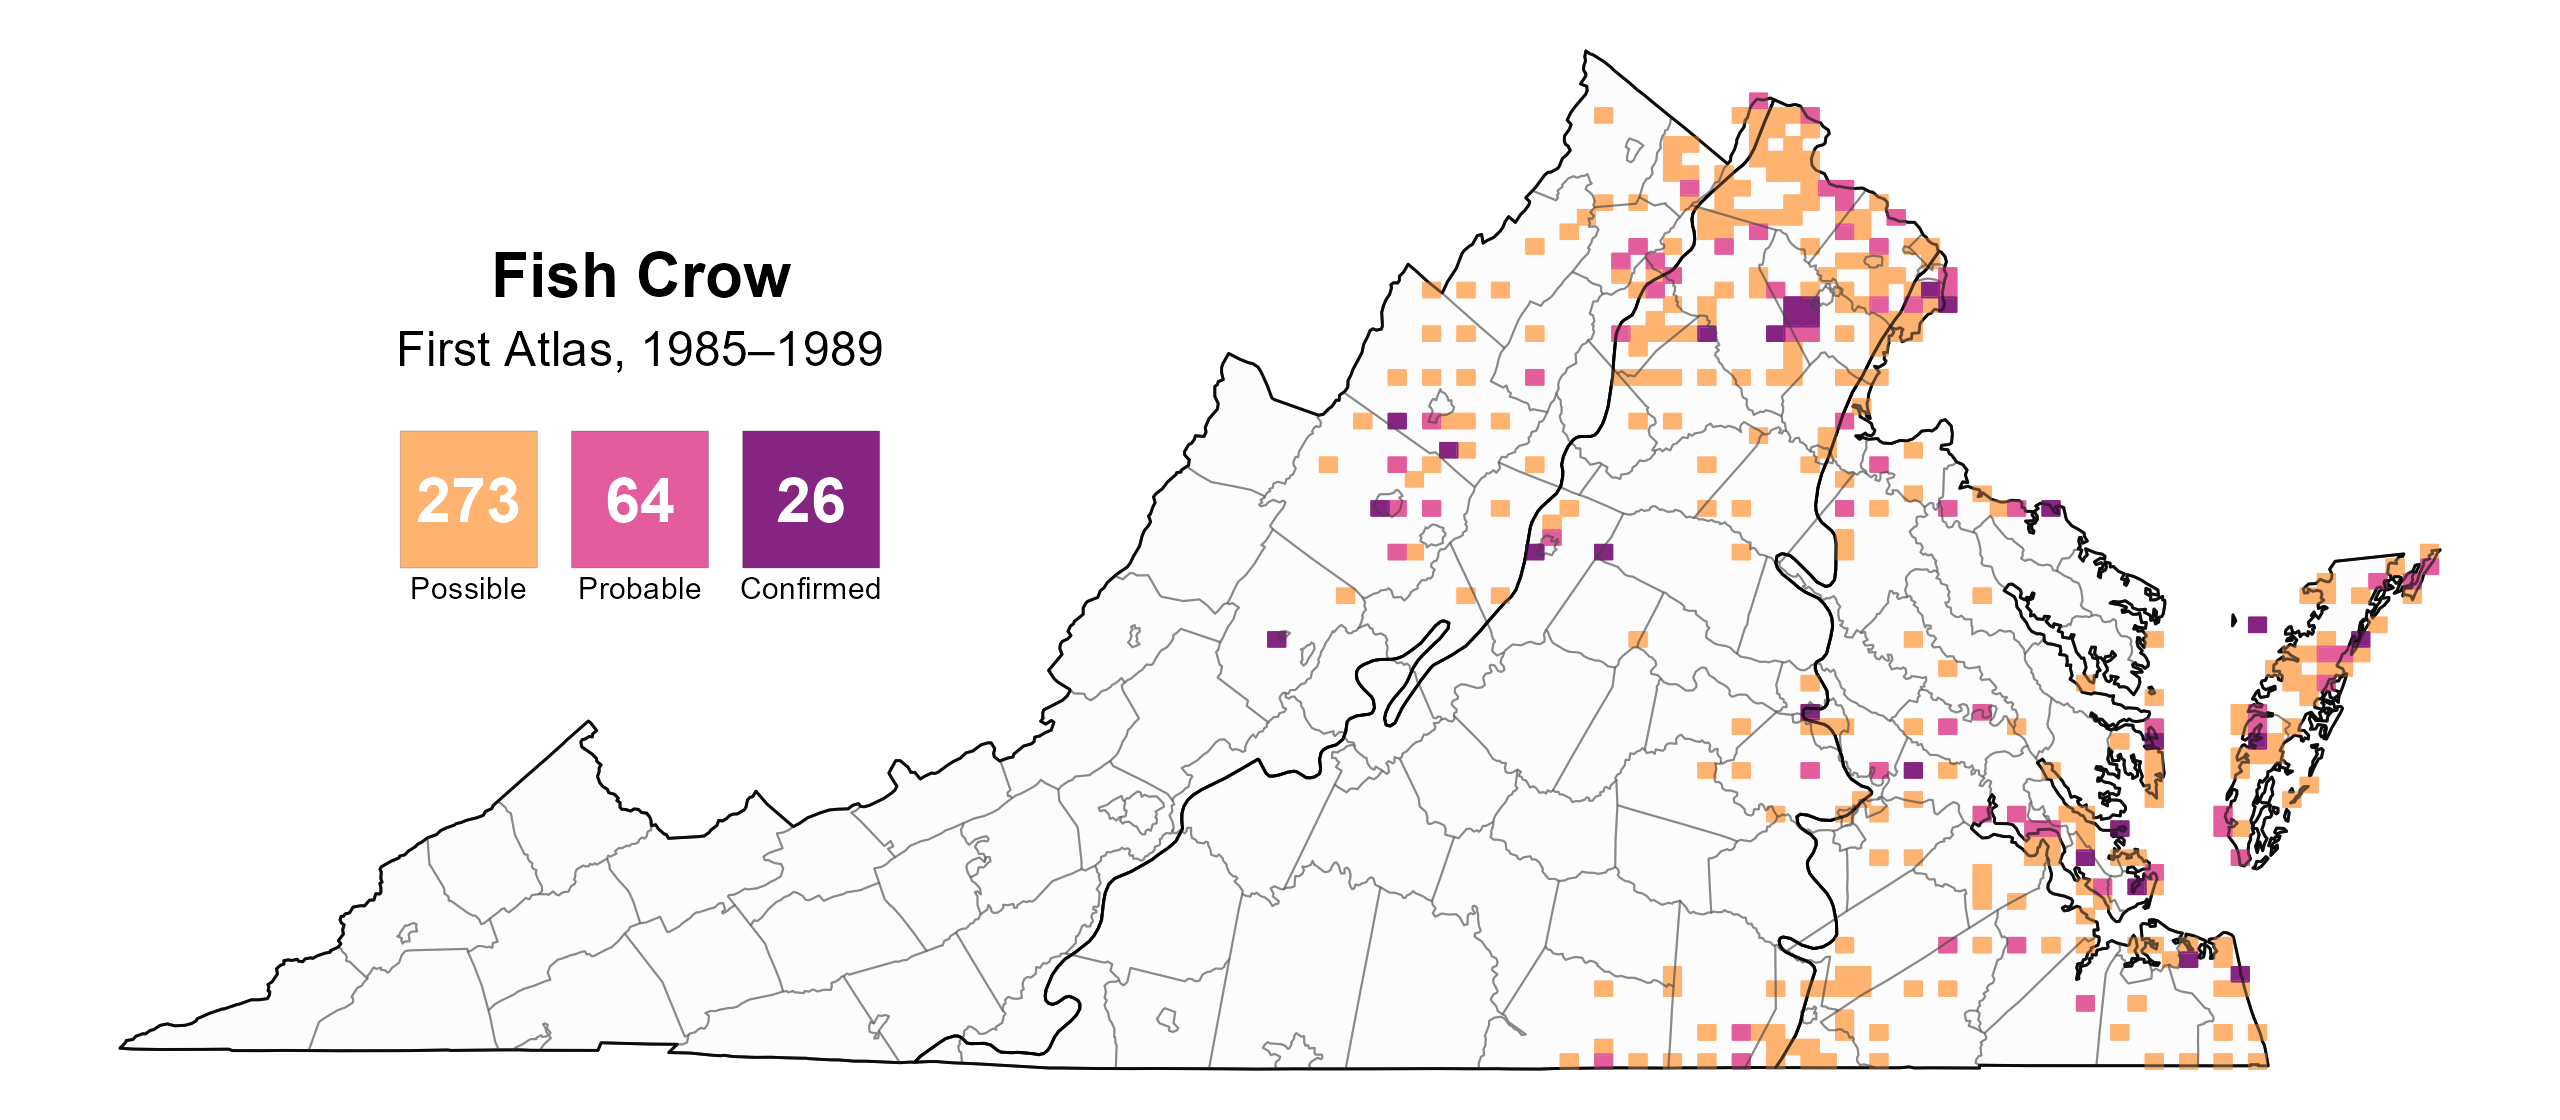
Figure 5: Fish Crow breeding observations from the First Atlas (1985–1989). The colored boxes illustrate Atlas blocks (approximately 10 mi2 [26 km2] survey units) where the species was detected. The colors show the highest breeding category recorded in a block. The numbers within the colors in the legend correspond to the number of blocks with that breeding evidence category.
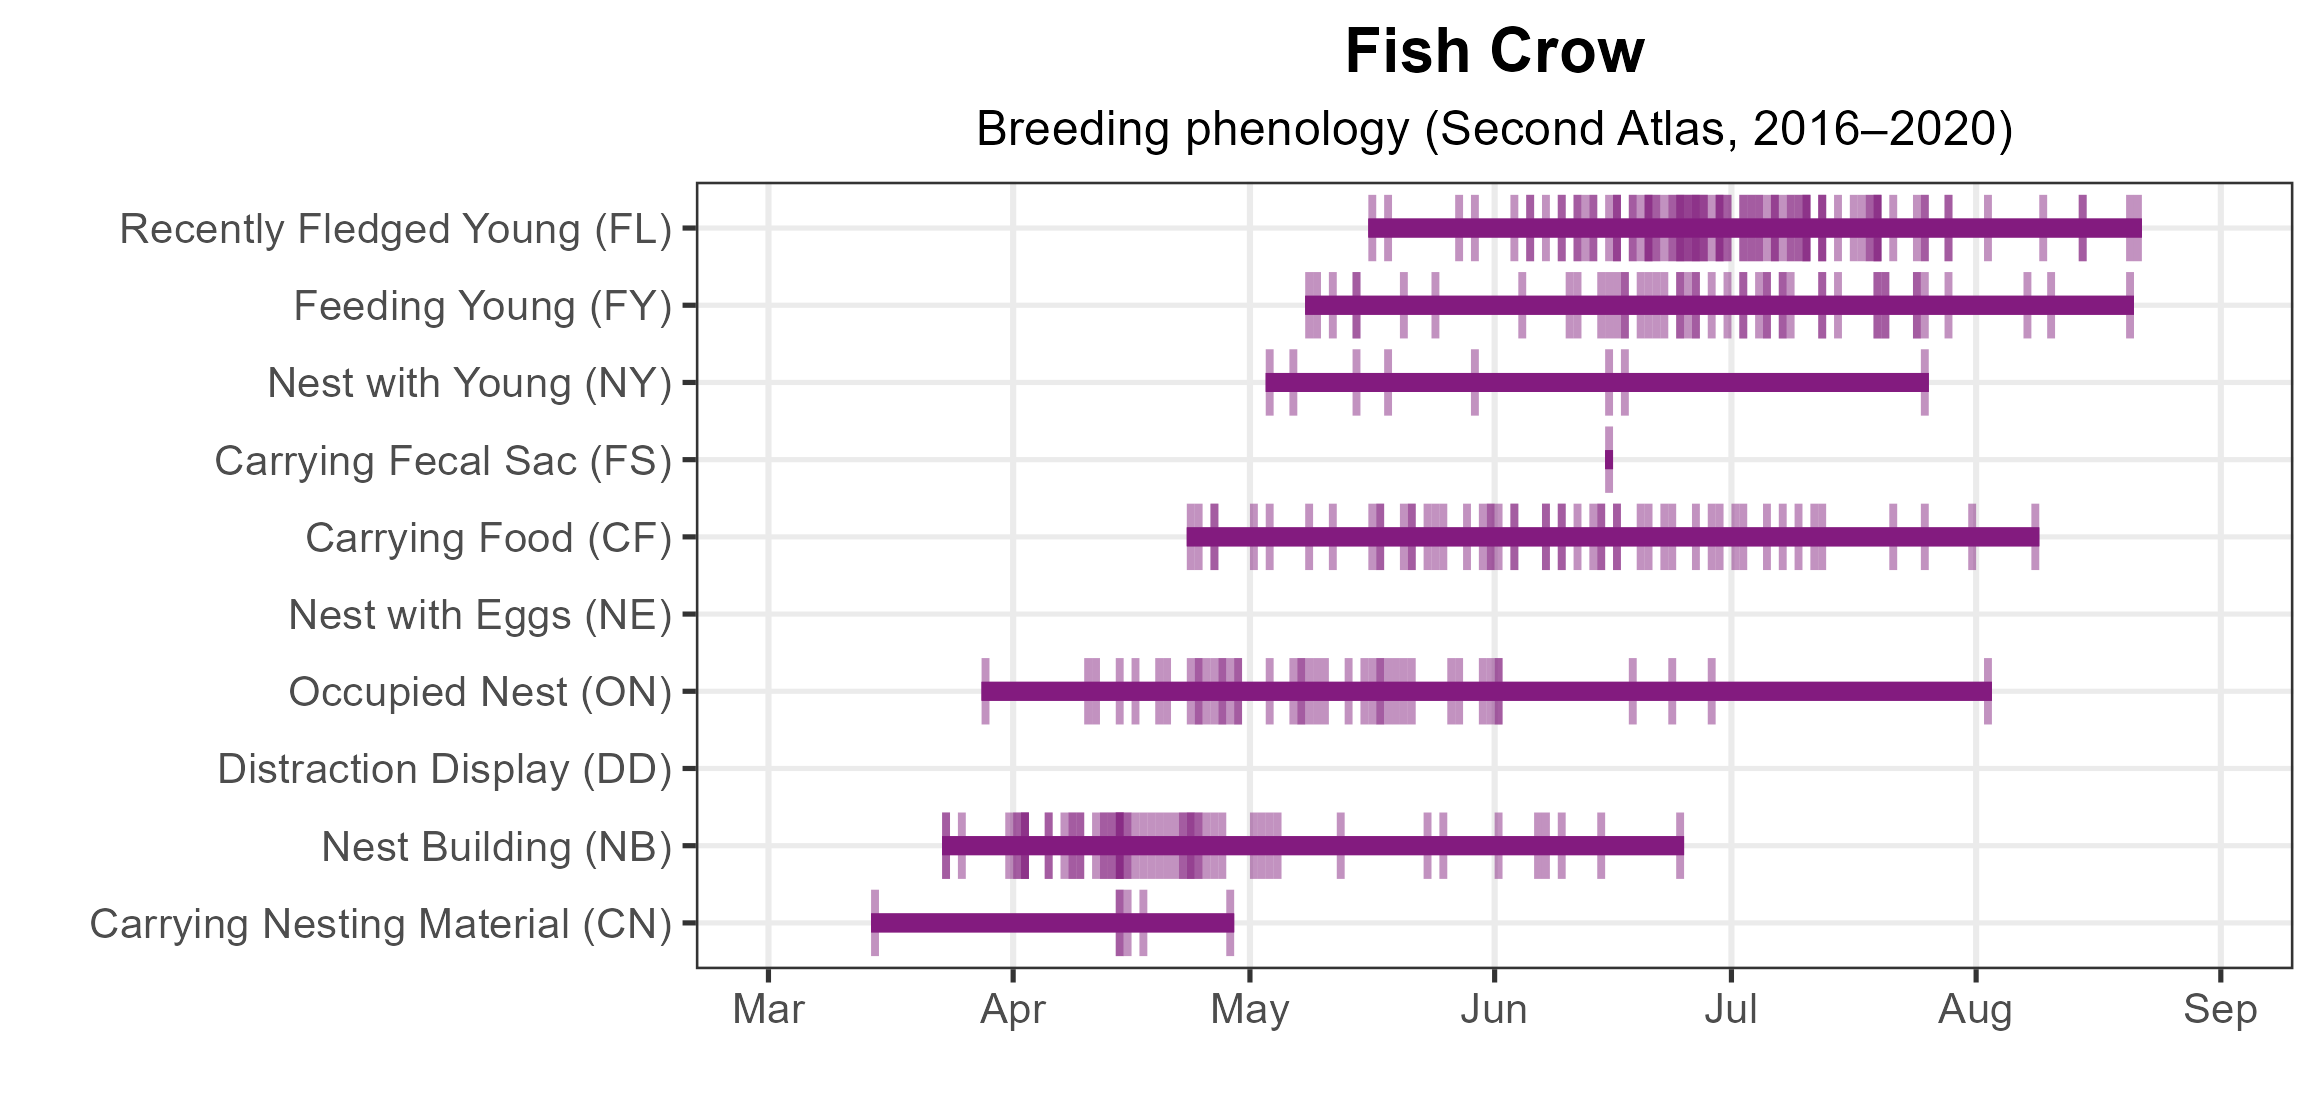
Figure 6: Fish Crow phenology: confirmed breeding codes. This graph shows a timeline of confirmed breeding behaviors. Tick marks represent individual observations of the behavior.
Population Status
Fish Crow relative abundance was estimated to be low throughout most of Virginia, with their highest abundance levels occurring in the southeastern Coastal Plain region and northern Piedmont (Figure 7). Predicted abundance was also higher in urban areas, such as Charlottesville, Harrisonburg, Richmond, Roanoke, and Winchester, relative to their surrounding areas. Otherwise, the species was more abundant near the coast and along waterways.
The total estimated Fish Crow population in the state is approximately 97,000 individuals (with a range between 44,000 and 224,000). Population trends for the species are stable to increasing in Virginia. Based on North American Breeding Bird Survey (BBS) data, the species experienced a nonsignificant increase of 1.56% per year from 1966–2022 (Hostetler et al. 2023; Figure 8). Between Atlas periods, the BBS trend for Virginia was positive, with a significant increase of 2.06% per year from 1987–2018. The causes of the range-wide increases in Fish Crow abundance are not well understood (McGowan 2020).
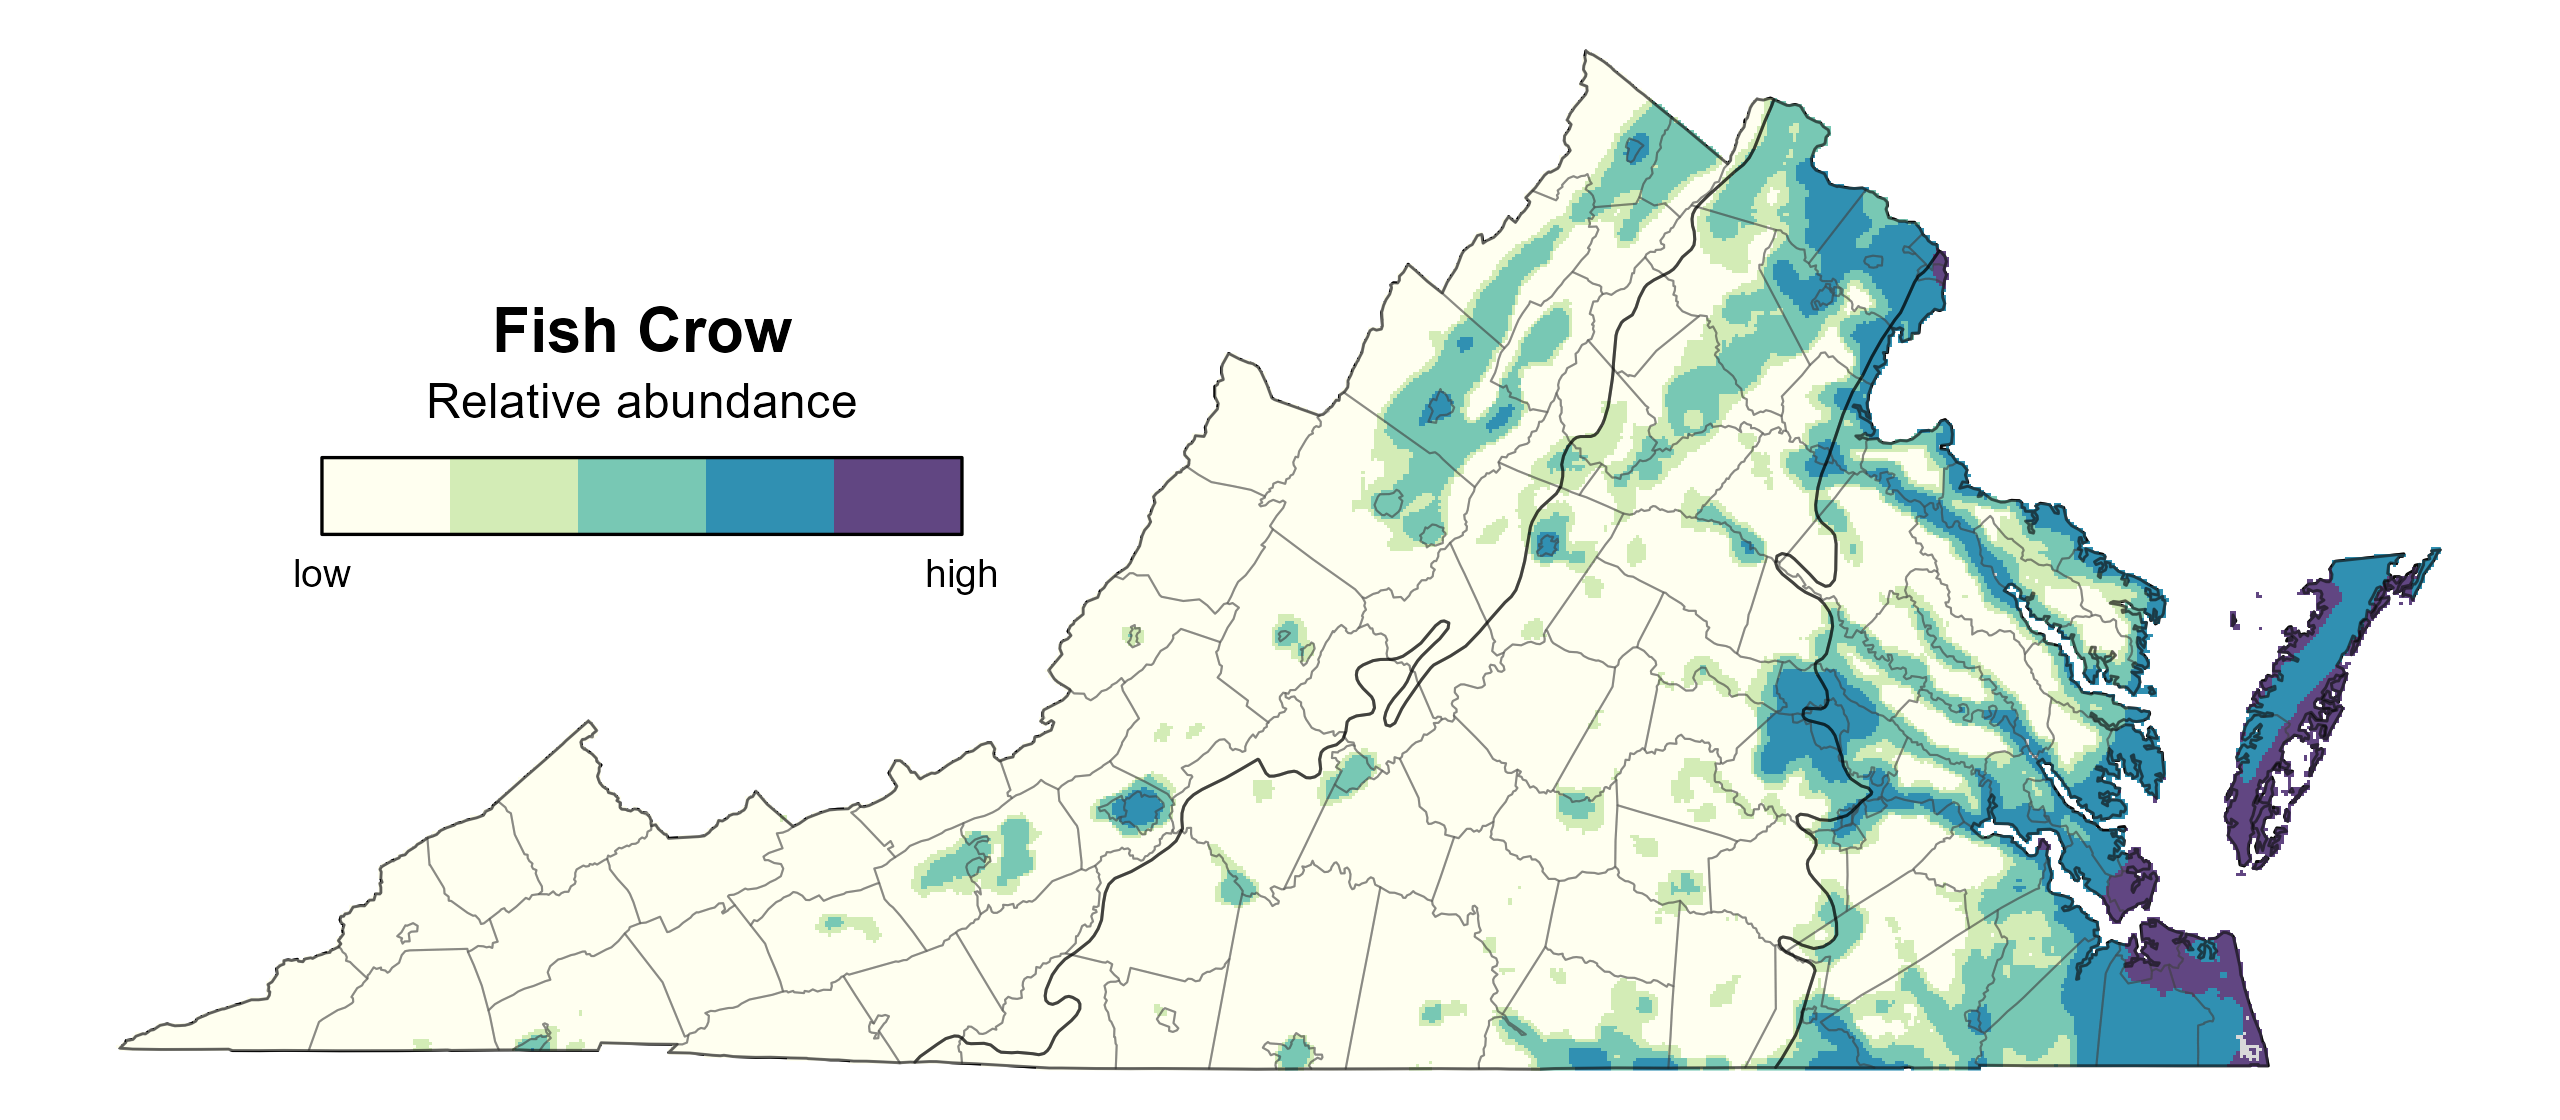
Figure 7: Fish Crow relative abundance (Second Atlas, 2016–2020). This map indicates the predicted abundance of this species at a 0.4 mi2 (1 km2) scale based on environmental (including habitat) factors. Abundance values are presented on a relative scale of low to high.
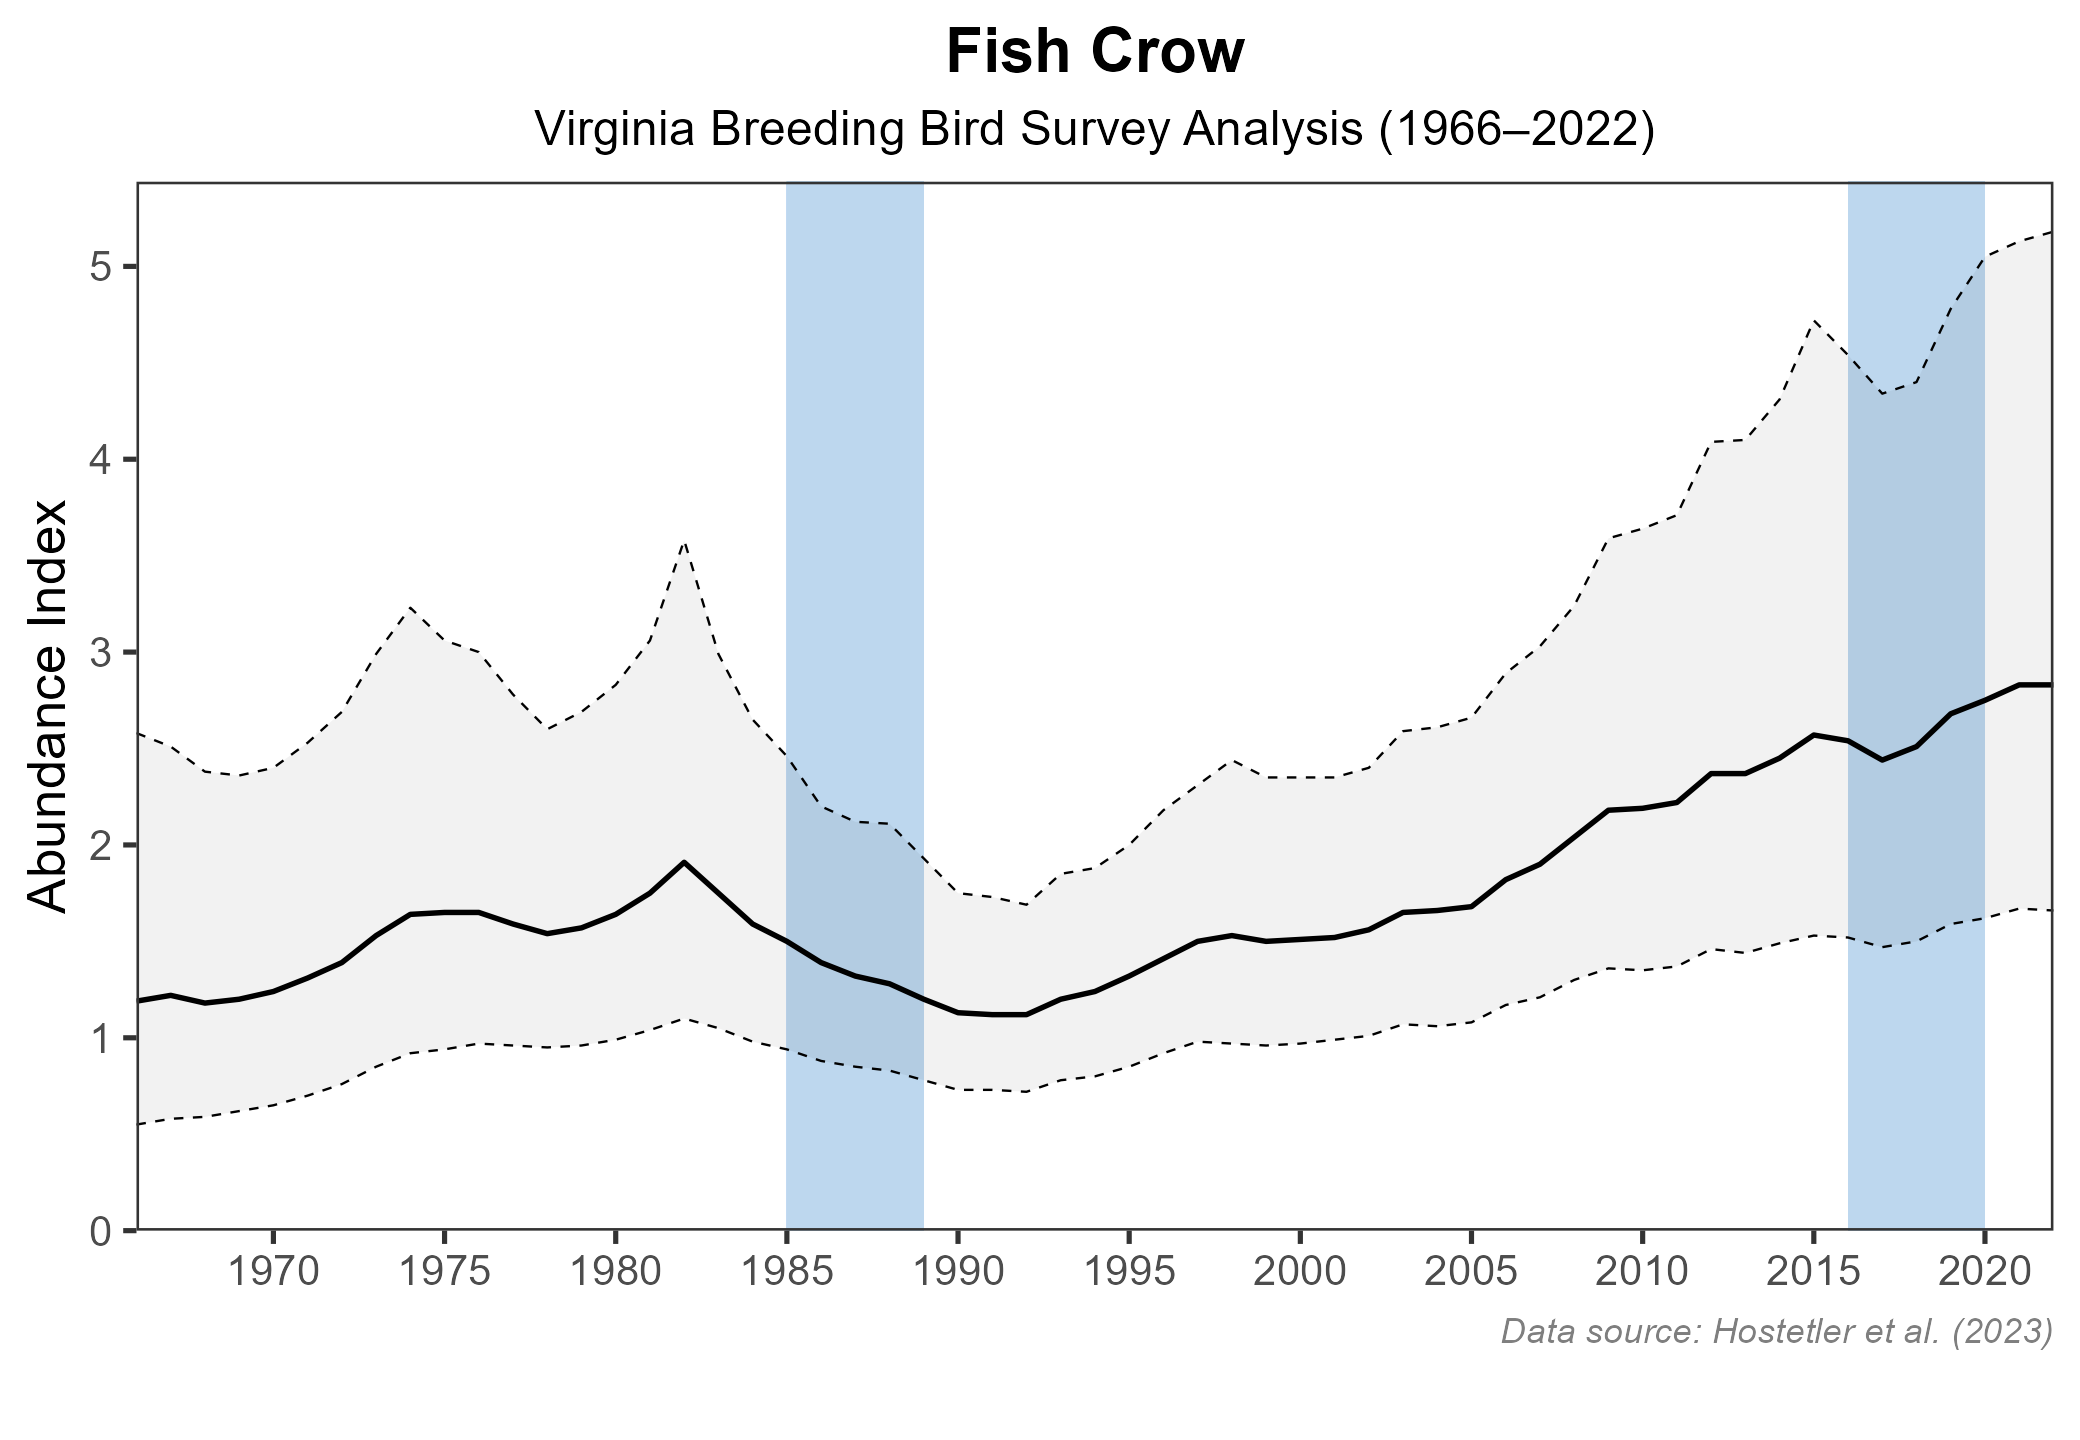
Figure 8: Fish Crow population trend for Virginia as estimated by the North American Breeding Bird Survey. The vertical axis shows species abundance; the horizontal axis shows the year. The solid line indicates the estimated population trend; there is a 97.5% probability that the true population trend falls between the dashed lines. The shaded bars indicate the First and Second Atlas periods.
Conservation
Fish Crow populations appear secure, and the species is not the focus of any specific conservation efforts in the state. As Fish Crow populations increase, conflicts may occur where Fish Crows eat eggs of threatened species such as Least Tern (Sternula antillarum) (McGowan 2020). Fish Crows are legally hunted in Virginia. There is a small game season for American and Fish Crows, and these two species are the only migratory game birds that do not require a special permit (Virginia Department of Wildlife Resources, n.d.).
Interactive Map
The interactive map contains up to six Atlas layers (probability of occurrence for the First and Second Atlases, change in probability of occurrence between Atlases, breeding evidence for the First and Second Atlases, and abundance for the Second Atlas) that can be viewed one at a time. To view an Atlas map layer, mouse over the layer box in the upper left. County lines and physiographic regional boundaries (Mountains and Valleys, Piedmont, and Coastal Plain) can be turned on and off by checking or unchecking the box below the layer box. Within the map window, users can hover on a block to see its value for each layer and pan and zoom to see roads, towns, and other features of interest that are visible beneath a selected layer.
View Interactive Map in Full Screen
References
Caffrey, C., S. C. R. Smith, and T. J. Weston (2005). West Nile Virus devastates an American Crow population. The Condor 107:128–32. https://doi.org/10.1093/condor/107.1.128.
Clapp, R. B., and R. C. Banks (1993). Nesting seasons, nest sites, and clutch sizes of crows in Virginia. The Raven 62:90–89.
Fujisaki, I., E. V. Pearlstine, and M. Miller (2008). Detecting population decline of birds using long-term monitoring data. Population Ecology 50:275–284. https://doi.org/10.1007/s10144-008-0083-7.
Hostetler, J. A., J. R. Sauer, J. E. Hines, D. Ziolkowski, and M. Lutmerding (2023). The North American breeding bird survey, analysis results 1966–2022. U.S. Geological Survey, Laurel, MD, USA. https://doi.org/10.5066/P9SC7T11.
McGowan, K. J. (2020). Fish Crow (Corvus ossifragus), version 1.0. In Birds of the World (A. F. Poole and F. B. Gill, Editors). Cornell Lab of Ornithology, Ithaca, NY, USA. https://doi.org/10.2173/bow.fiscro.01.
Rottenborn, S. C., and E. S. Brinkley (Editors) (2007). Virginia’s birdlife: an annotated checklist. 4th edition. Virginia Society of Ornithology.
Virginia Department of Wildlife Resources. n.d. Small game hunting regulations and seasons. https://dwr.virginia.gov/hunting/regulations/smallgame/. Accessed March 25, 2024.