Introduction
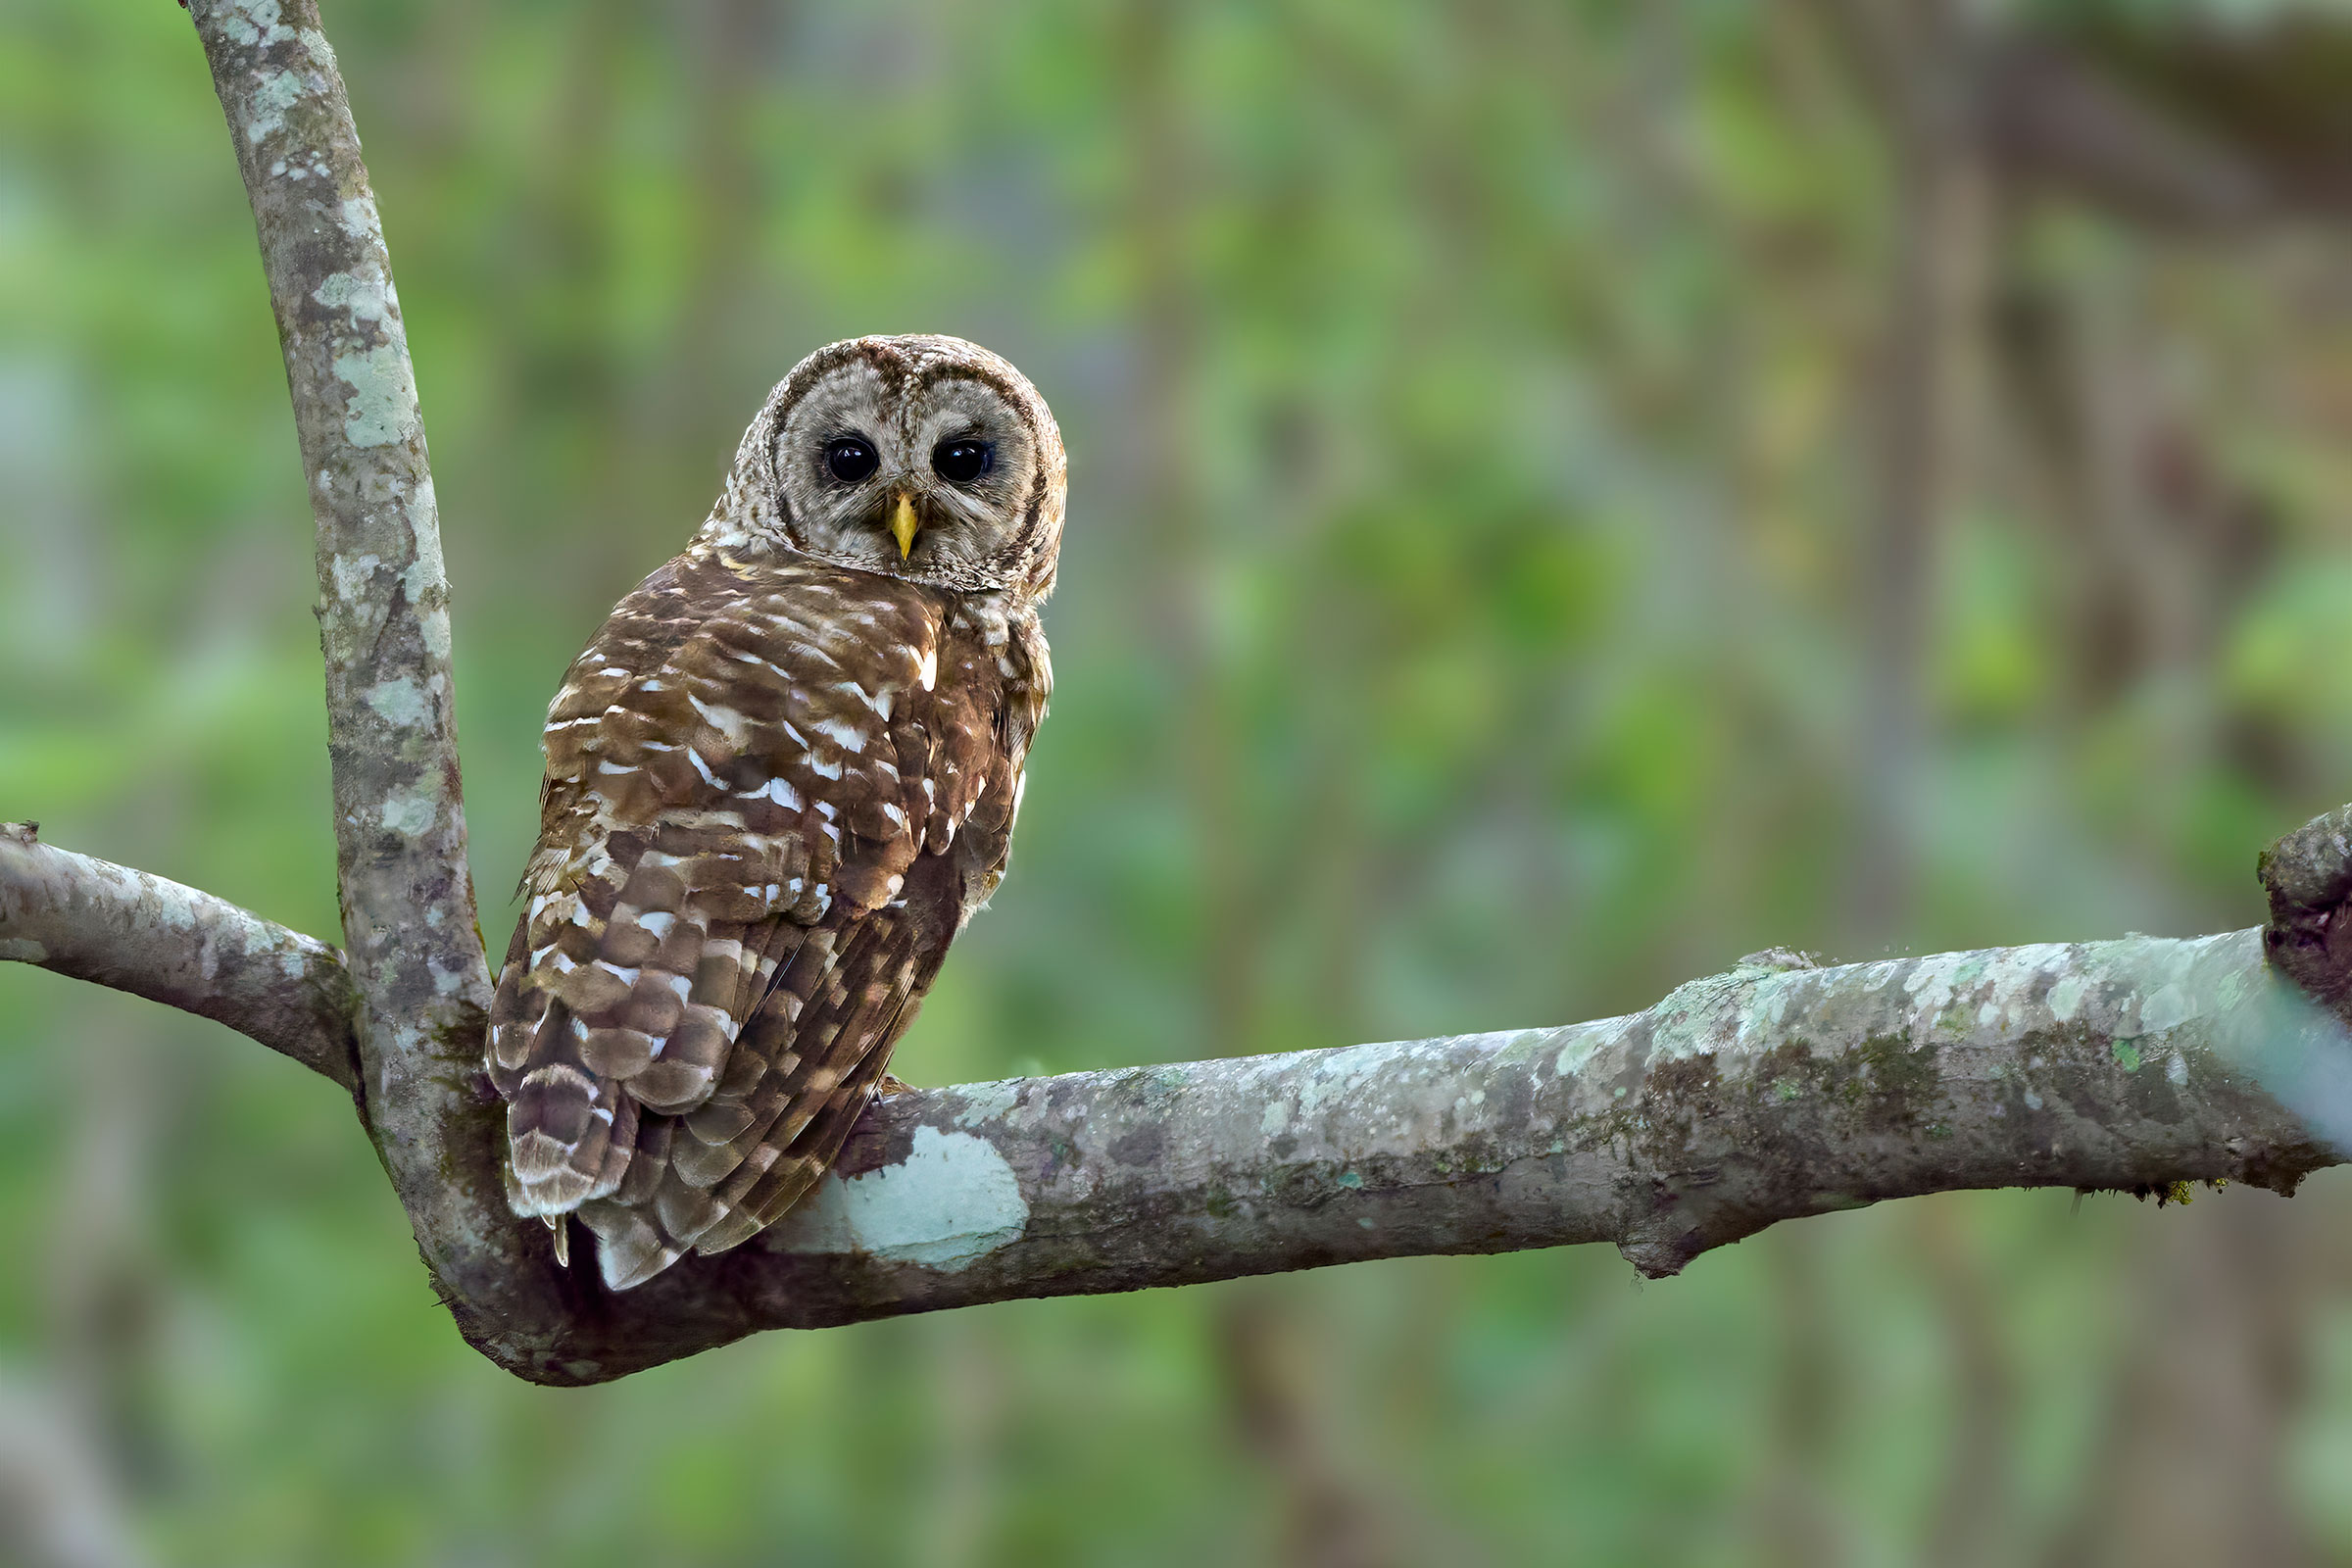
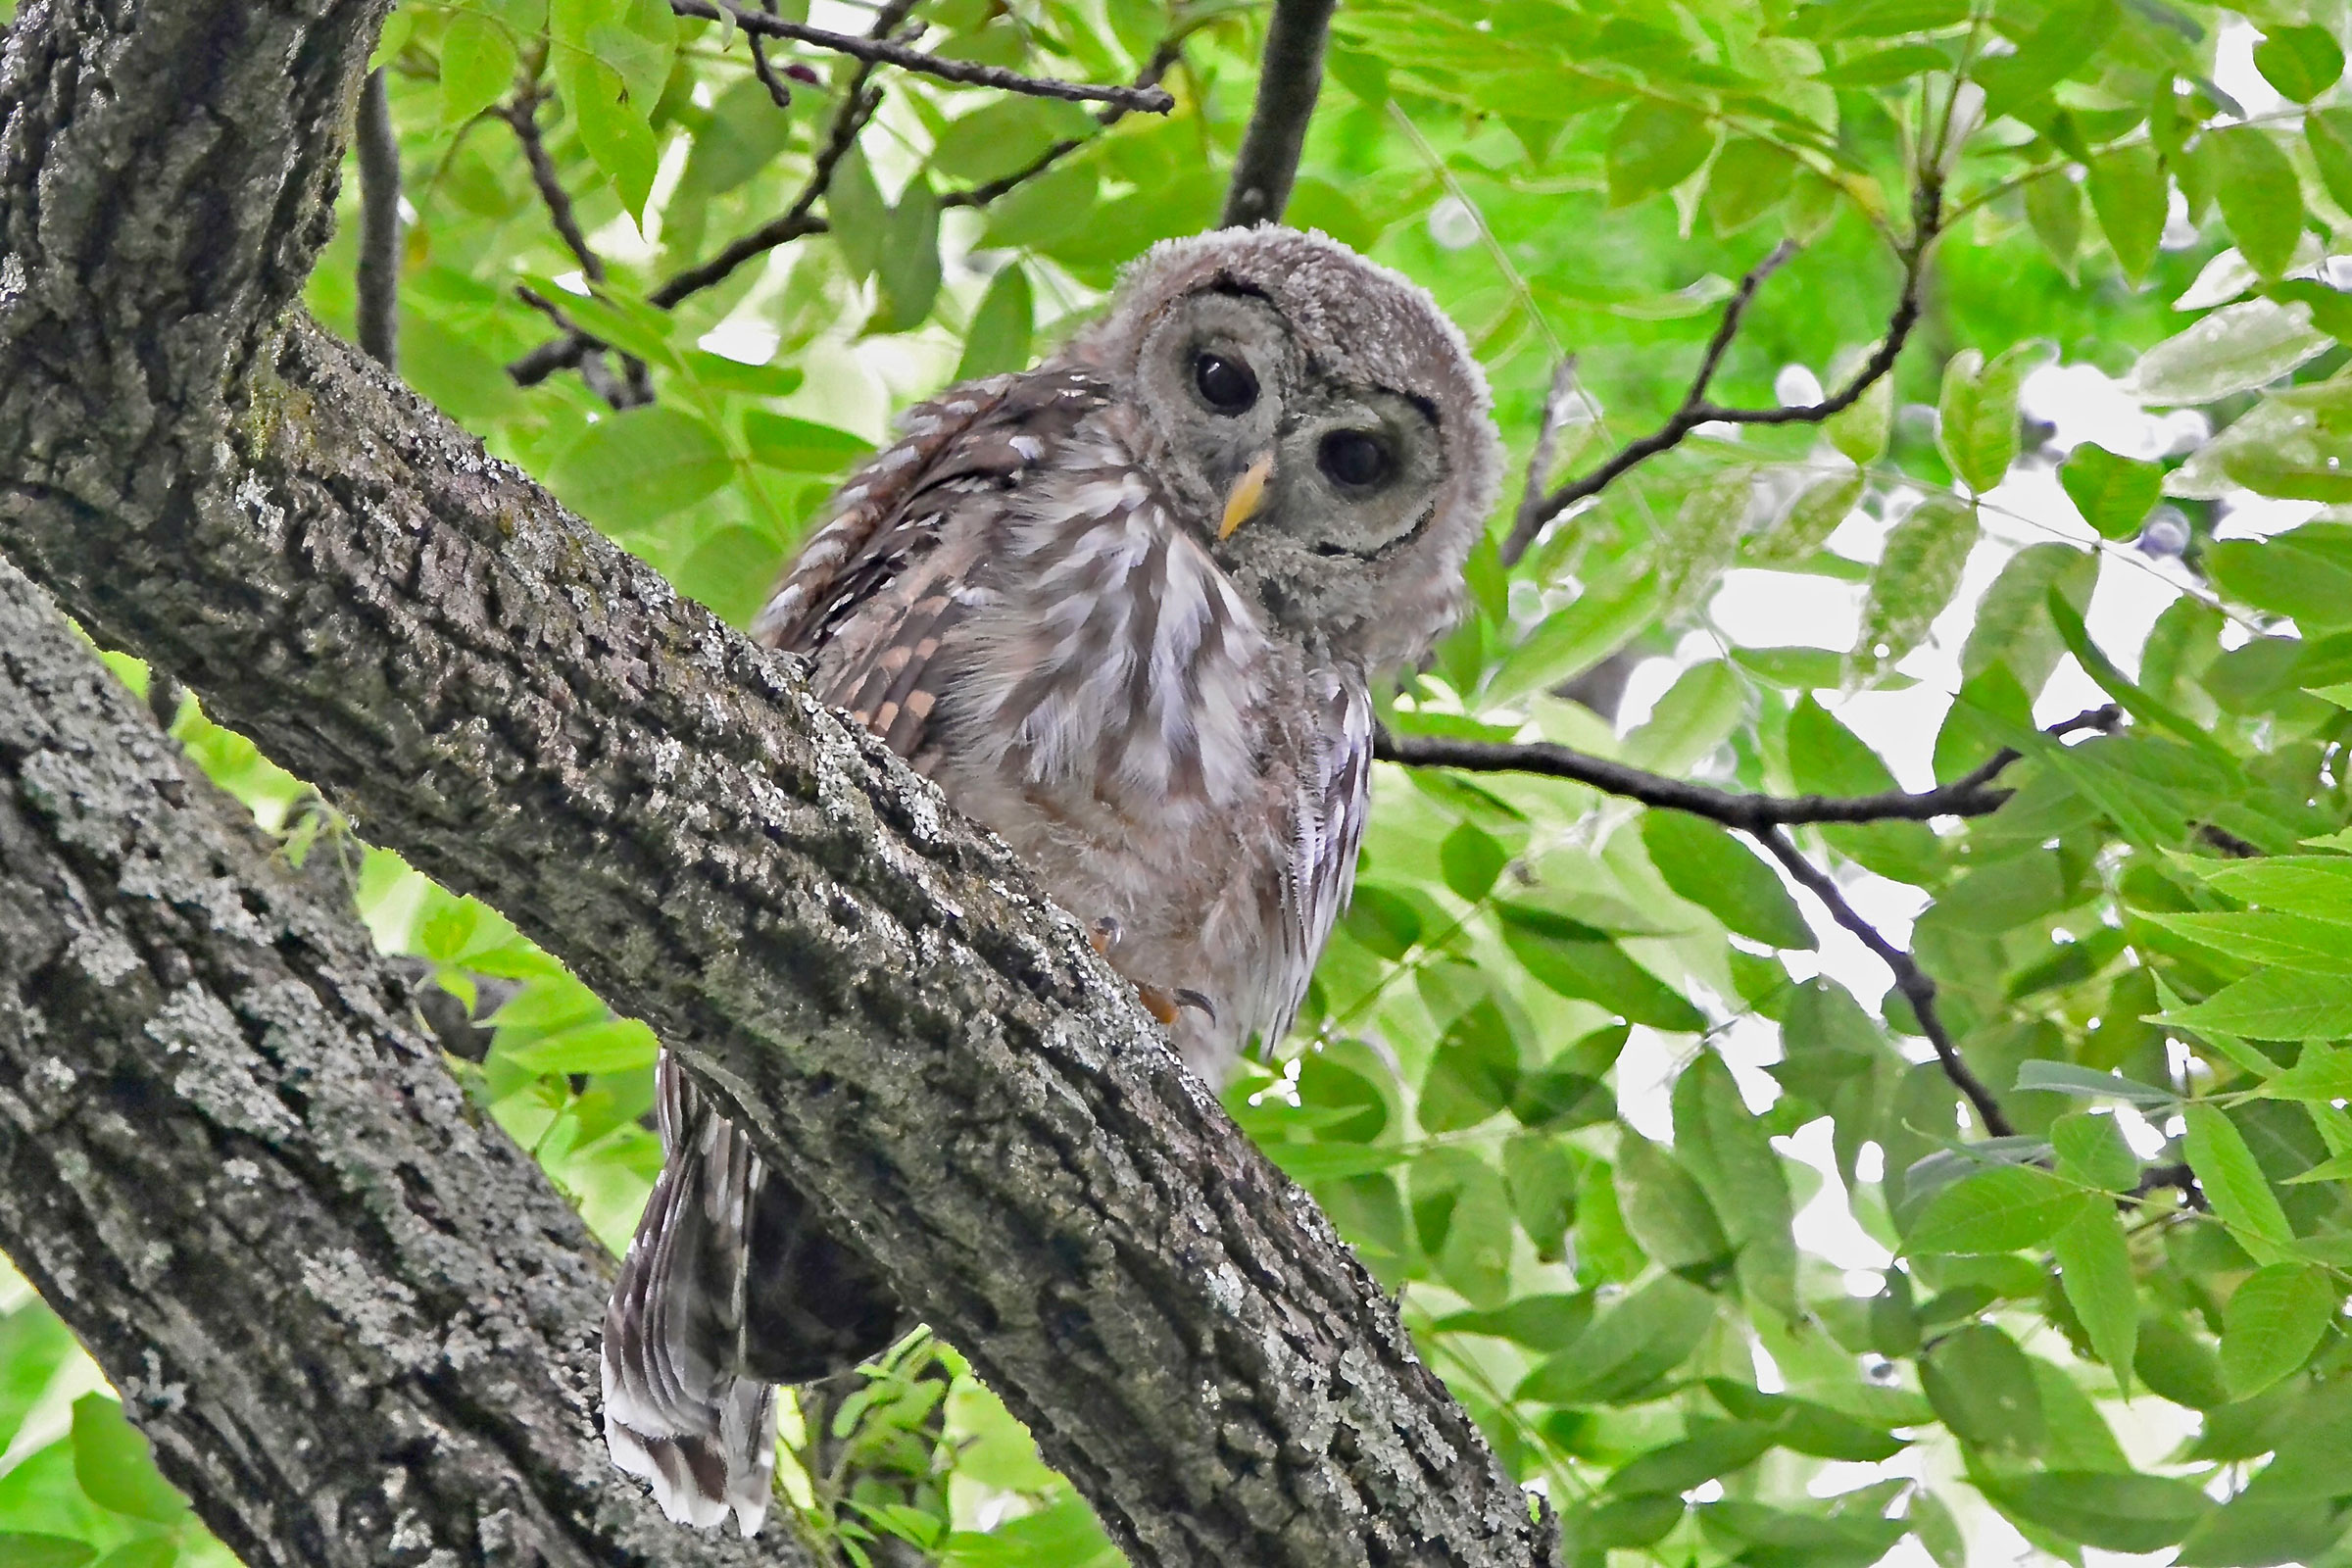
Of the three most common owls in Virginia, including Eastern Screech-Owl (Megascops asio) and Great-horned Owl (Bubo virginianus), the Barred Owl is the most likely to be seen during the day. This is a forest-dwelling, semi-nocturnal species that sometimes roosts in the open and can be seen hunting near twilight (Bierregaard et al. 2024). Its distinctive eight-note hooting call Who cooks for you? Who cooks for you-all? carries far through the forest and is easy to remember and imitate. During courtship, Barred Owl pairs can perform raucous and occasionally demon-like cackles, hoots, caws and gurgles that can puzzle, even alarm, campers.
Breeding Distribution
The Barred Owl occurs throughout Virginia. However, it is less likely to be found in the highly urbanized areas of the northern Piedmont and Hampton Roads-Virginia Beach regions, on the largely agricultural Eastern Shore, and in open habitats in the valleys of the Mountains and Valley region (Figure 1). In fact, given its preference for forested habitat, the likelihood of this owl occurring in a block increases as both forest cover and forest edges increase. Barred Owls are known to breed in a variety of forest areas, ranging from mature forests to suburban settings (Bierregaard et al. 2024). The species is also less likely to occur in blocks with a higher proportion of agricultural lands, including row crops, pastures, and hayfields.
Between the First and Second Atlases (Figures 1 and 2), the likelihood of Barred Owl presence remained relatively constant across the major regions of the state (Figure 3).
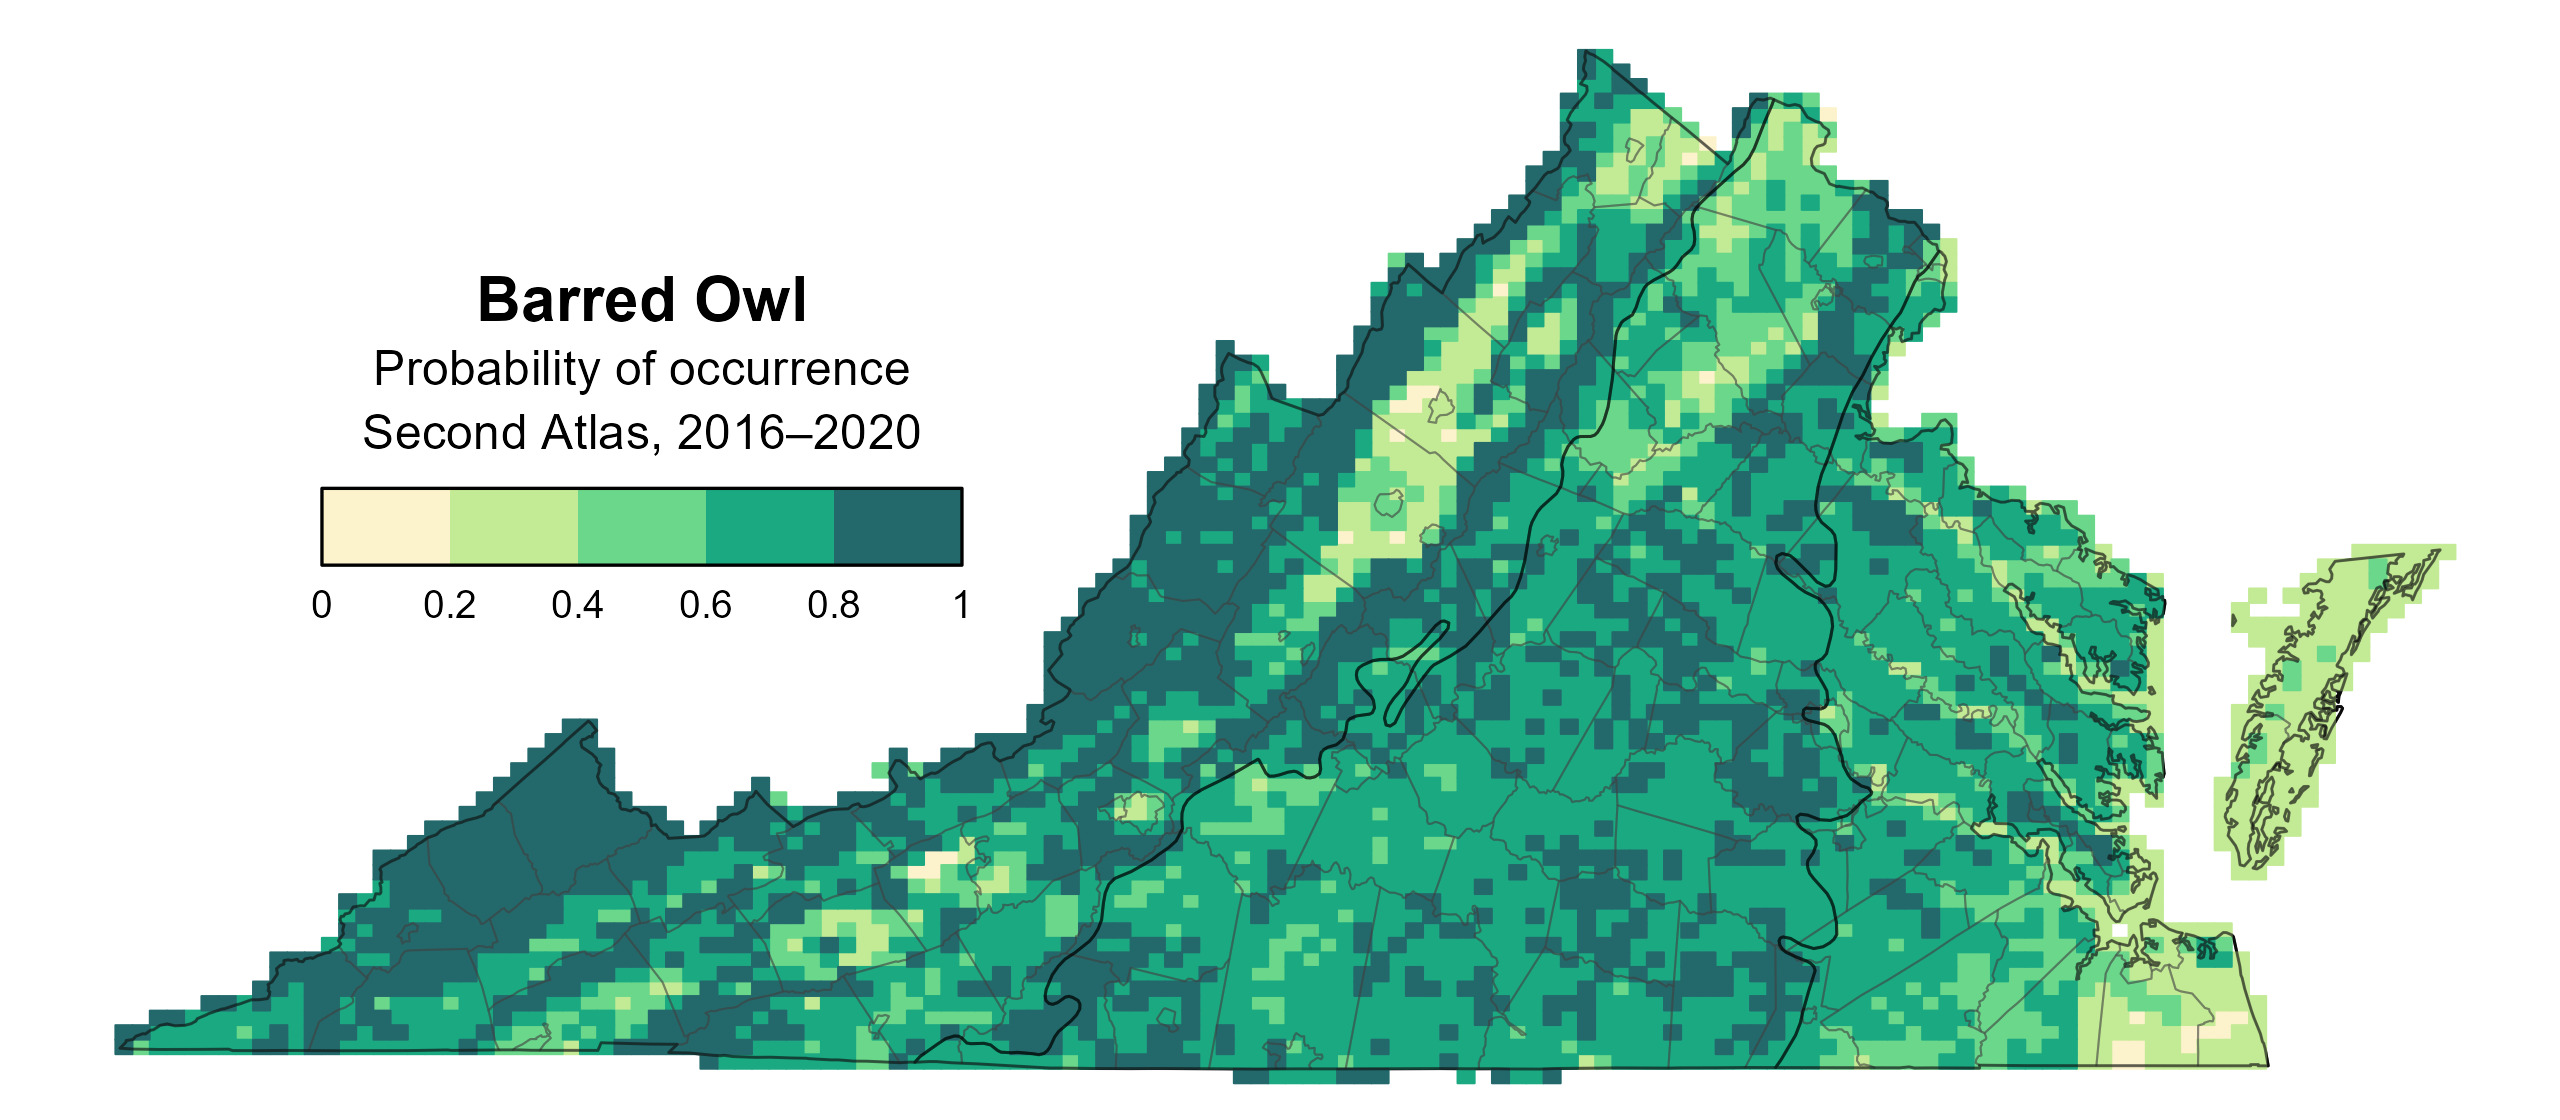
Figure 1: Barred Owl breeding distribution based on probability of occurrence (Second Atlas, 2016–2020). This map indicates the probability that this species will occur in an Atlas block (an approximately 10 mi2 [26 km2] survey unit) based on environmental (including habitat) factors and after adjusting for the probability of detection (variation in survey effort among blocks).
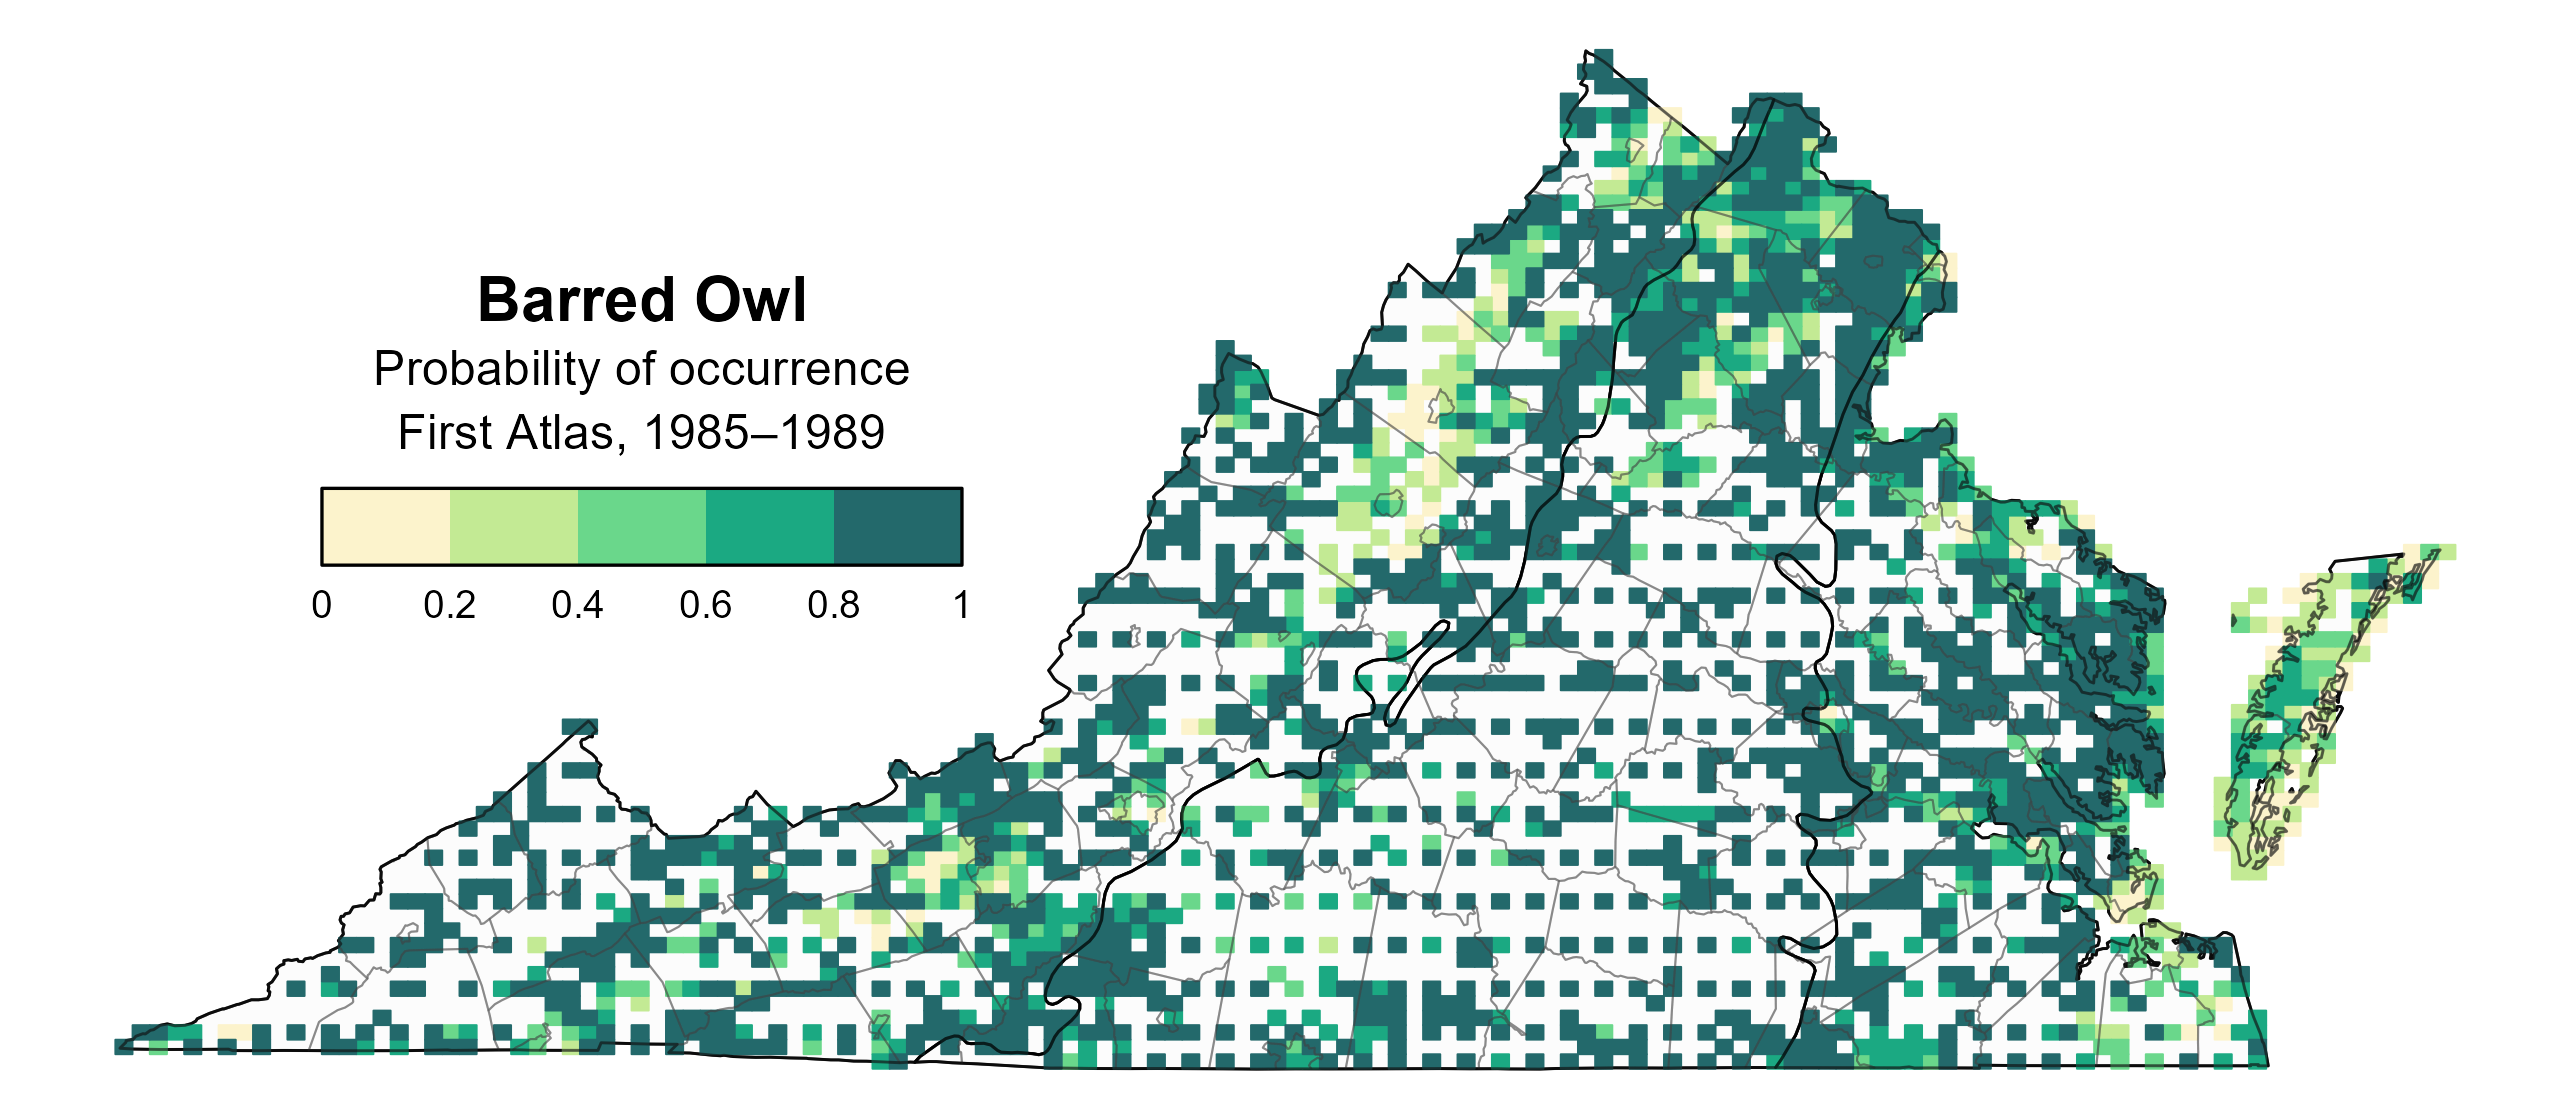
Figure 2: Barred Owl breeding distribution based on probability of occurrence (First Atlas, 1985–1989). This map indicates the probability that this species will occur in an Atlas block (an approximately 10 mi2 [26 km2] survey unit) based on environmental (including habitat) factors and after adjusting for the probability of detection (variation in survey effort among blocks). Blocks in white were not surveyed during the First Atlas and were not modeled.
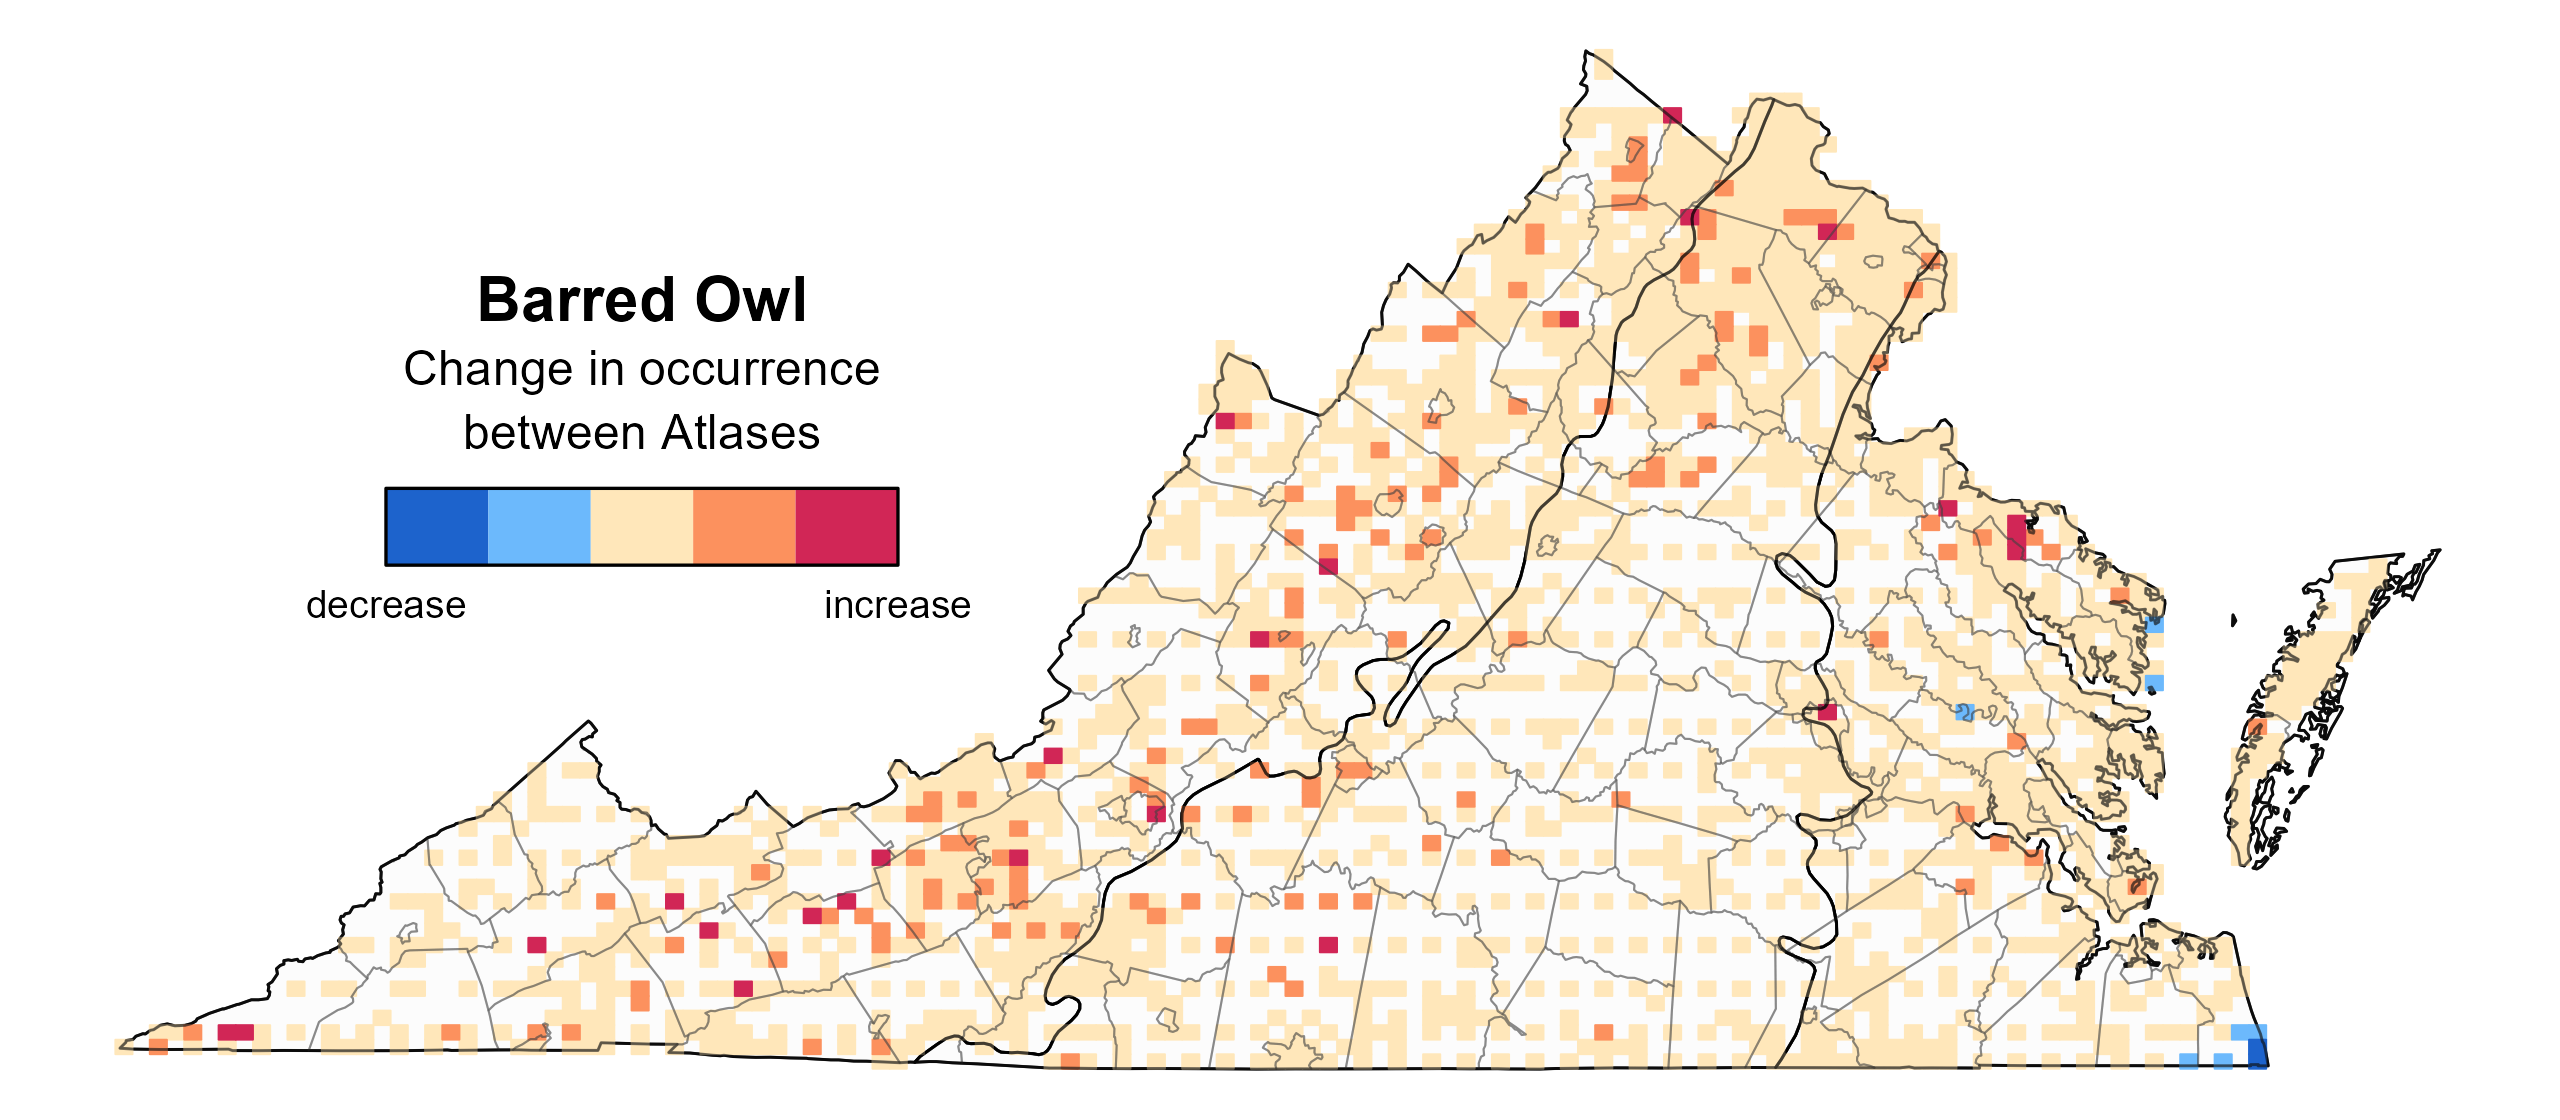
Figure 3: Barred Owl change in breeding distribution between Atlases (1985–1989 and 2016–2020) based on probability of occurrence. This map indicates the change in the probability that this species will occur in a block (an approximately 10 mi2 [26 km2] survey unit) between Atlas periods. Blocks with no change (tan) may have constant presence or constant absence. Blocks in white were not surveyed during the First Atlas and were not modeled.
Breeding Evidence
Barred Owls were confirmed breeders in 203 blocks and 75 counties and found to be probable breeders in an additional 25 counties (Figure 4). Although fewer breeding confirmations were recorded during the First Atlas, which was likely due to less survey effort, breeding observations were recorded across all regions of the state (Figure 5).
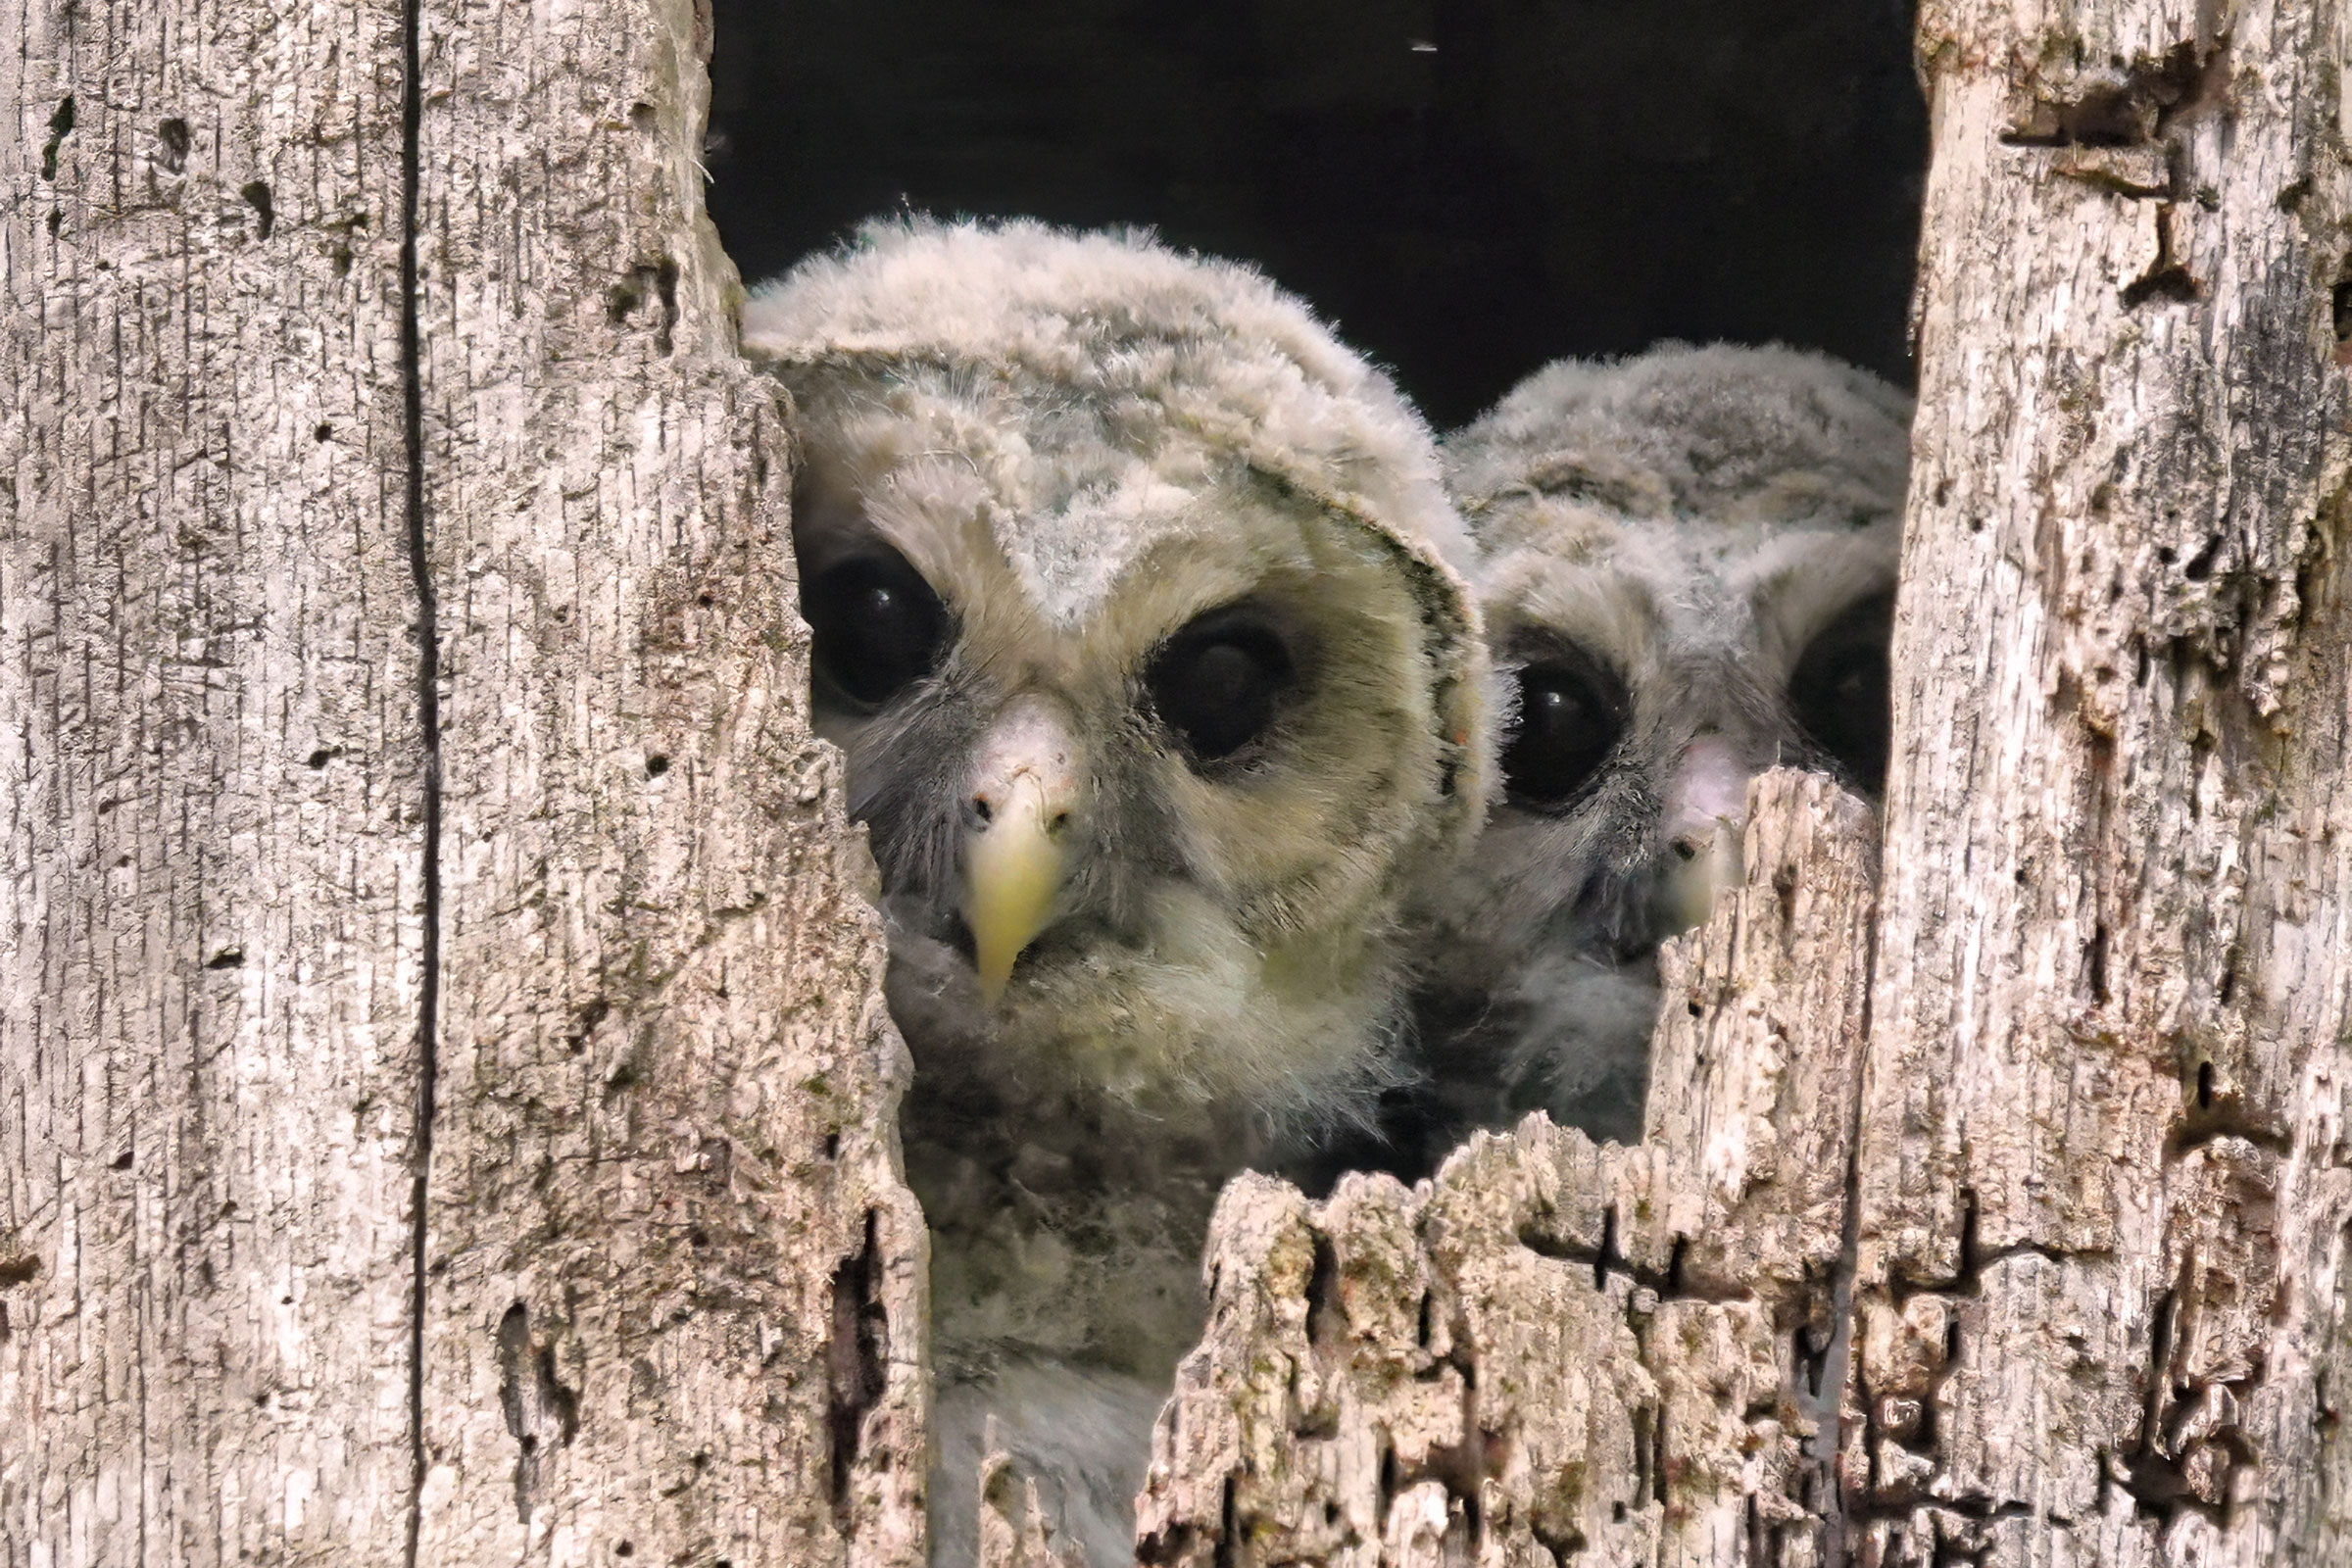
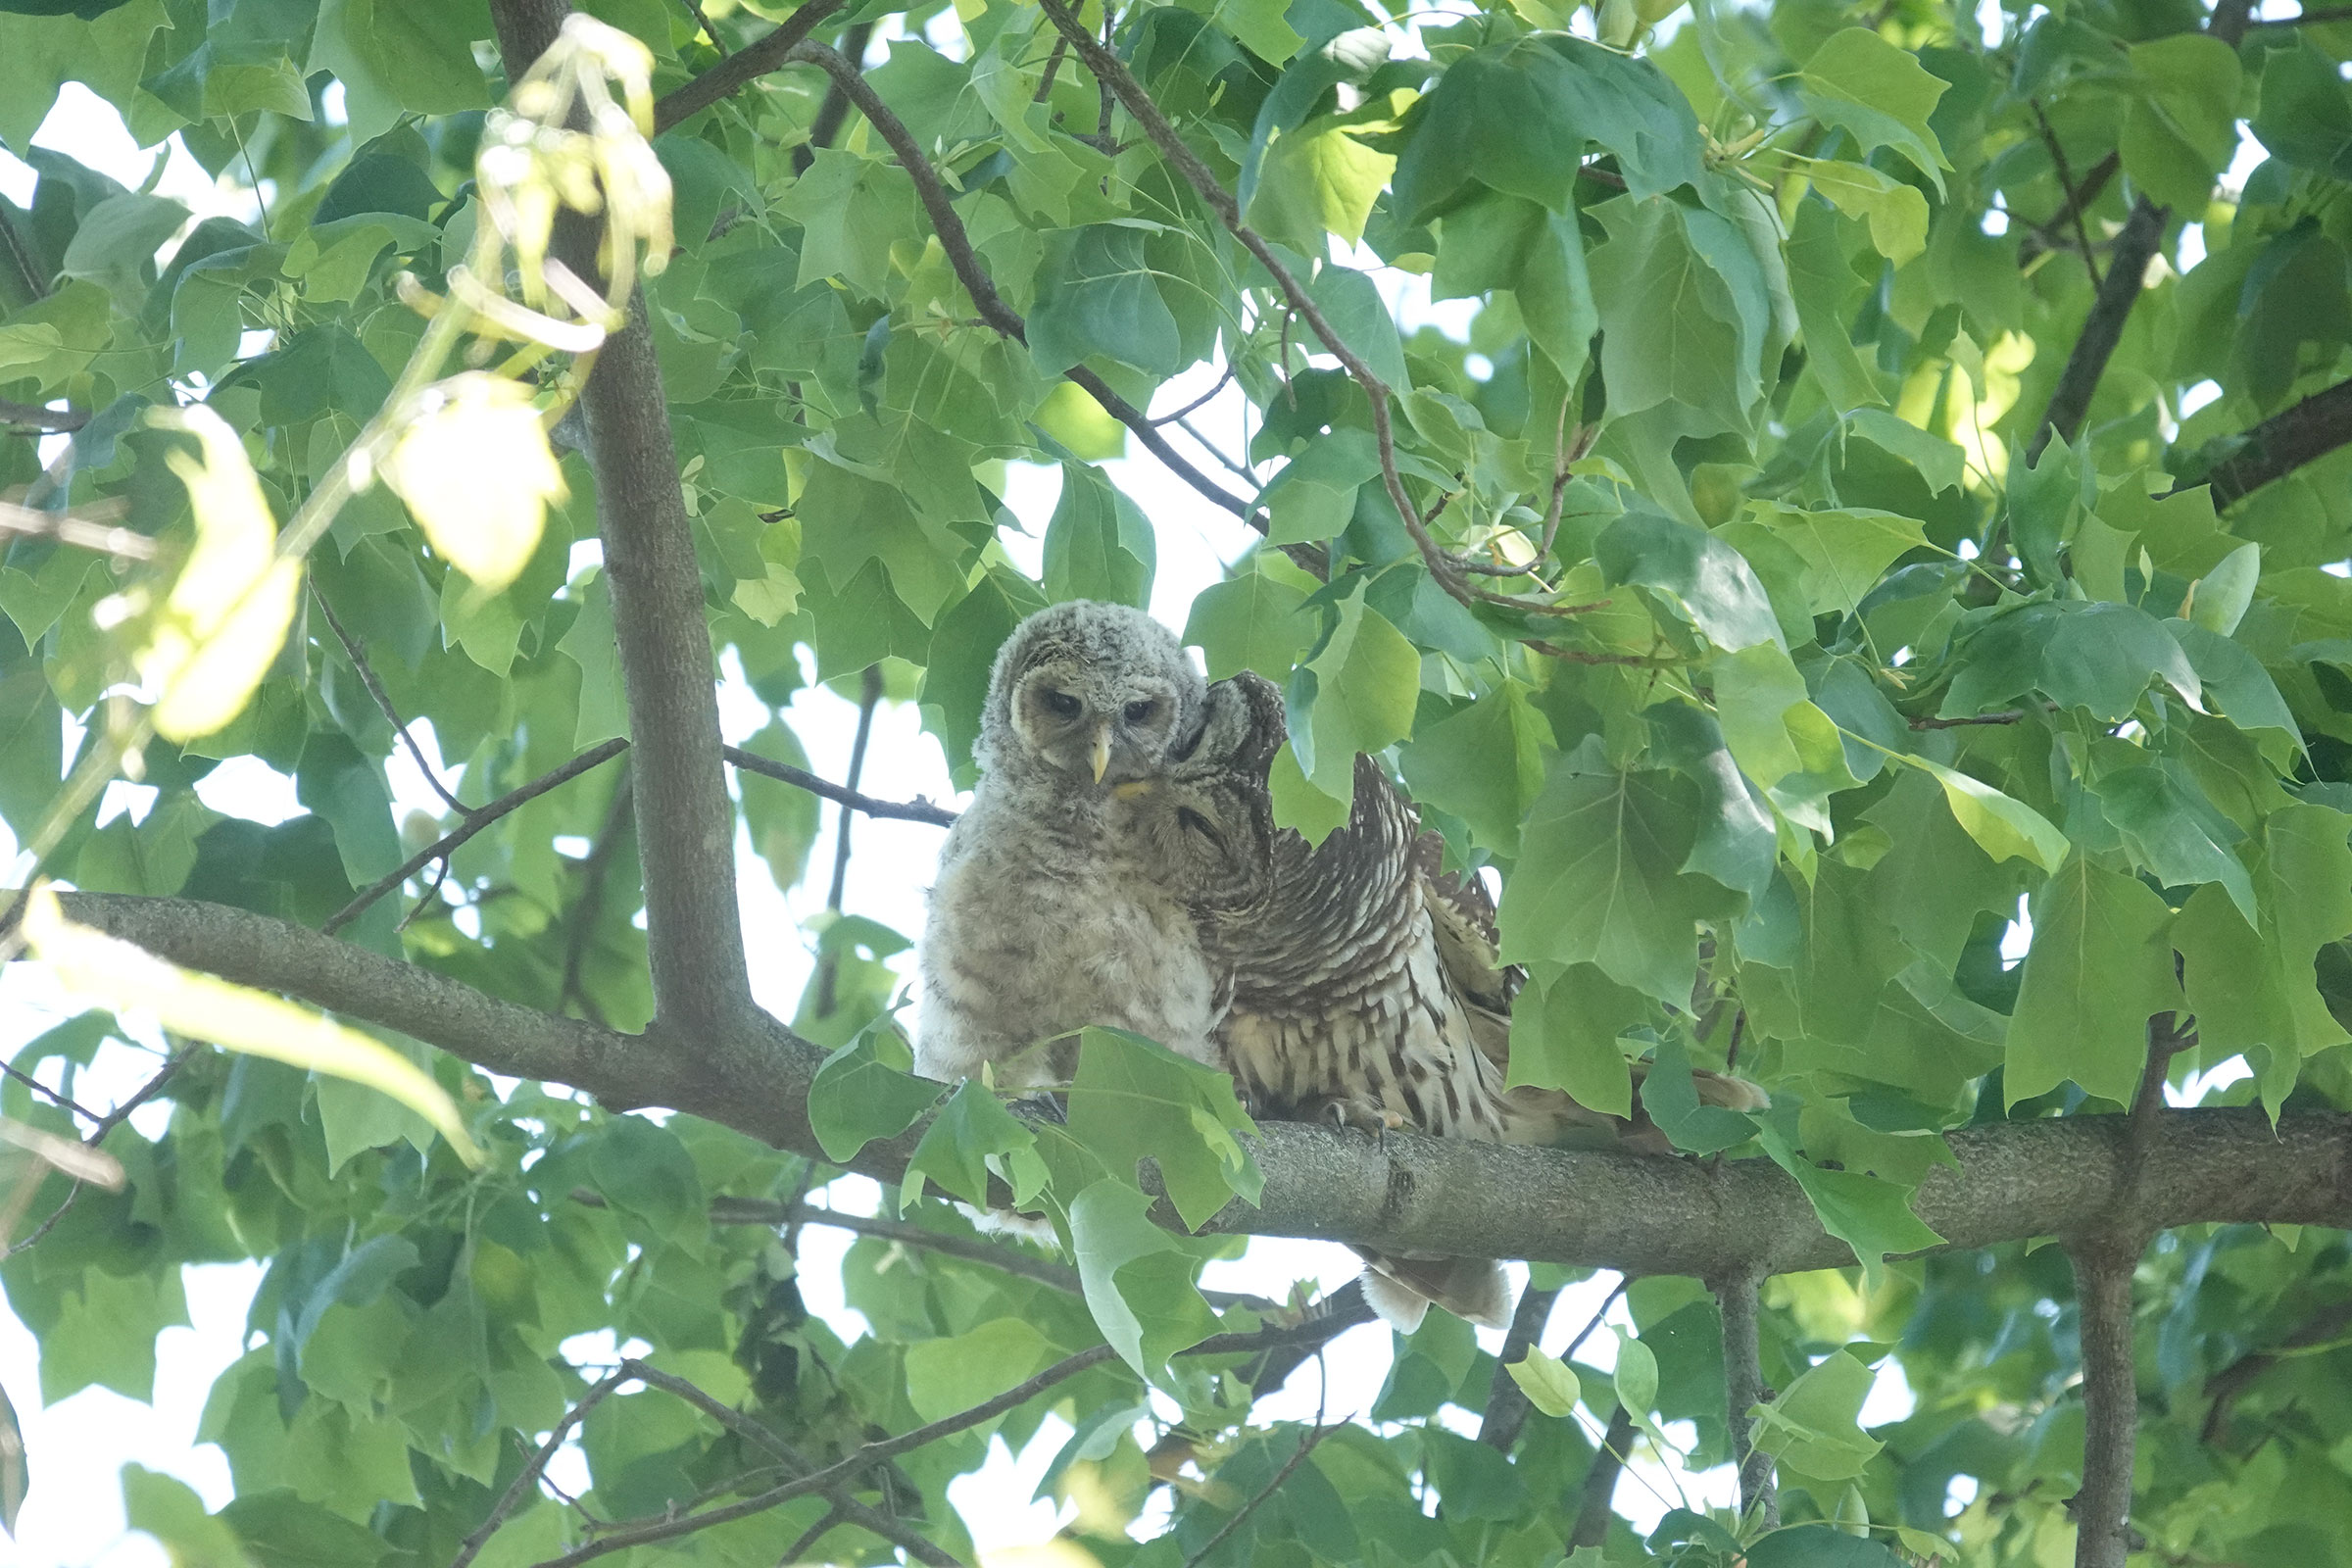
Breeding was overwhelmingly confirmed through observations of recently fledged young (April 2 – August 23), although occupied nests (March 26 – May 22) and nests with young (April 17 – July 23) were also documented (Figure 6).
For more general information on the breeding habits of this species, please refer to All About Birds.
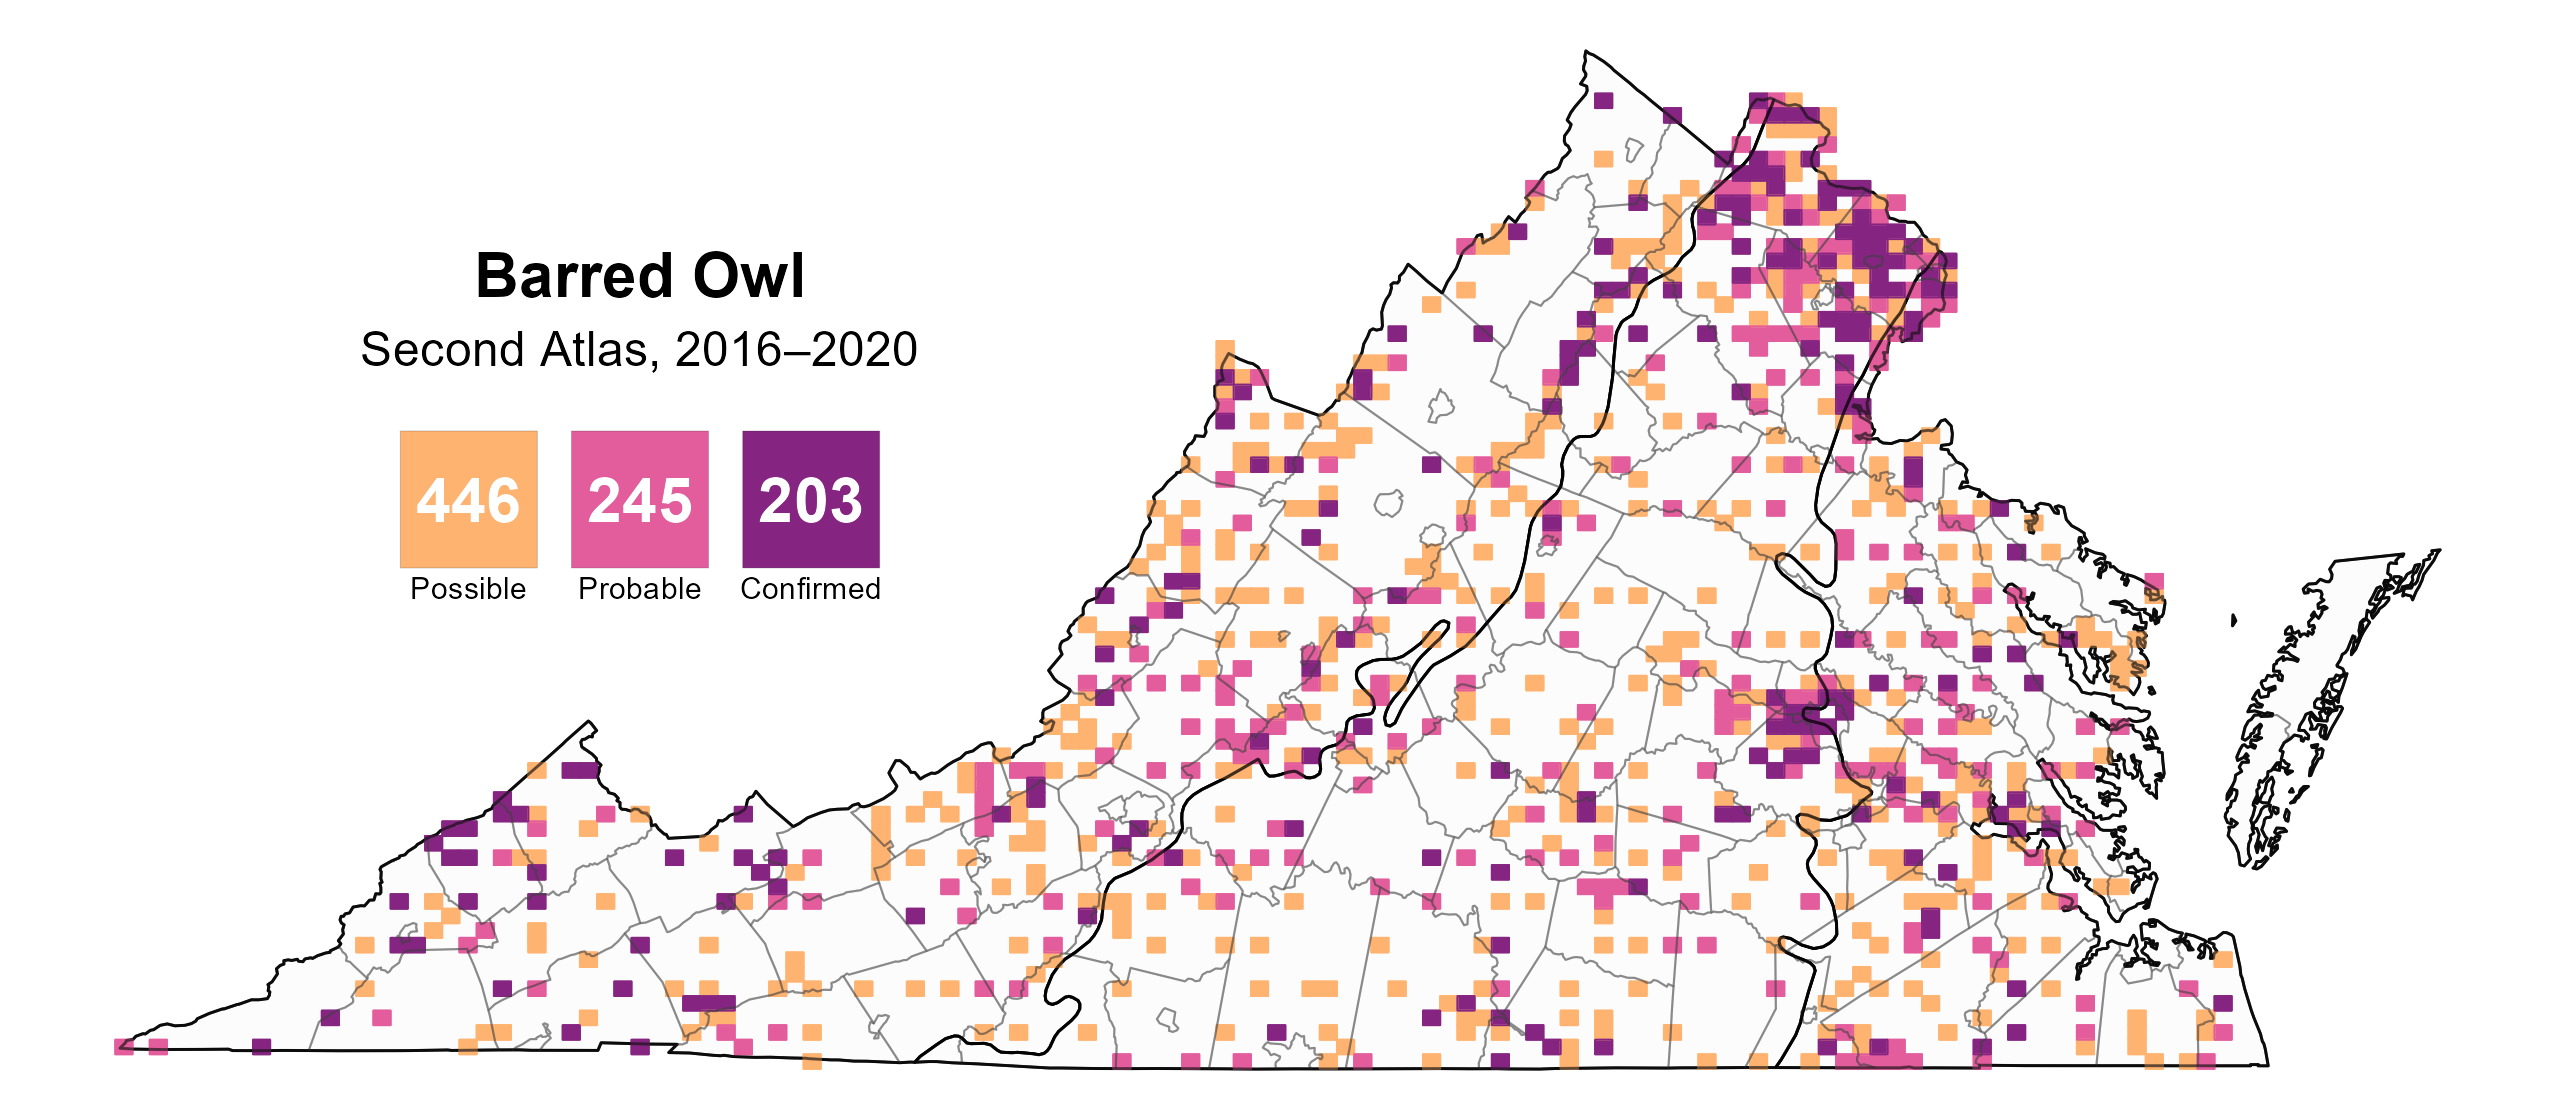
Figure 4: Barred Owl breeding observations from the Second Atlas (2016–2020). The colored boxes illustrate Atlas blocks (approximately 10 mi2 [26 km2] survey units) where the species was detected. The colors show the highest breeding category recorded in a block. The numbers within the colors in the legend correspond to the number of blocks with that breeding evidence category.
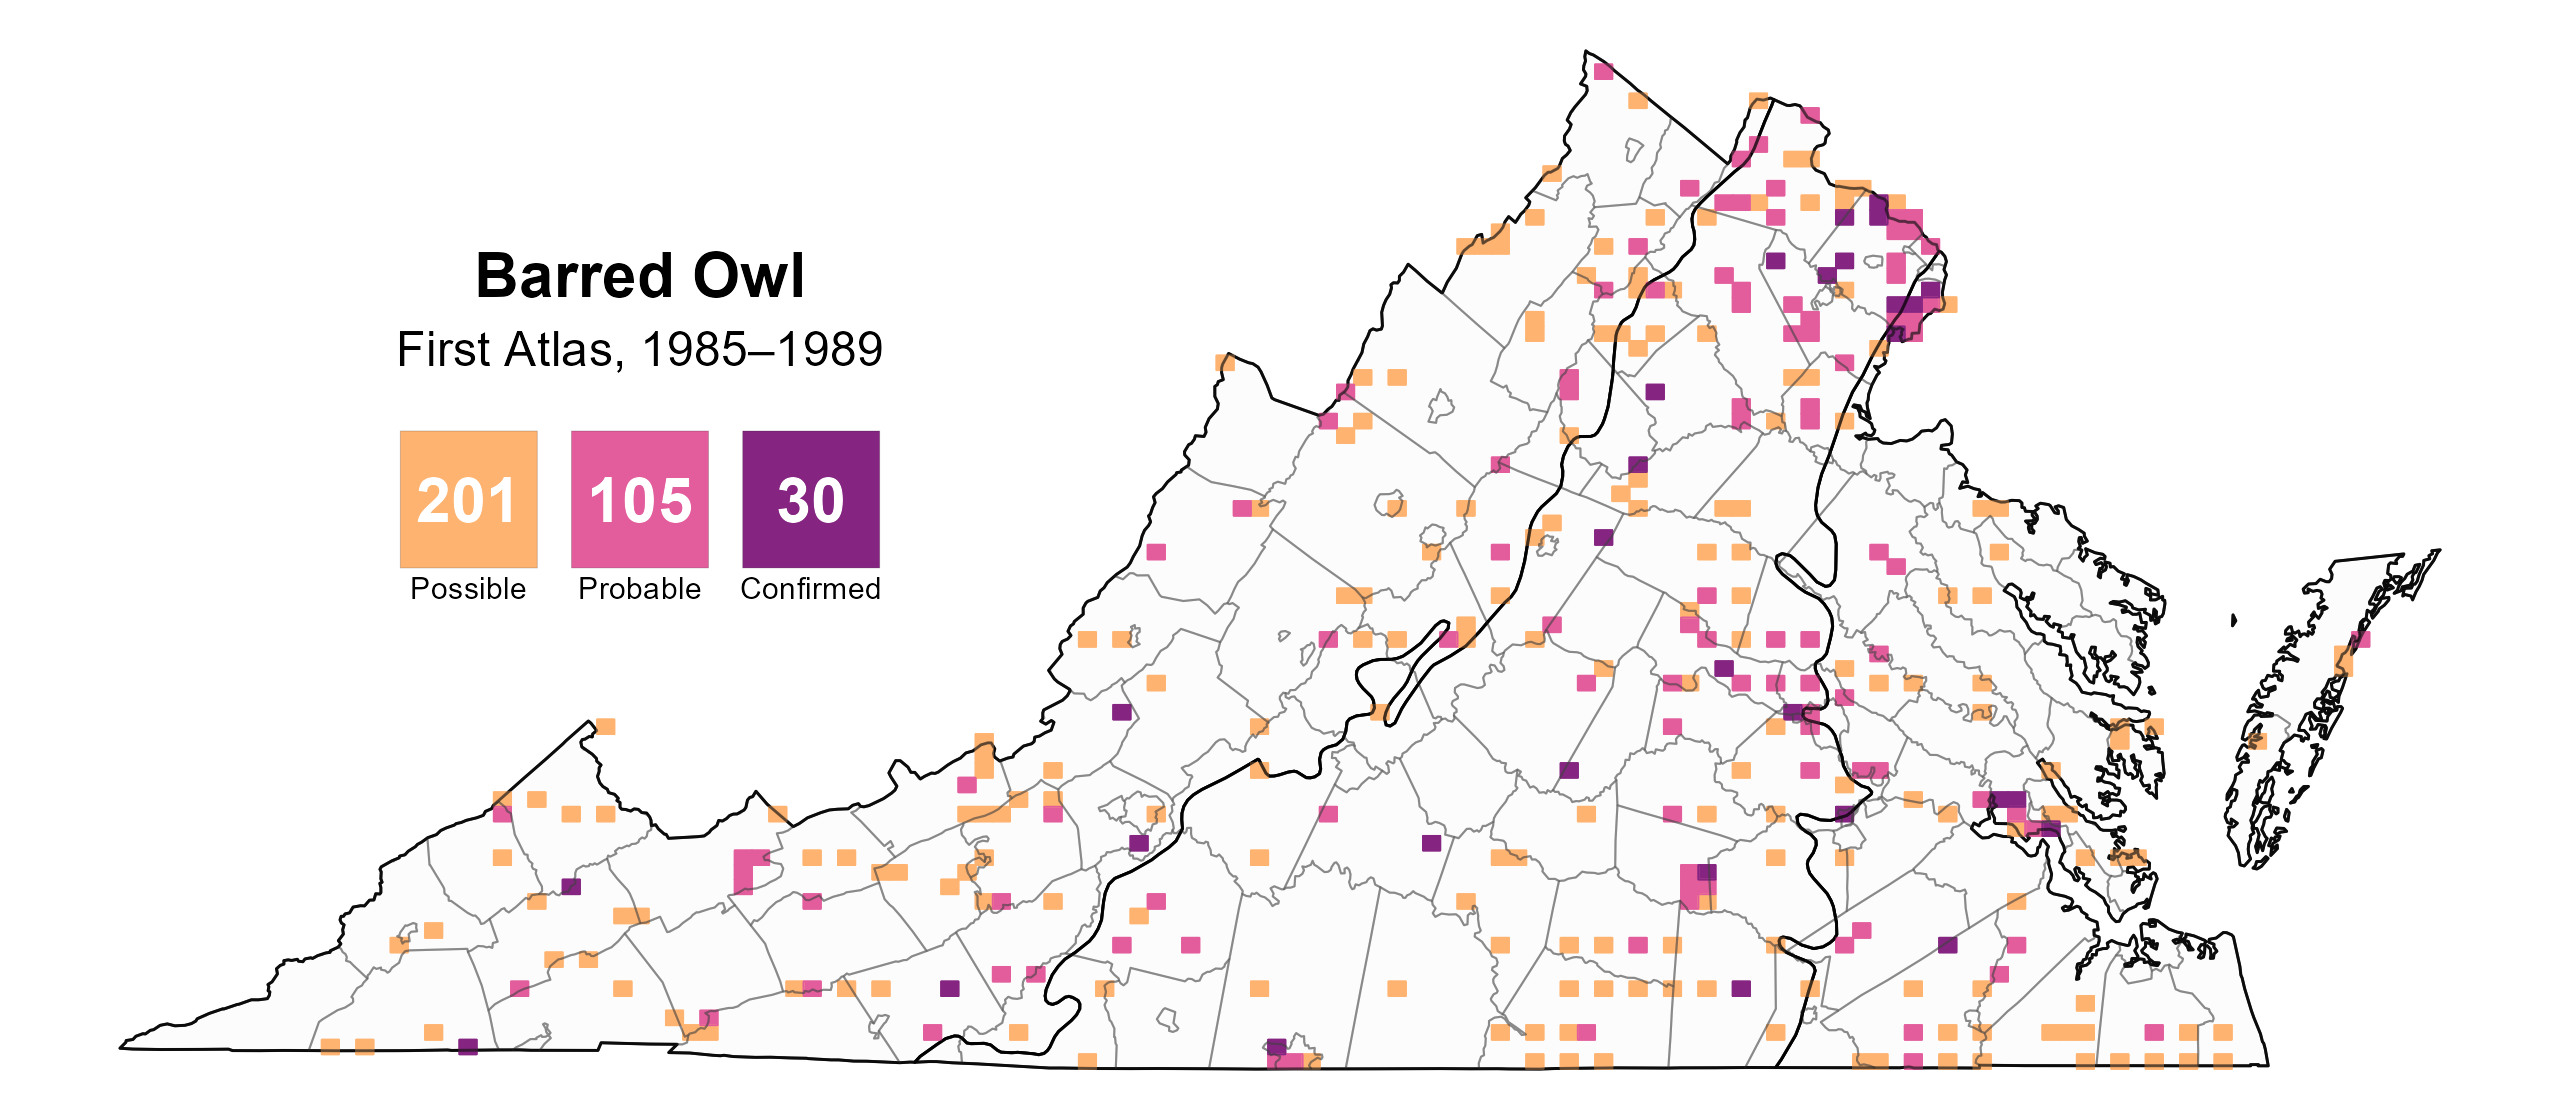
Figure 5: Barred Owl breeding observations from the First Atlas (1985–1989). The colored boxes illustrate Atlas blocks (approximately 10 mi2 [26 km2] survey units) where the species was detected. The colors show the highest breeding category recorded in a block. The numbers within the colors in the legend correspond to the number of blocks with that breeding evidence category.
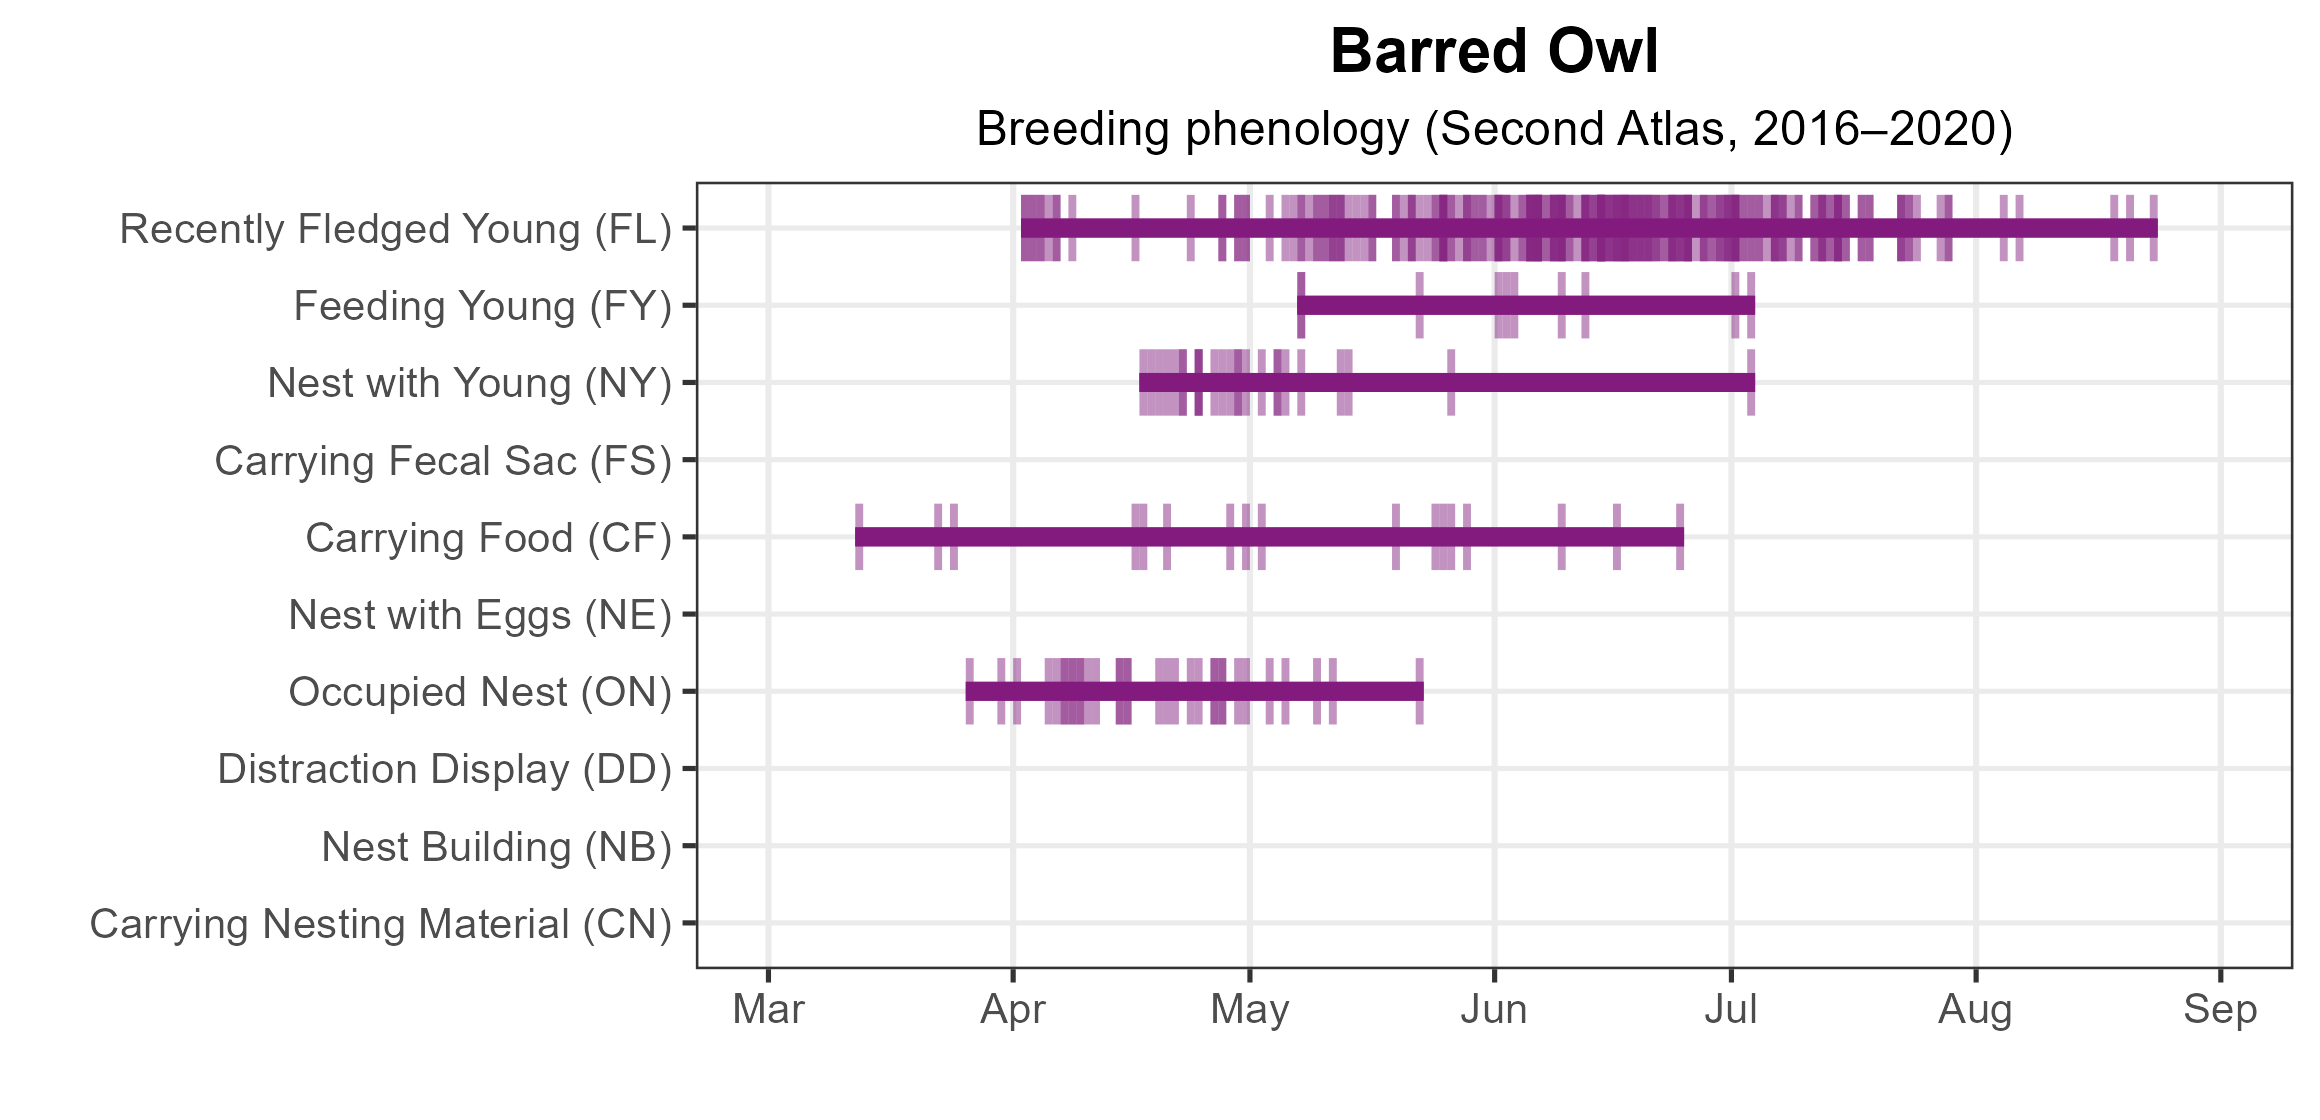
Figure 6: Barred Owl phenology: confirmed breeding codes. This graph shows a timeline of confirmed breeding behaviors. Tick marks represent individual observations of the behavior.
Population Status
Abundance models could not be produced for the Barred Owl given the low number of species detections in the Atlas point count data. Additionally, a credible population trend for Virginia could not be generated by the North American Breeding Bird Survey (BBS). However, BBS data for the Atlantic Flyway showed a significant increase of 0.91% per year from 1966–2022 and between Atlas periods (from 1987–2018) a significant increase of 0.66% per year (Hostetler et al. 2023; Figure 7).
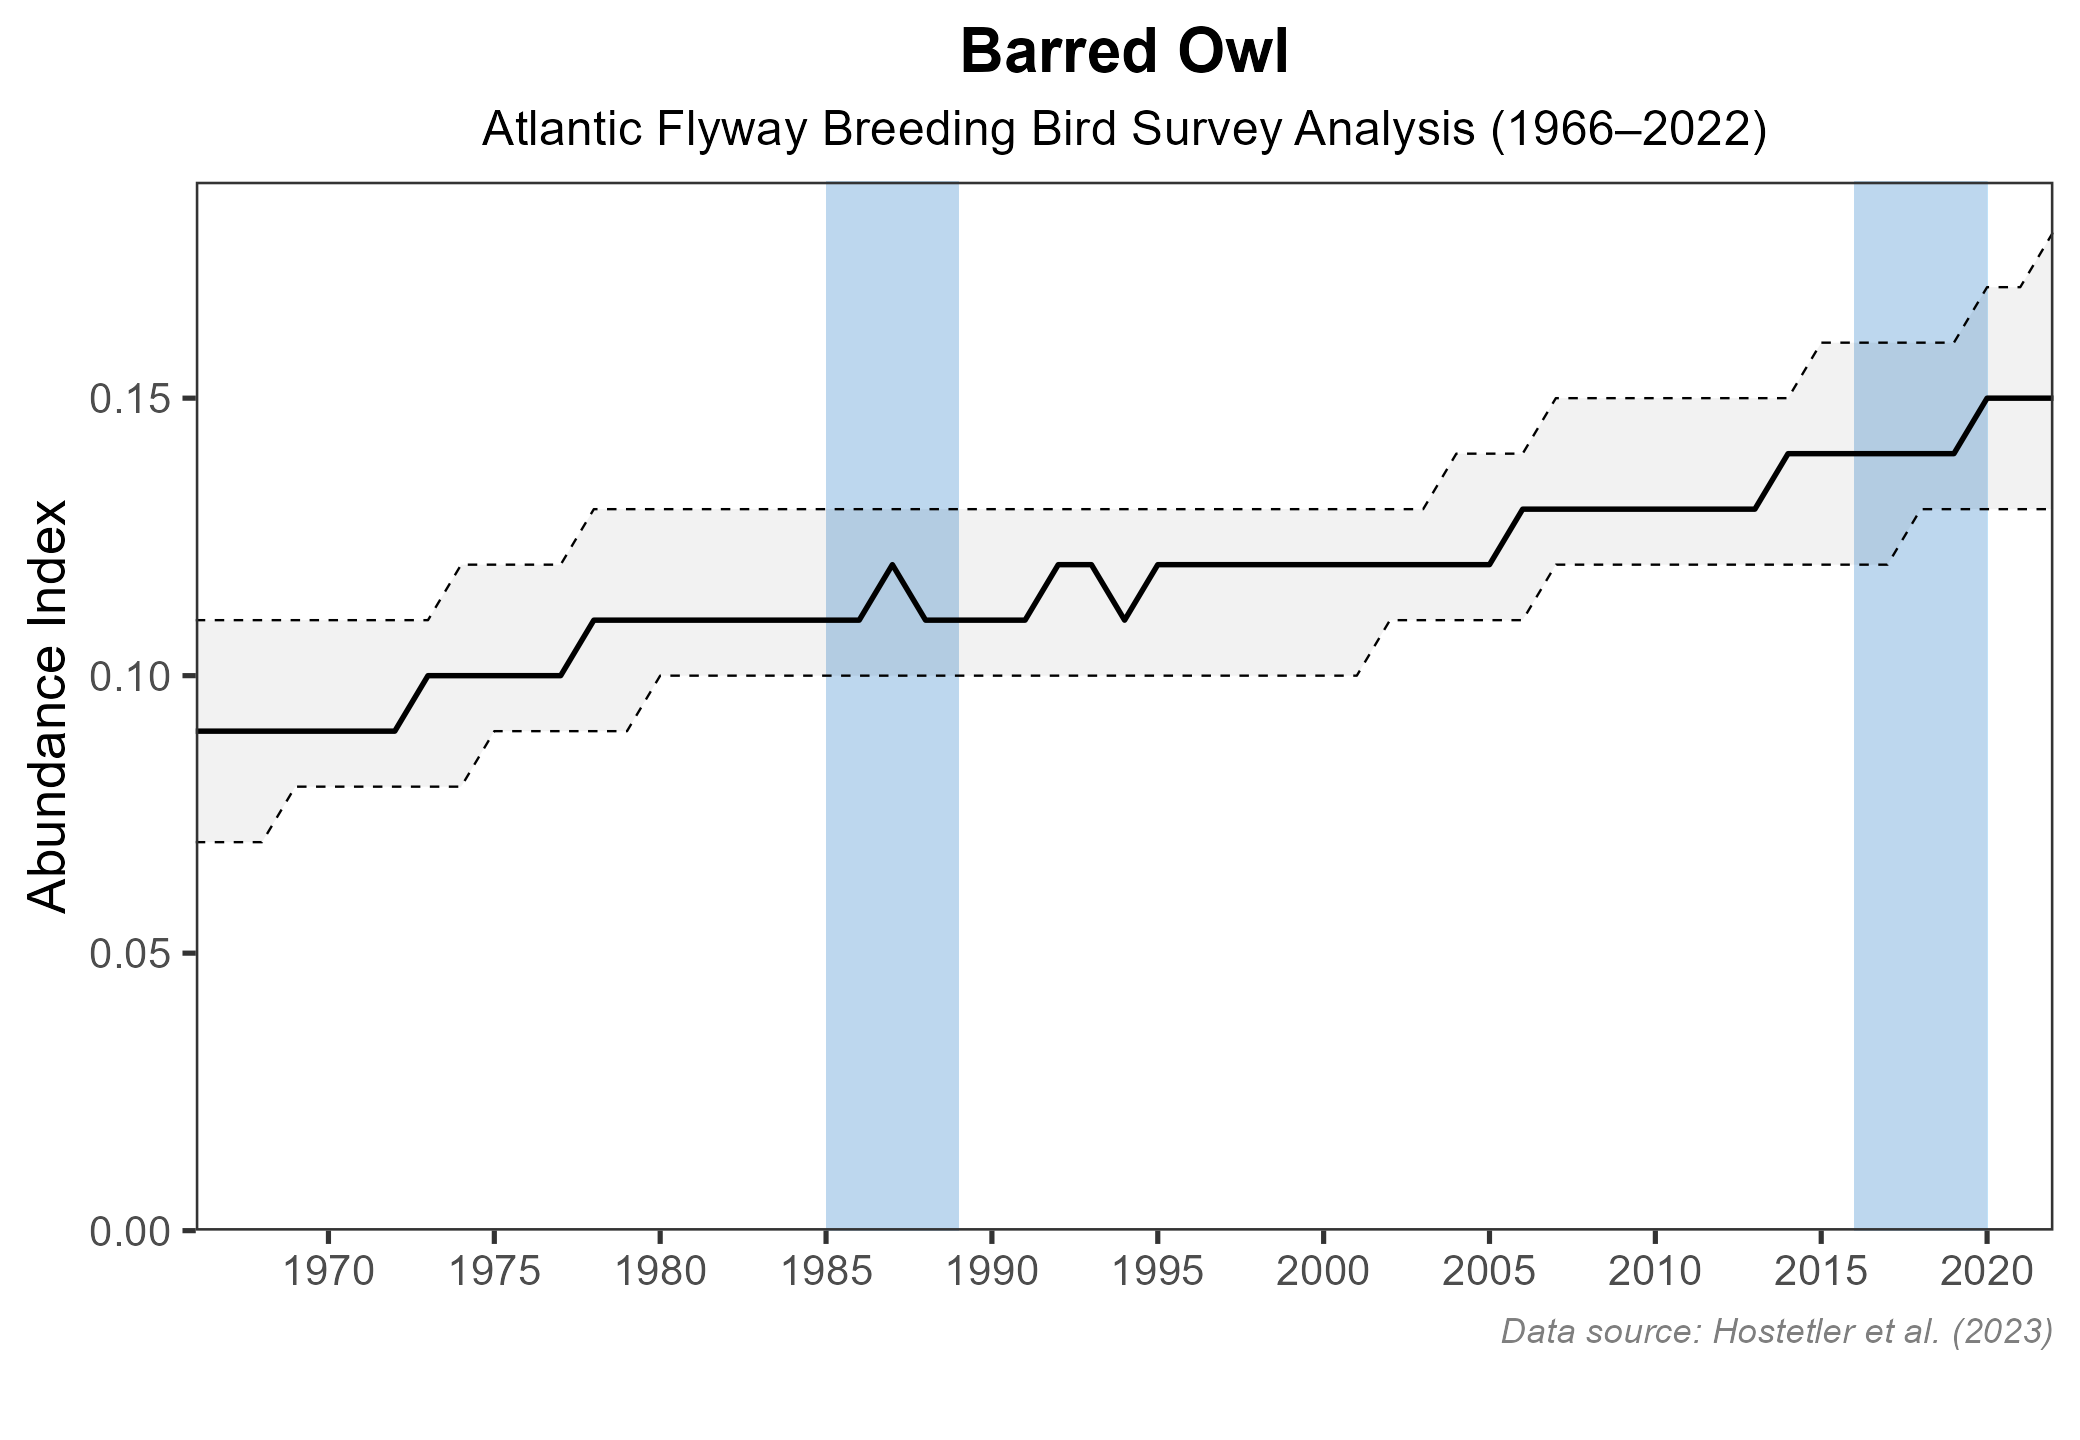
Figure 7: Barred Owl population trend for the Atlantic Flyway as estimated by the North American Breeding Bird Survey. The vertical axis shows species abundance; the horizontal axis shows the year. The solid line indicates the estimated population trend; there is a 97.5% probability that the true population trend falls between the dashed lines. The shaded bars indicate the First and Second Atlas periods.
Conservation
Because they are semi-nocturnal, Barred Owls are difficult to monitor, and credible population trends are not well-estimated by diurnal surveys like the BBS. Nonetheless, BBS trends for the species are consistently positive at geographic scales, ranging from individual states to broader regions across the survey range. Accordingly, Barred Owl is not currently of conservation concern in Virginia. However, the best way to prevent future declines in Barred Owl populations is through conservation of forested lands to prevent their conversion to noncompatible uses and through protection of large cavity trees (Bierregaard et al. 2024). As Barred Owls continue to expand into suburban habitats, their exposure to anticoagulant rodenticides may be increasing (Bierregaard et al. 2024); monitoring for effects of these pesticides on individuals and populations should continue.
Interactive Map
The interactive map contains up to six Atlas layers (probability of occurrence for the First and Second Atlases, change in probability of occurrence between Atlases, breeding evidence for the First and Second Atlases, and abundance for the Second Atlas) that can be viewed one at a time. To view an Atlas map layer, mouse over the layer box in the upper left. County lines and physiographic regional boundaries (Mountains and Valleys, Piedmont, and Coastal Plain) can be turned on and off by checking or unchecking the box below the layer box. Within the map window, users can hover on a block to see its value for each layer and pan and zoom to see roads, towns, and other features of interest that are visible beneath a selected layer.
View Interactive Map in Full Screen
References
Bierregaard, R. O., K. B. Livezey, P. Pyle, K. M. Mazur, and P. C. James (2024). Barred Owl (Strix varia), version 2.0. In Birds of the World (P.G. Rodewald, B.K. Keeney, and M. G. Smith, Editors). Cornell Lab of Ornithology, Ithaca, NY, USA. https://doi.org/10.2173/bow.brdowl.02.
Hostetler, J. A., J. R. Sauer, J. E. Hines, D. Ziolkowski, and M. Lutmerding (2023). The North American breeding bird survey, analysis results 1966 – 2022. U.S. Geological Survey, Laurel, MD, USA. https://doi.org/10.5066/P9SC7T11.