Introduction
The Northern Mockingbird is one of three thrushes that breed in Virginia that mimic other species, but it has the purest and longest song, often singing past the evening into the night. Each mimicked phrase, from up to 200 other species, in a Northern Mockingbird’s song is repeated many times (up to six), and the song can go on for as long as 20 seconds (Farnsworth et al. 2020). It breeds in Virginia’s in shrubland and grassland habitats and agricultural and urban areas.
Breeding Distribution
Northern Mockingbirds breed throughout the state and are highly likely to occur across much of the Commonwealth, except the forested ridges of the Mountains and Valleys region (Figure 1). Their likely occurrence is positively associated with the amount of agricultural land (can include an association with hay/pasture if nesting in vegetated fencerows or in shrubby pastures) in a block (Figure 1). In contrast, the likelihood of Northern Mockingbird occurring is negatively associated with forest edge habitat.
Between Atlases (Figures 1 and 2), the Northern Mockingbird’s likelihood of occurrence remained constant over the entire state (Figure 3).
View Environmental Associations
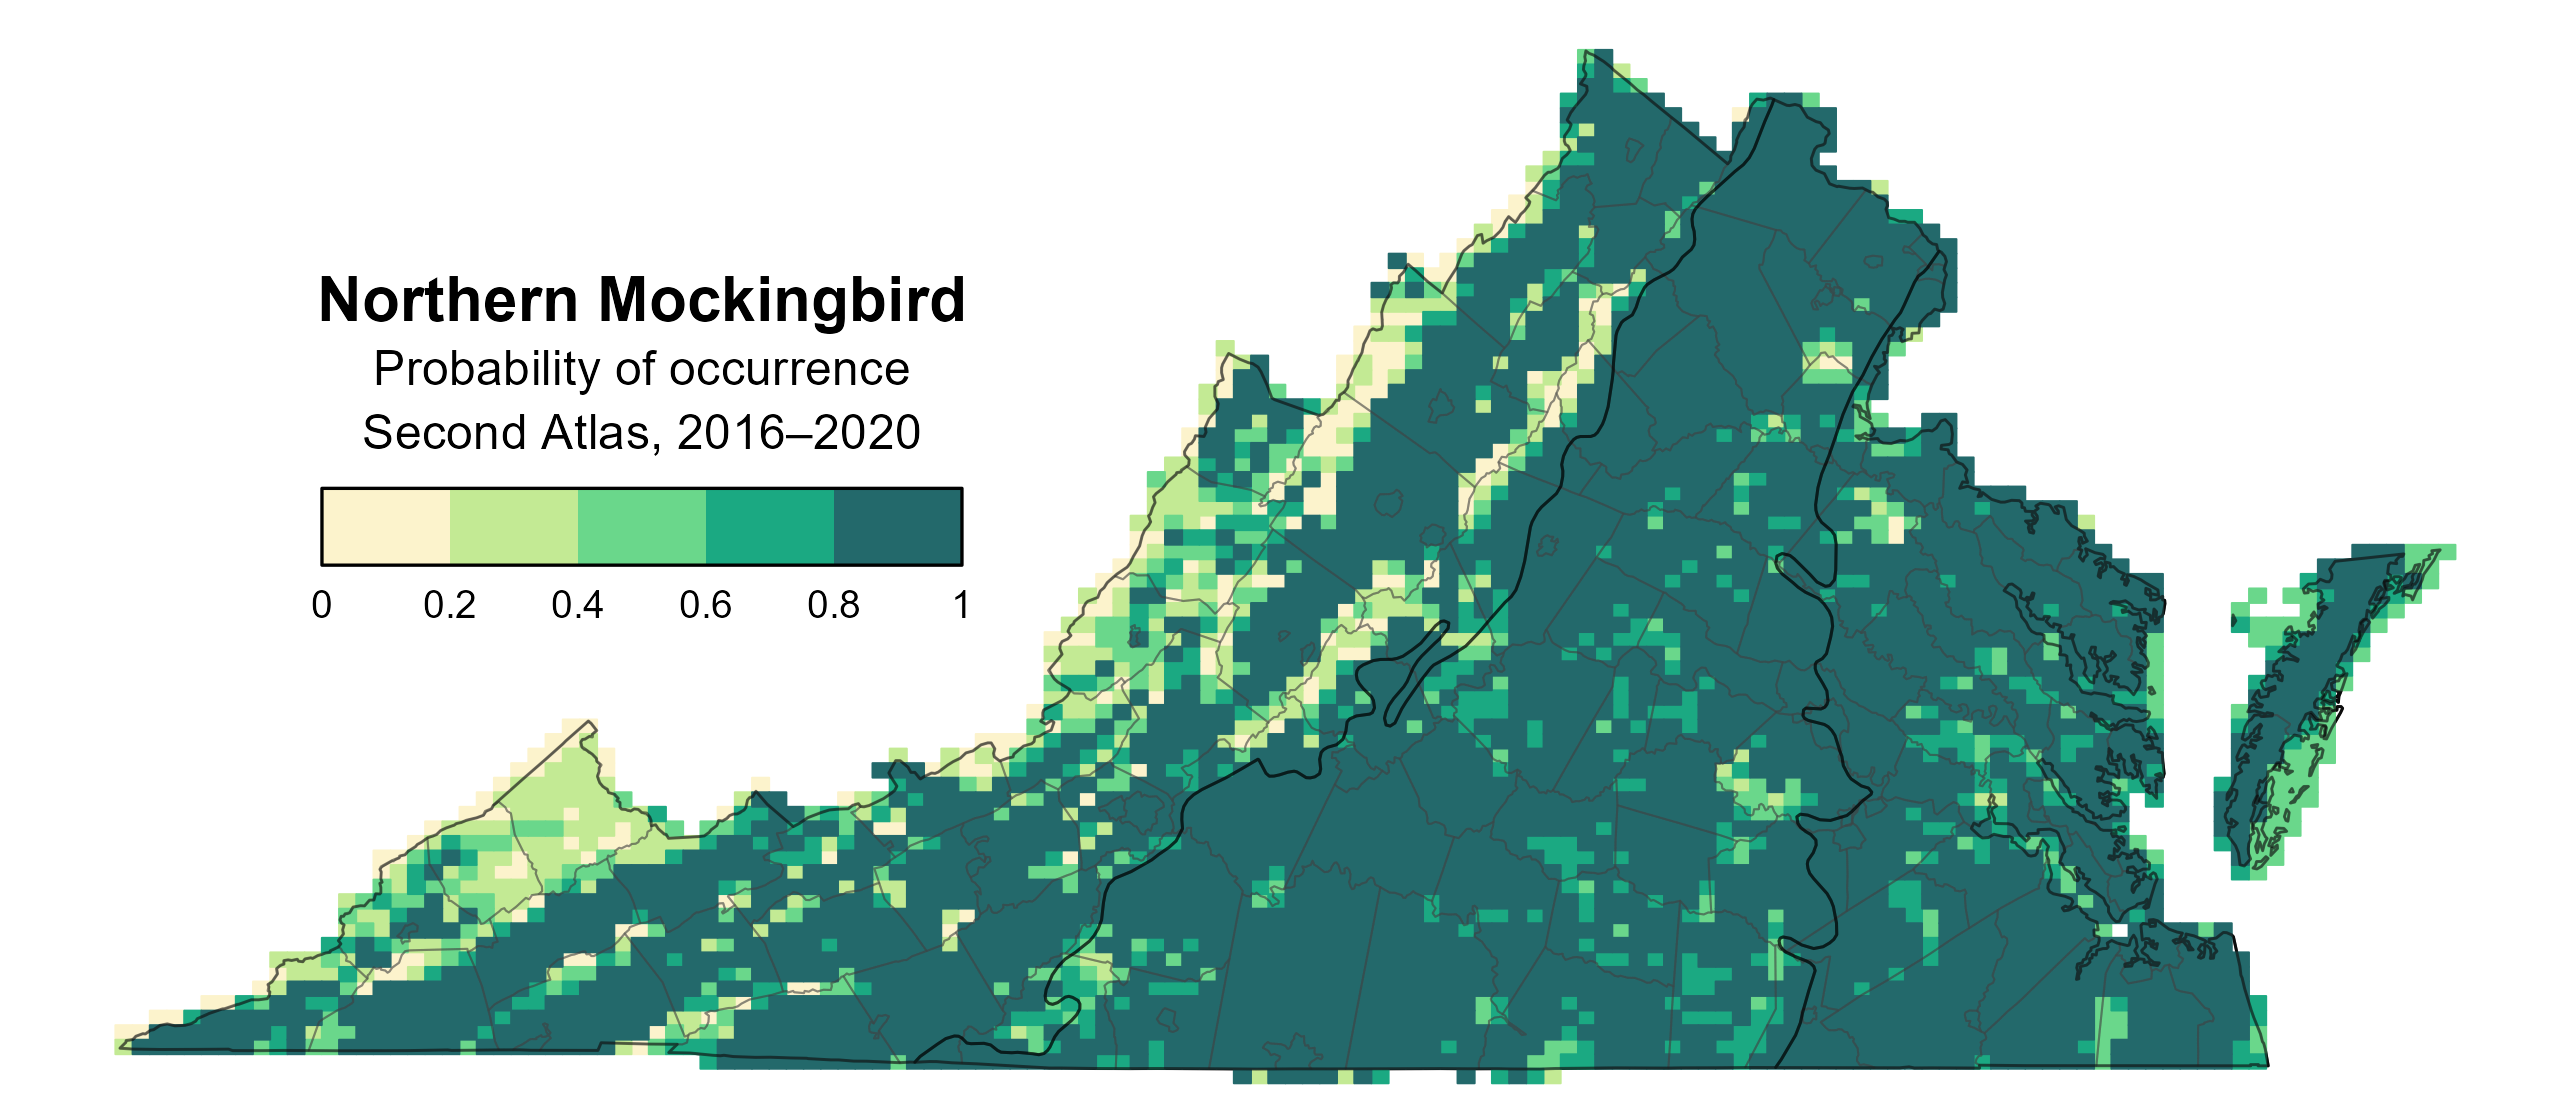
Figure 1: Northern Mockingbird breeding distribution based on probability of occurrence (Second Atlas, 2016–2020). This map indicates the probability that this species will occur in an Atlas block (an approximately 10 mi2 [26 km2] survey unit) based on environmental (including habitat) factors and after adjusting for the probability of detection (variation in survey effort among blocks).
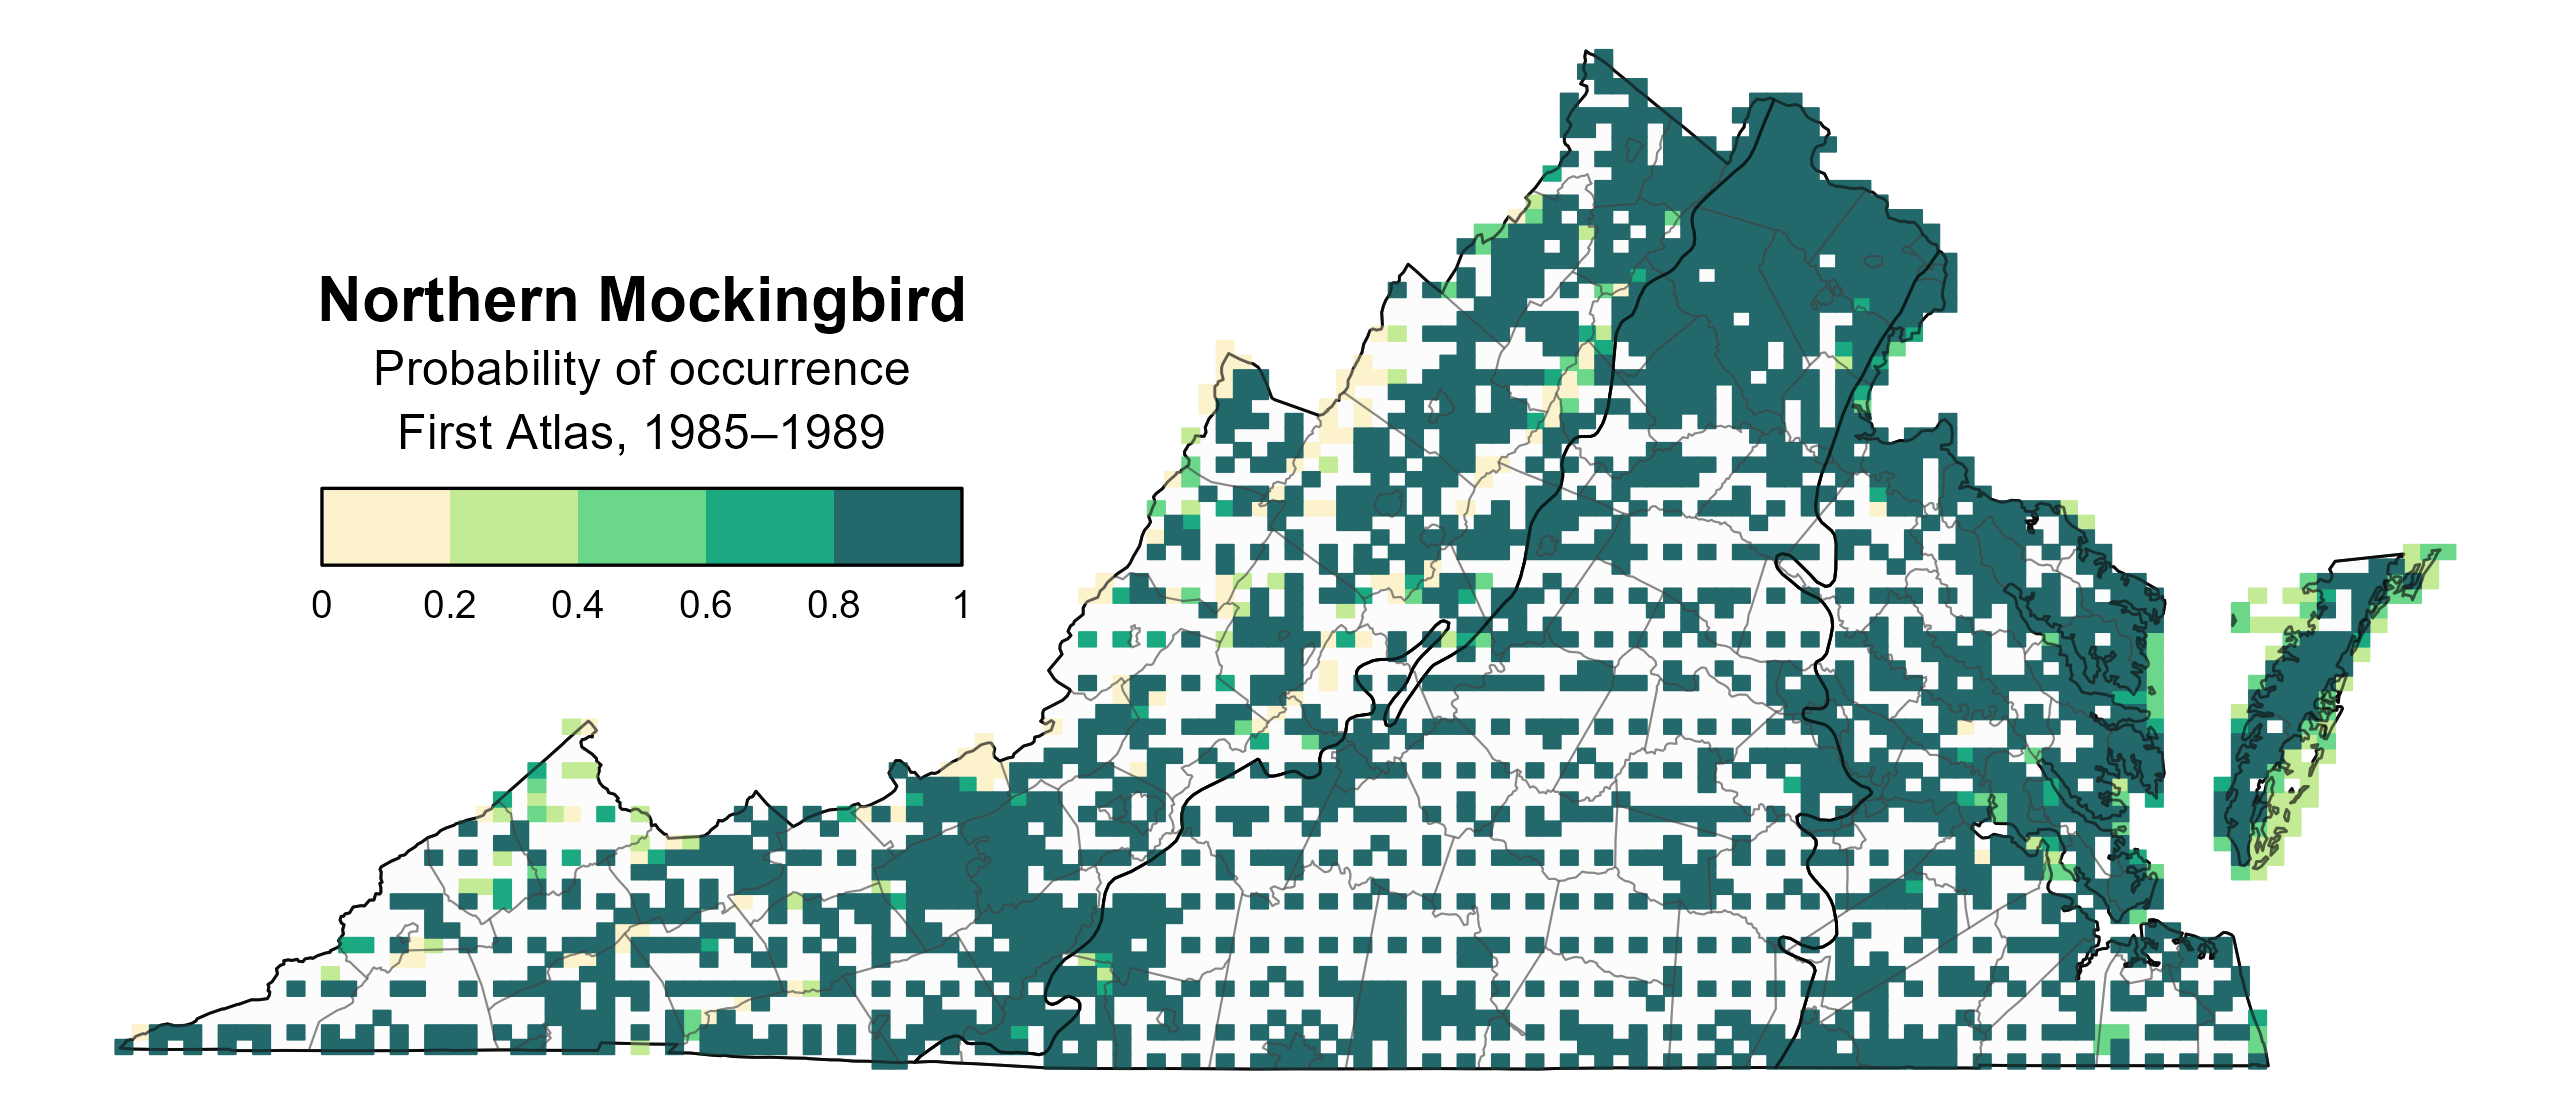
Figure 2: Northern Mockingbird breeding distribution based on probability of occurrence (First Atlas, 1985–1989). This map indicates the probability that this species will occur in an Atlas block (an approximately 10 mi2 [26 km2] survey unit) based on environmental (including habitat) factors and after adjusting for the probability of detection (variation in survey effort among blocks). Blocks in white were not surveyed during the First Atlas and were not modeled.
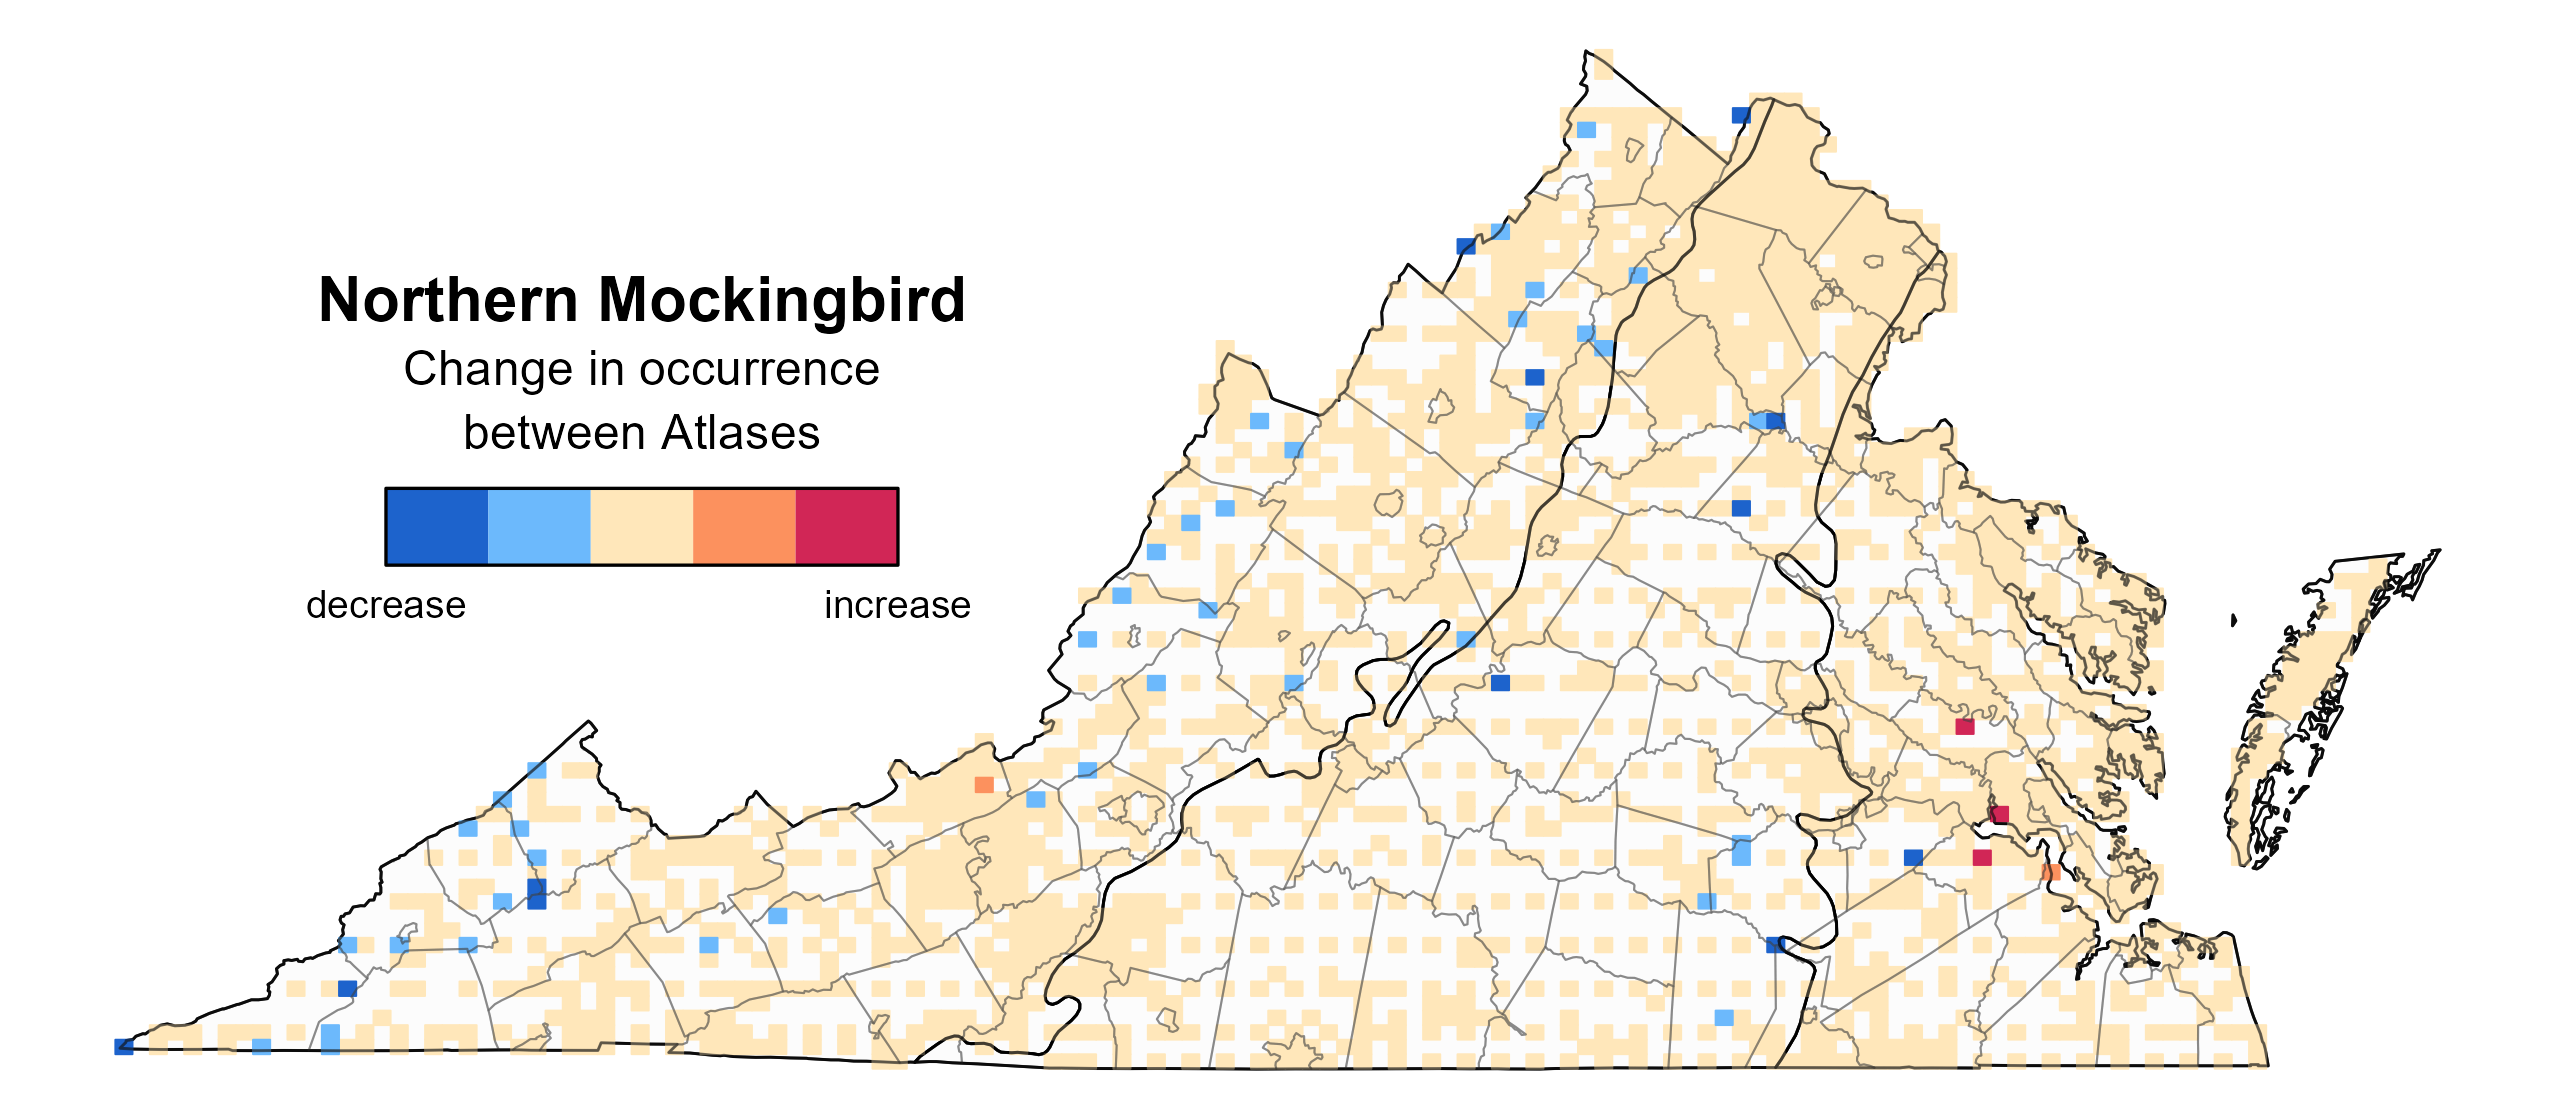
Figure 3: Northern Mockingbird change in breeding distribution between Atlases (1985–1989 and 2016–2020) based on probability of occurrence. This map indicates the change in the probability that this species will occur in a block (an approximately 10 mi2 [26 km2] survey unit) between Atlas periods. Blocks with no change may have constant presence or constant absence. Blocks in white were not surveyed during the First Atlas and were not modeled.
Breeding Evidence
Northern Mockingbirds were confirmed breeders in 936 blocks and 124 counties and found to be probable breeders in four additional counties (Figure 4). They were also confirmed breeders across the state during the First Atlas (Figure 5).
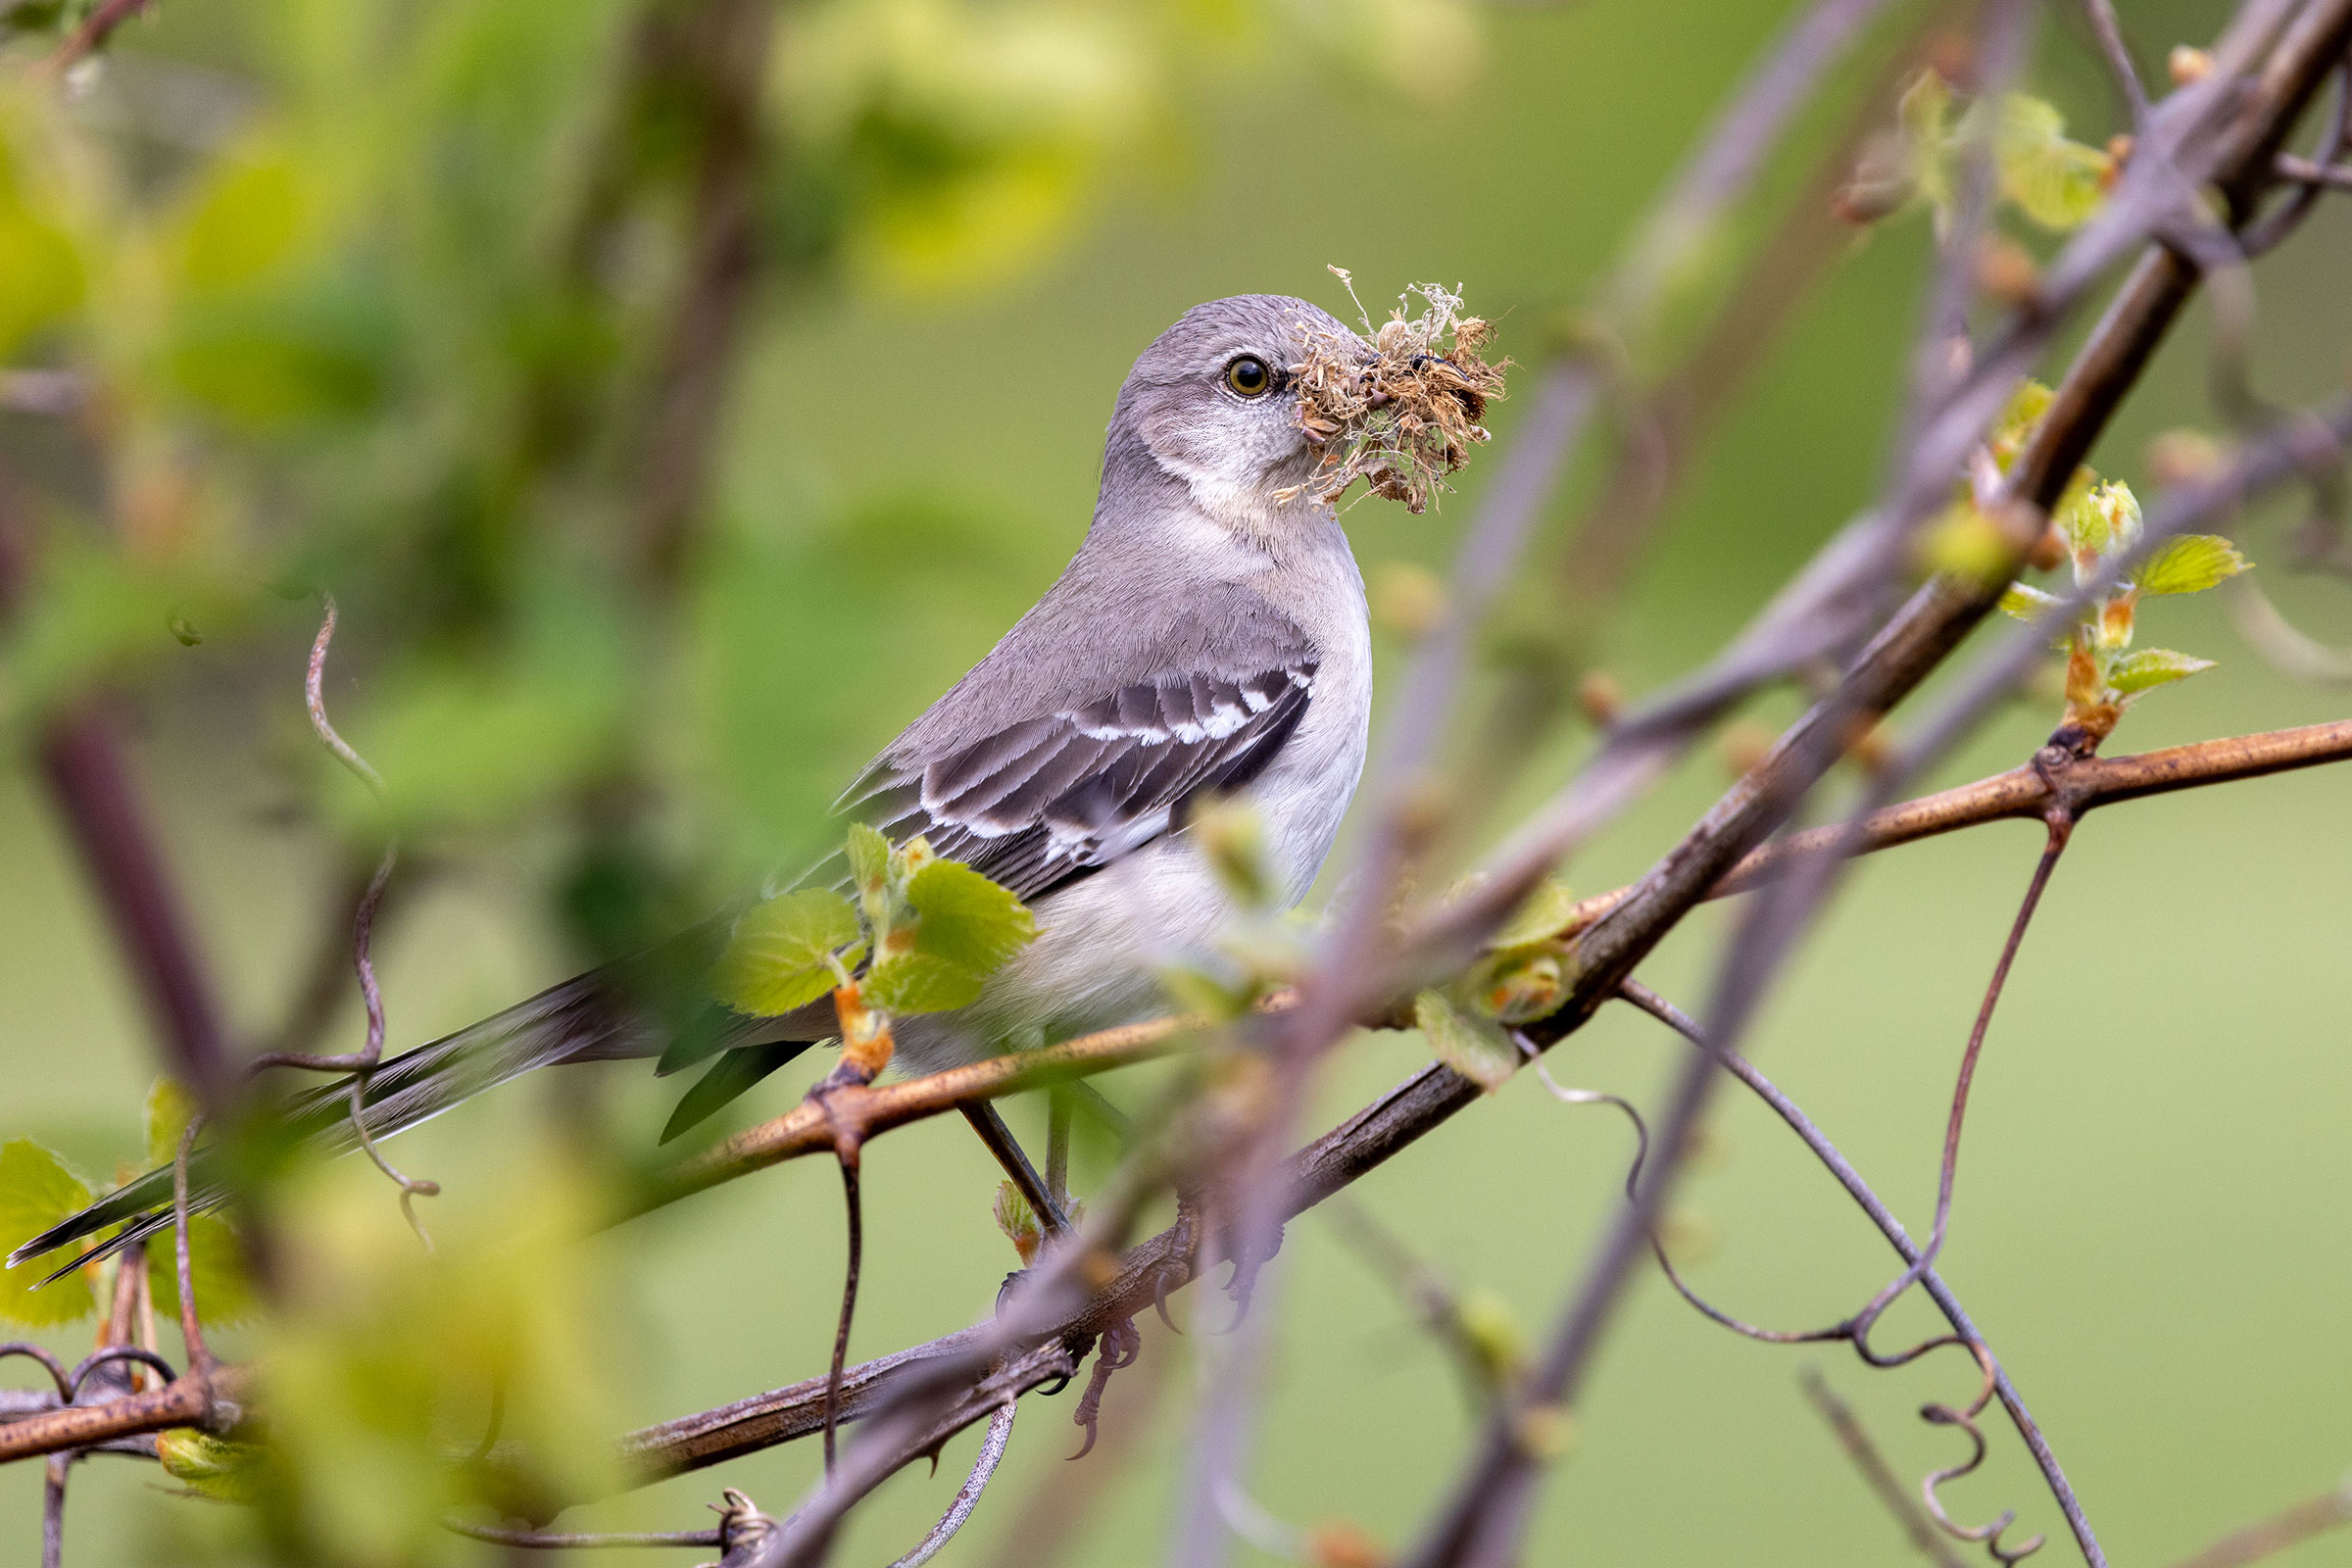
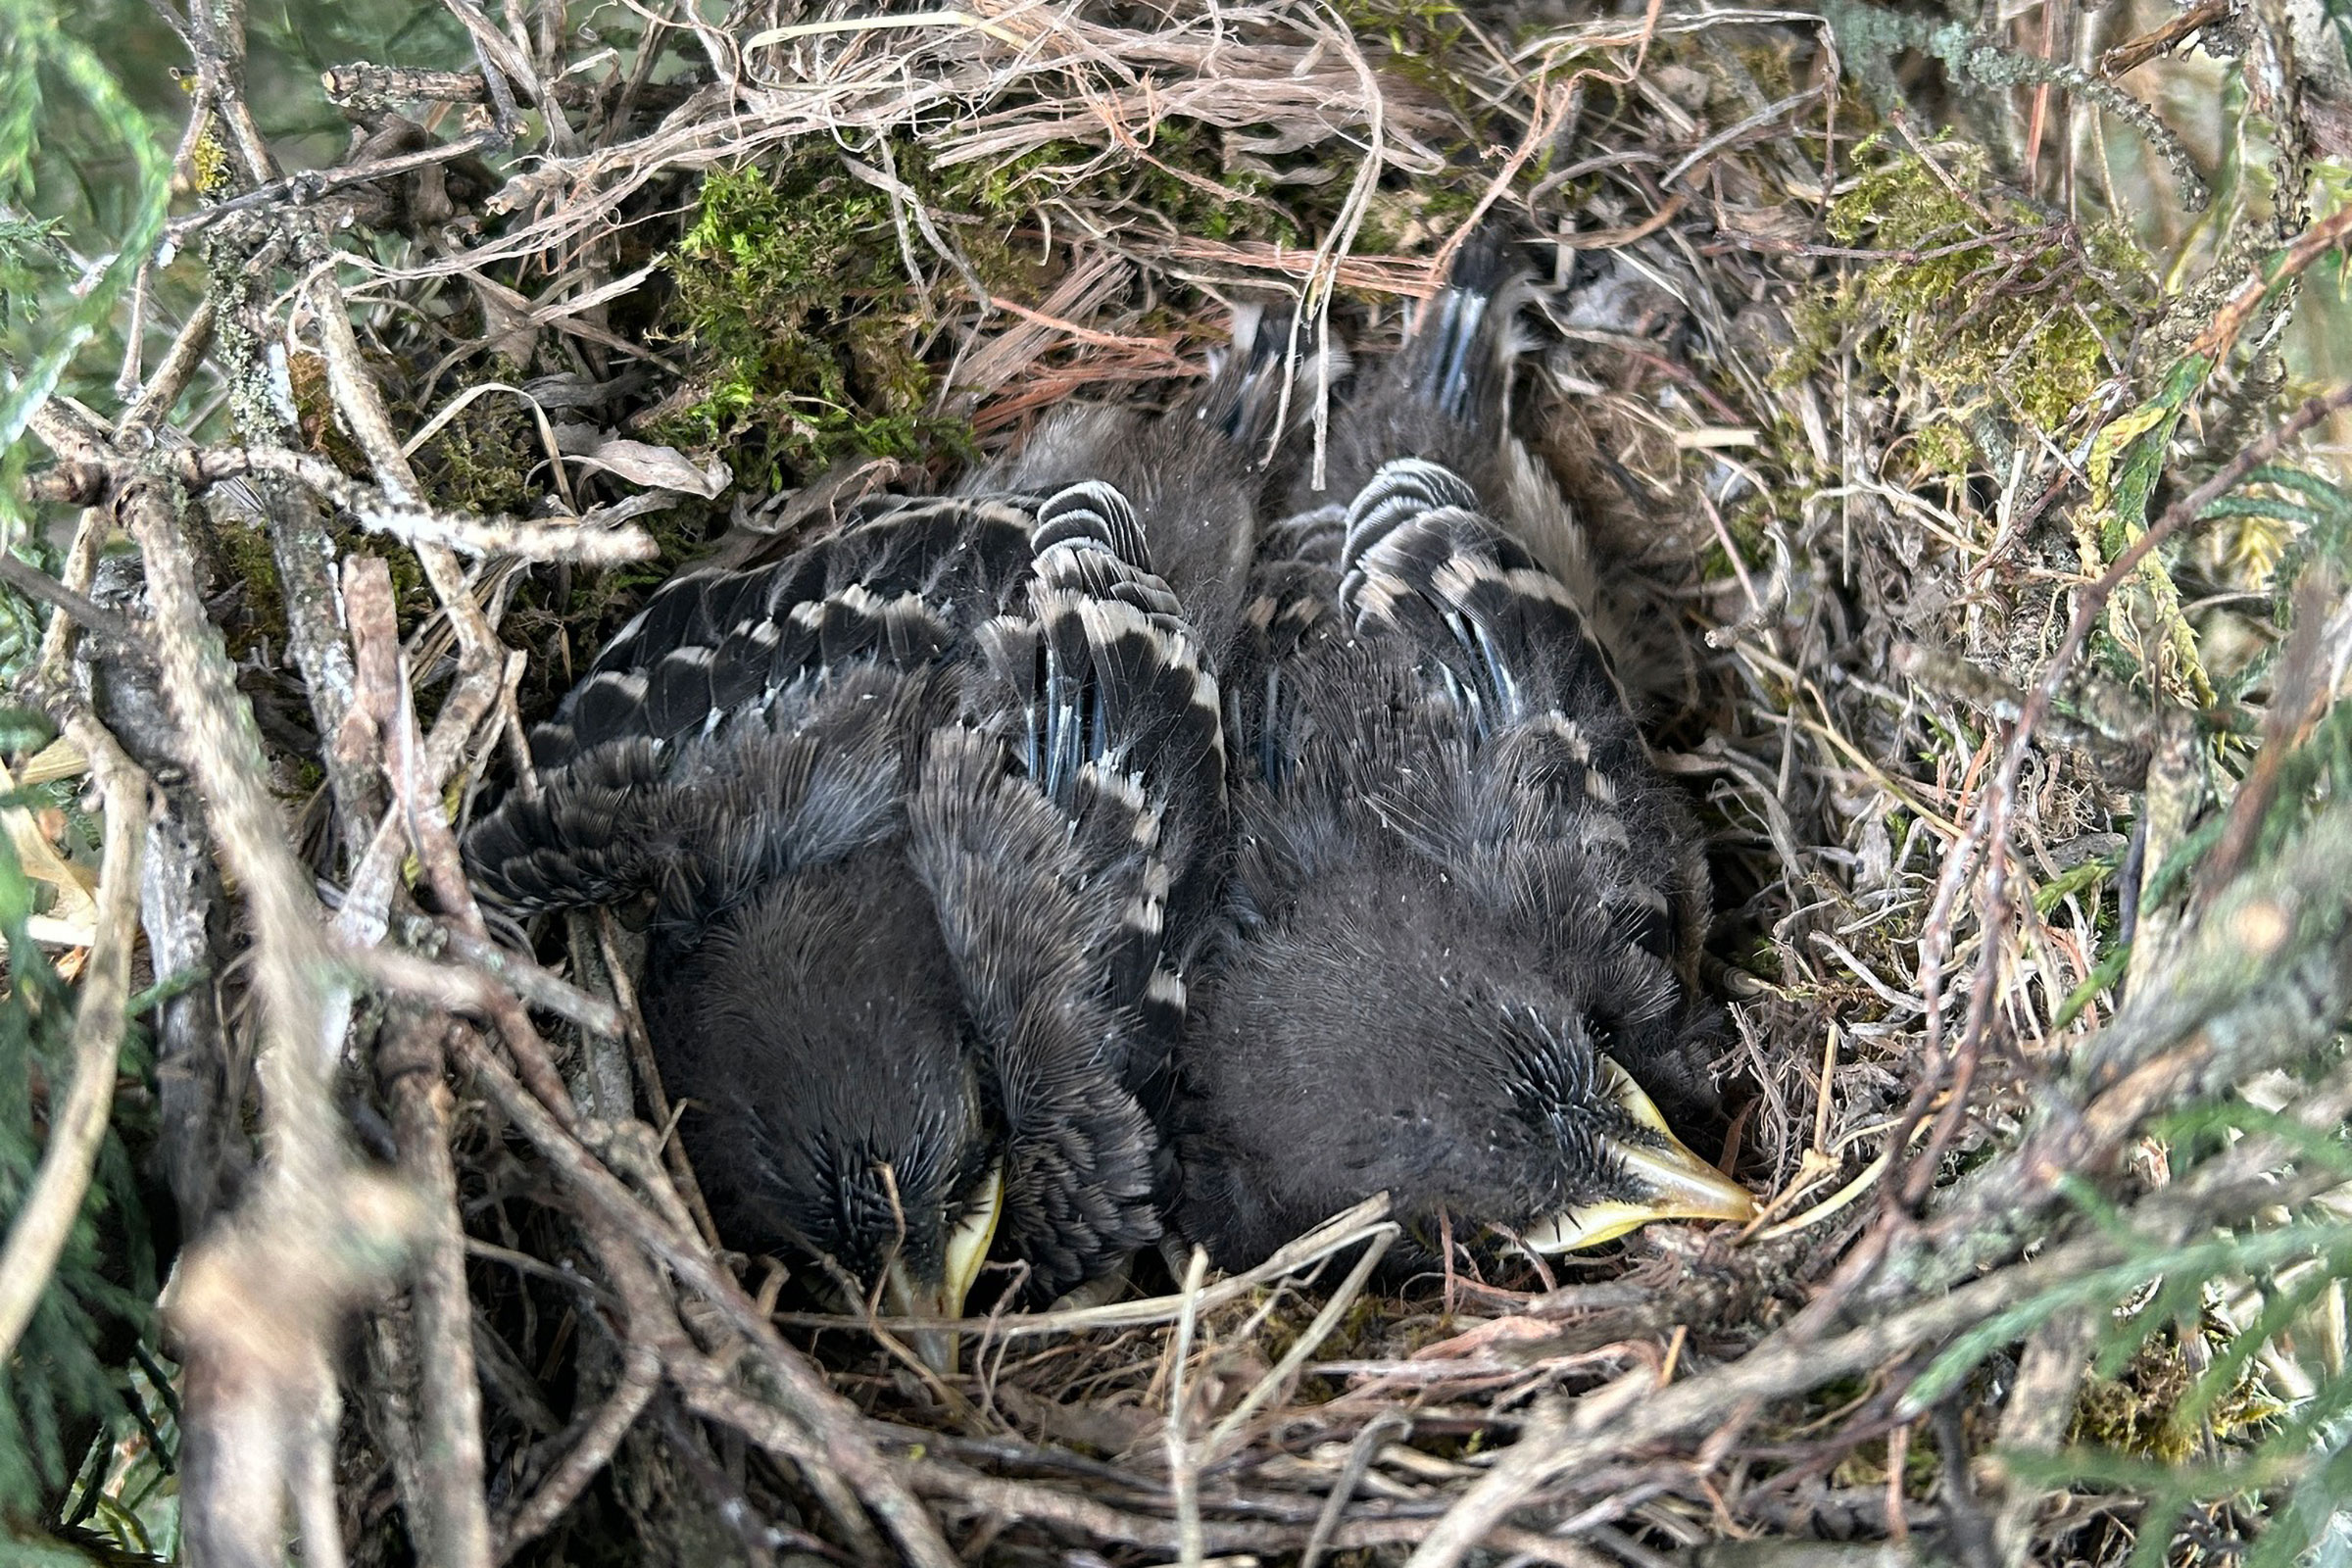
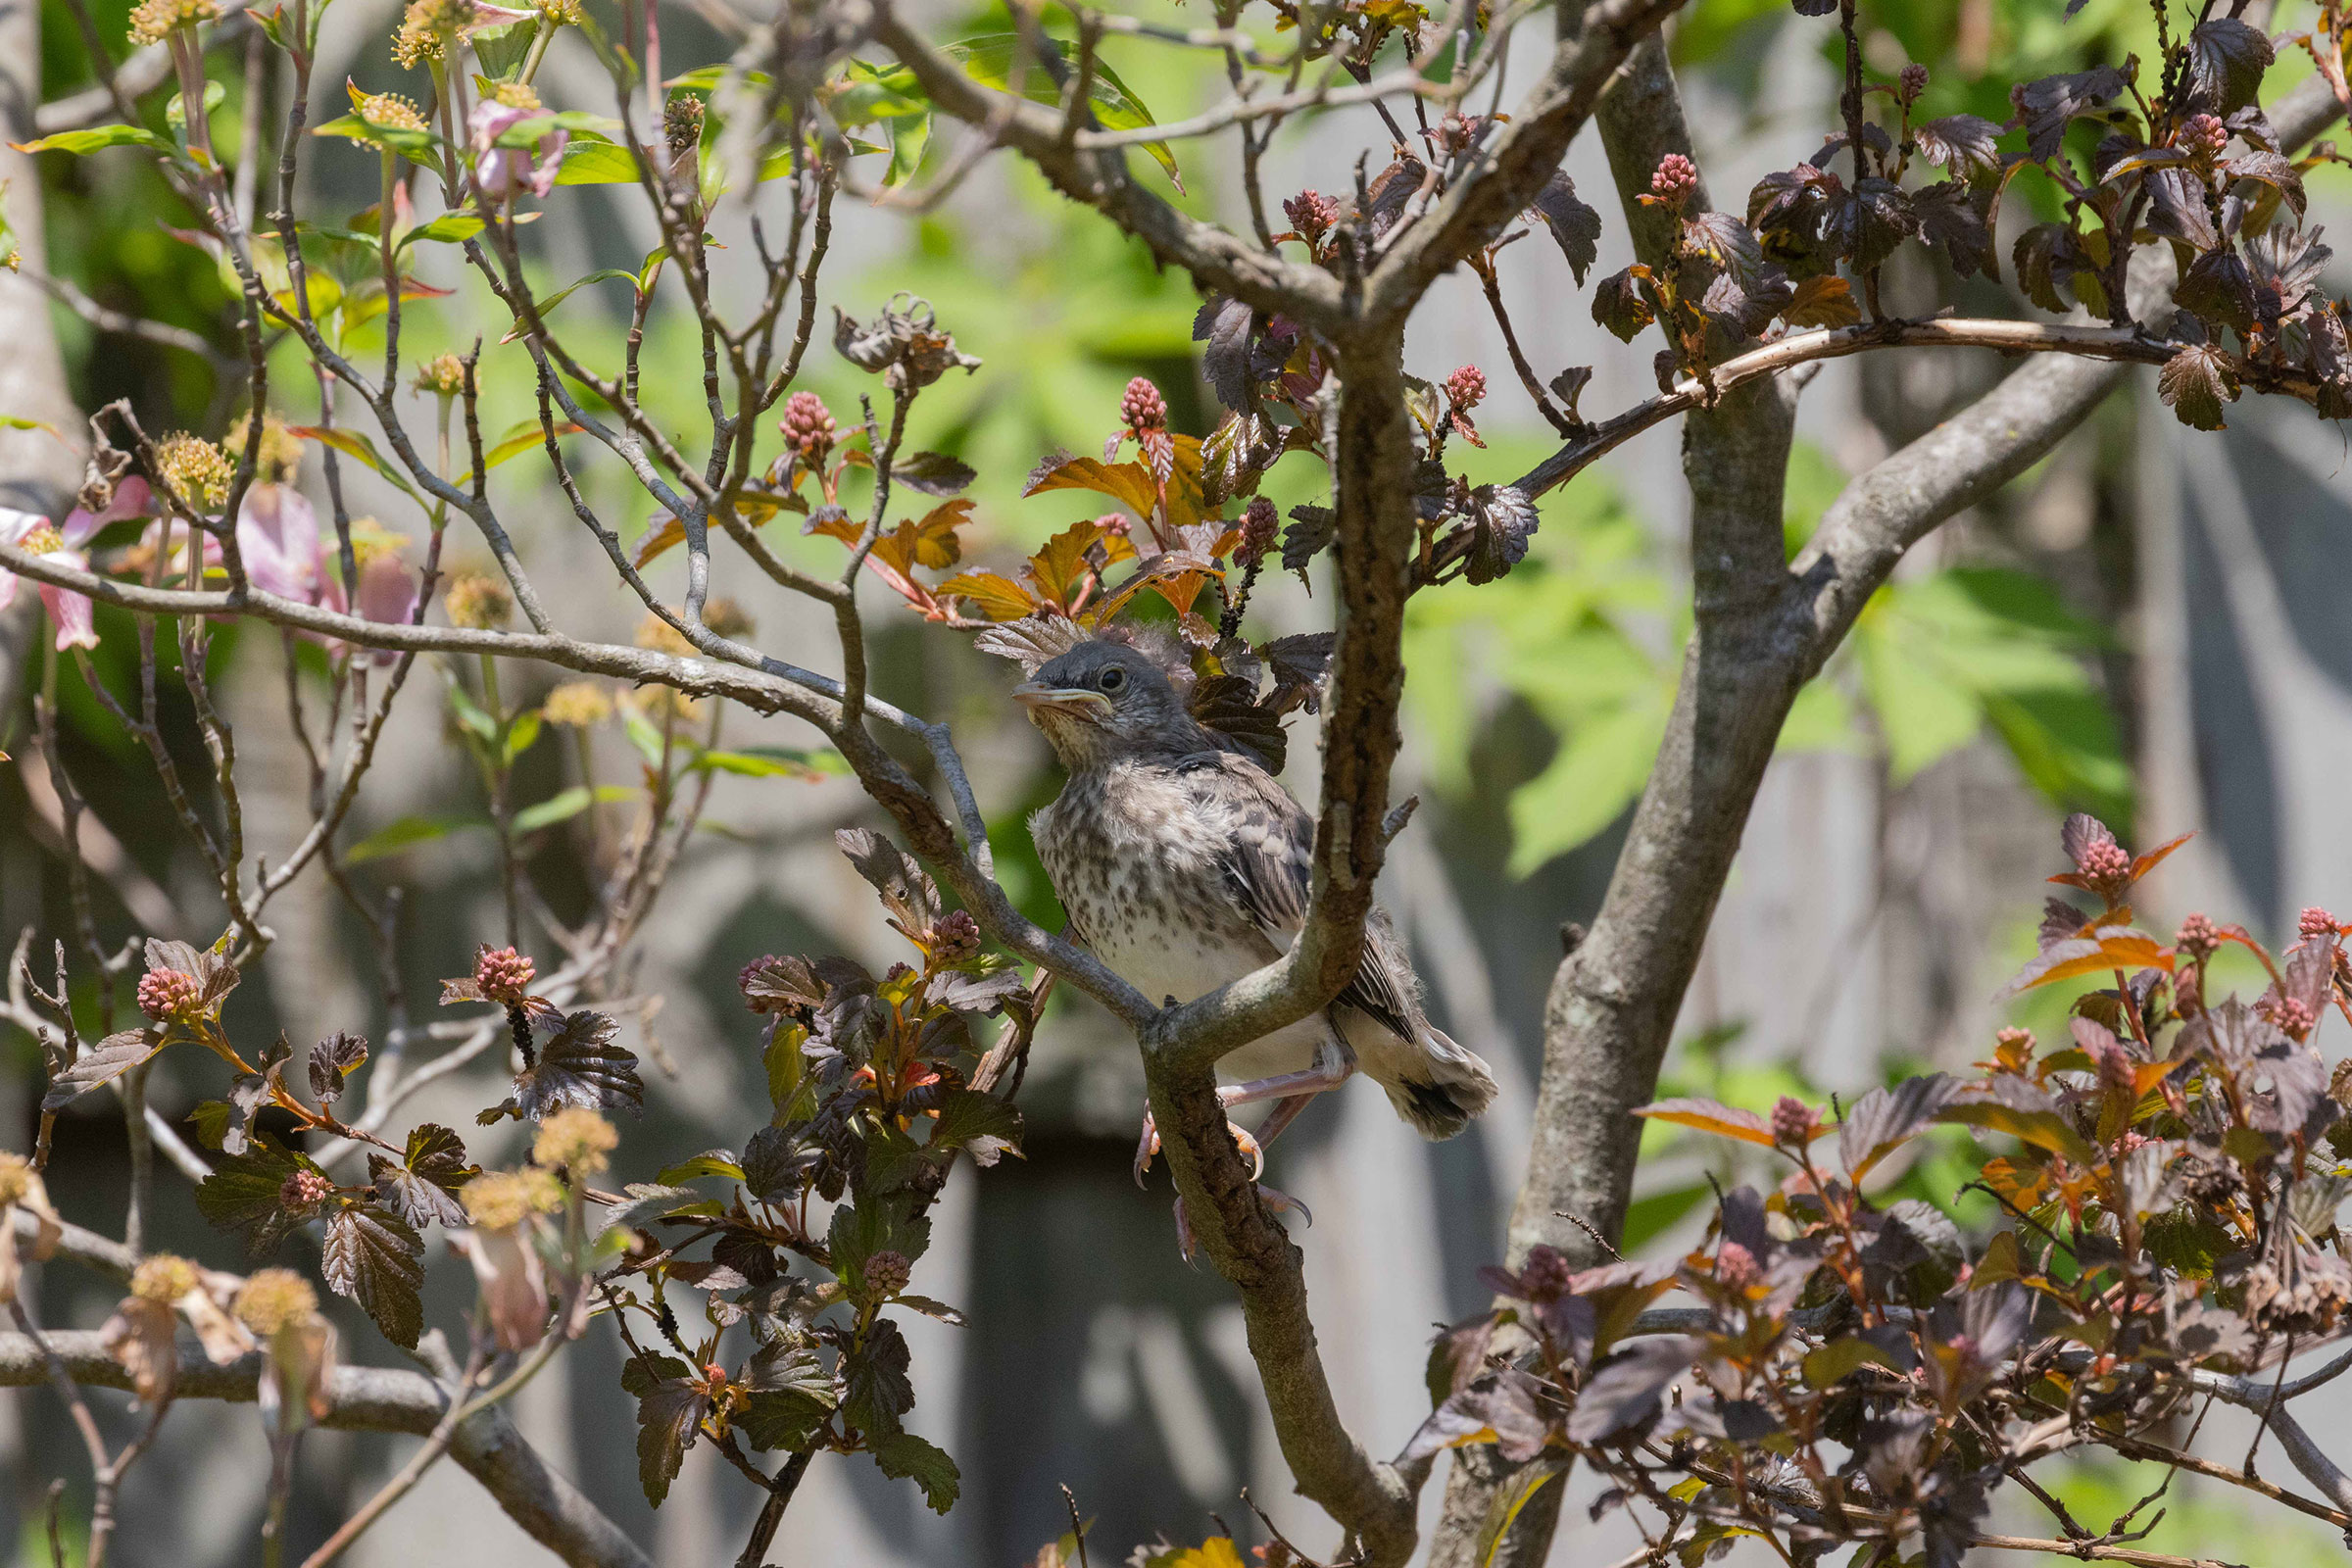
Northern Mockingbird nest building was observed as early as mid-January, while most breeding behaviors were observed starting in March and April. Breeding was confirmed primarily through observations of occupied nests (March 31 – August 6), adults carrying food (April 4 – August 31), adults feeding young (April 24 – September 18), and recently fledged young (April 25 – September 19) (Figure 6).
For more general information on the breeding habits of this species, please refer to All About Birds.
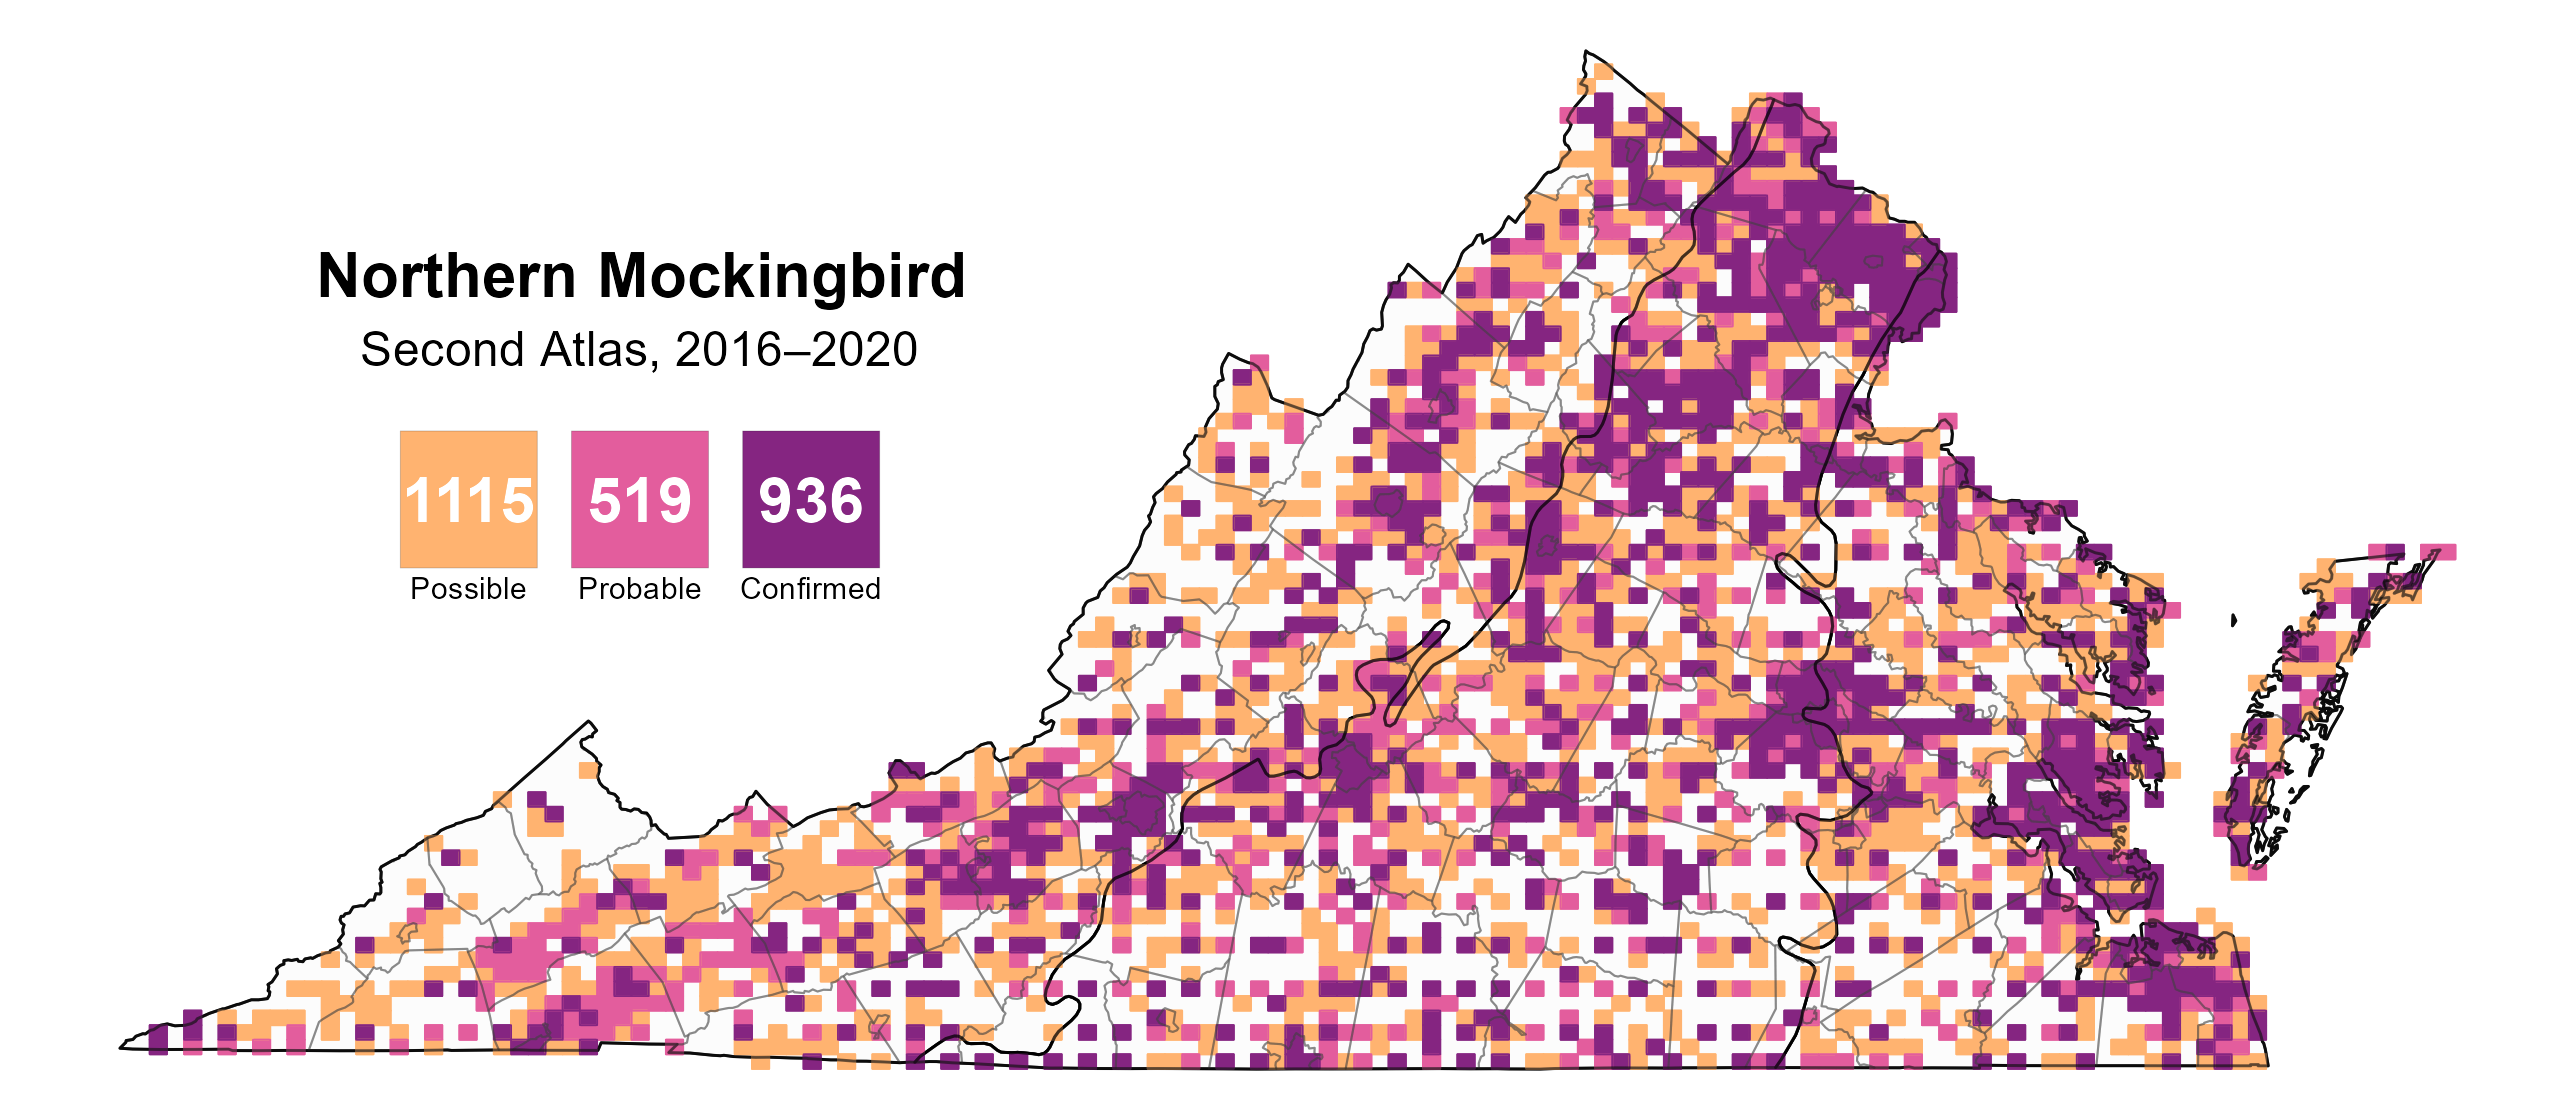
Figure 4: Northern Mockingbird breeding observations from the Second Atlas (2016–2020). The colored boxes illustrate Atlas blocks (approximately 10 mi2 [26 km2] survey units) where the species was detected. The colors show the highest breeding category recorded in a block. The numbers within the colors in the legend correspond to the number of blocks with that breeding evidence category.
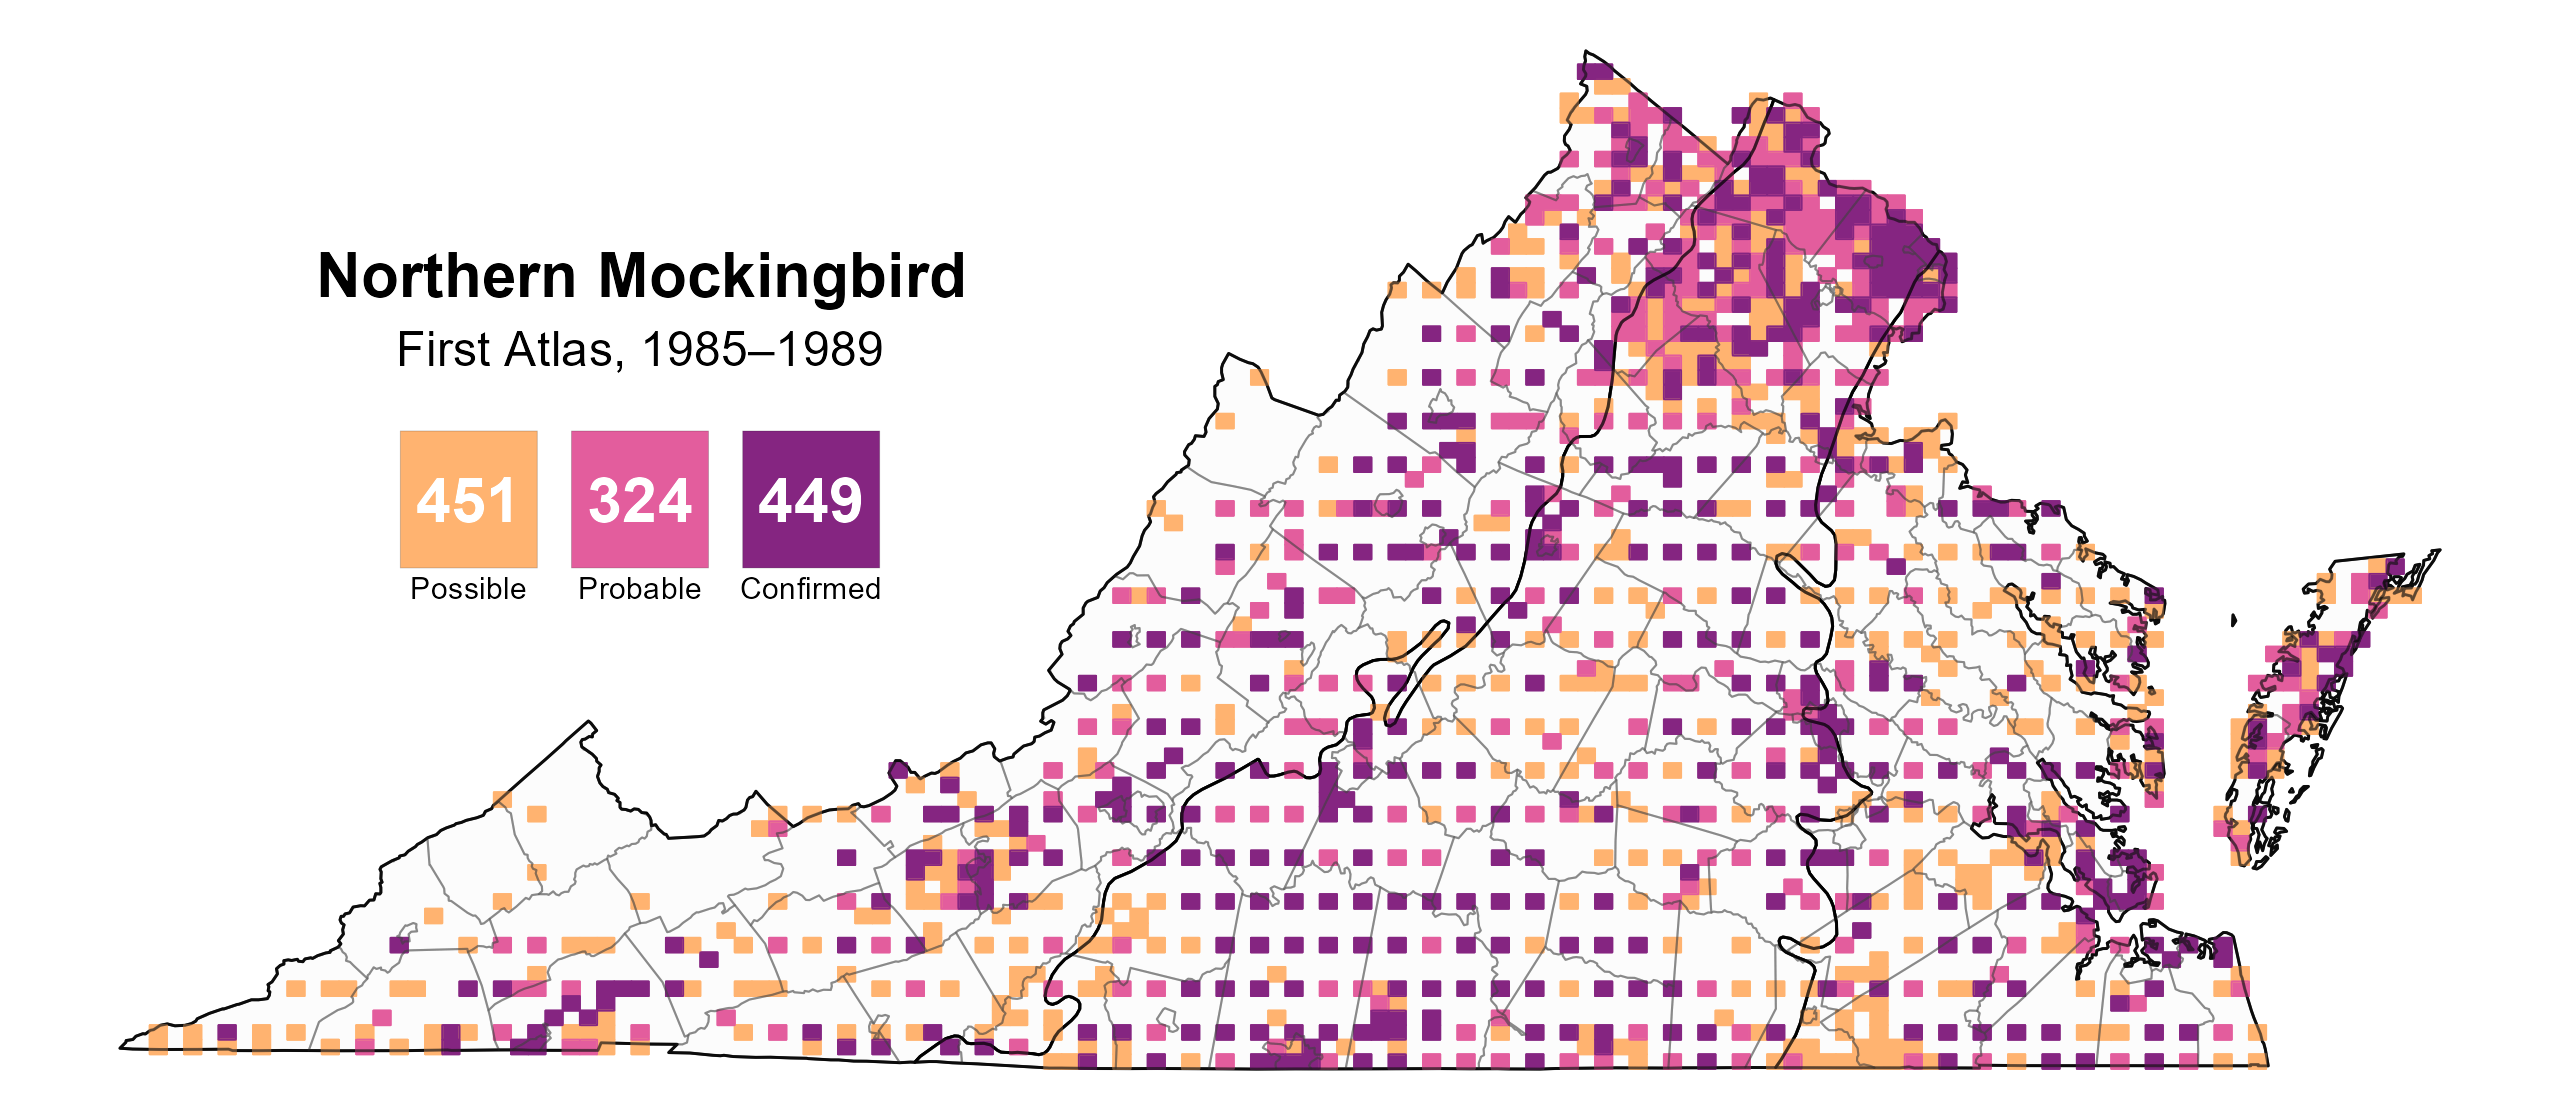
Figure 5: Northern Mockingbird breeding observations from the First Atlas (1985–1989). The colored boxes illustrate Atlas blocks (approximately 10 mi2 [26 km2] survey units) where the species was detected. The colors show the highest breeding category recorded in a block. The numbers within the colors in the legend correspond to the number of blocks with that breeding evidence category.
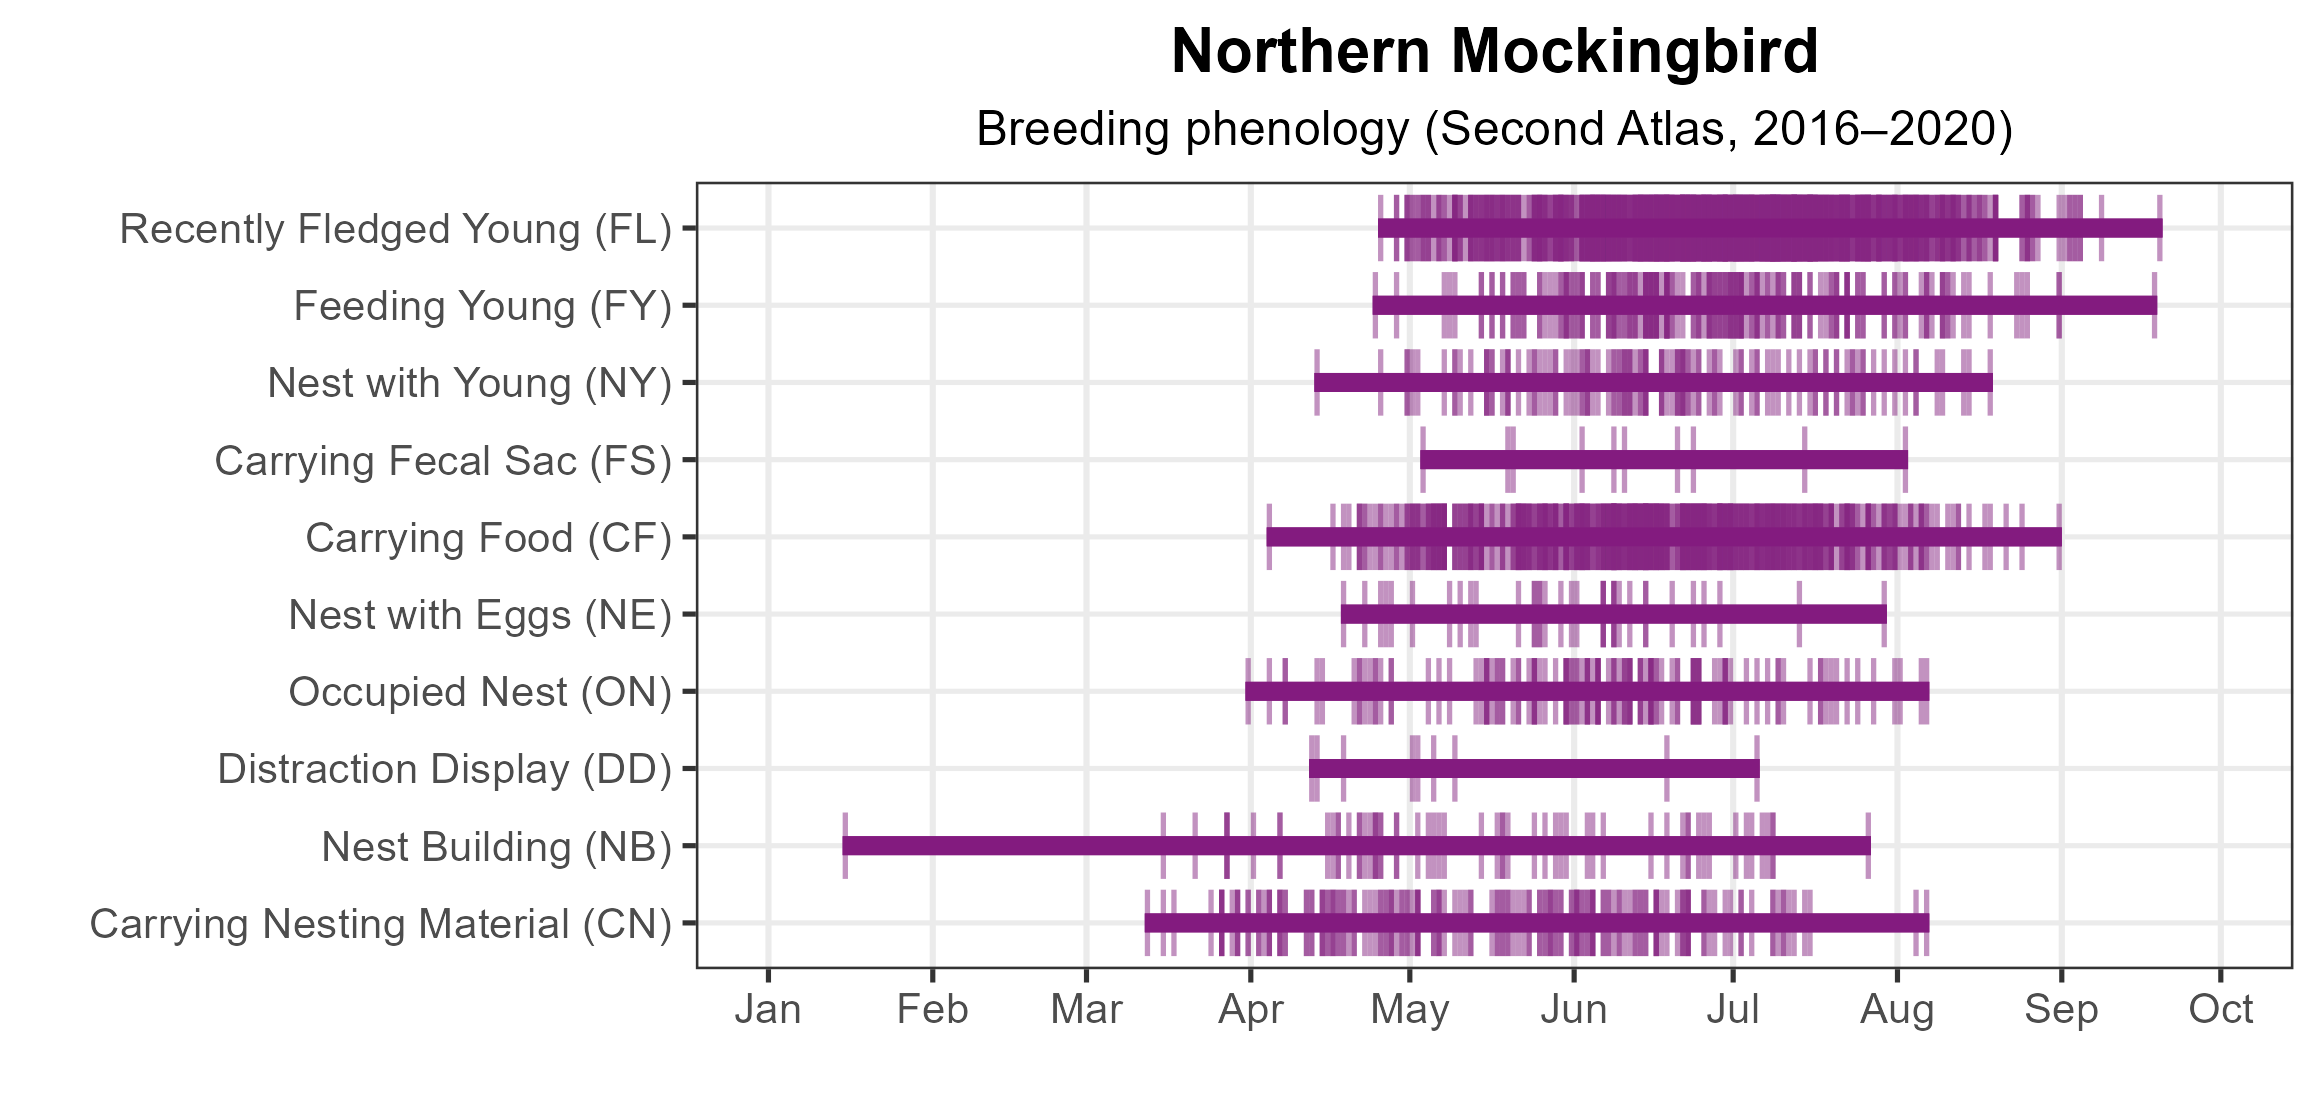
Figure 6: Northern Mockingbird phenology: confirmed breeding codes. This graph shows a timeline of confirmed breeding behaviors. Tick marks represent individual observations of the behavior.
Population Status
Northern Mockingbird relative abundance was estimated to be the highest in rural farming areas and near urban landscapes (Figure 7). The lowest levels occurred in heavily forested regions of the western Mountains and Valleys region (Figure 7).
The total estimated Northern Mockingbird population in the state is approximately 952,000 individuals (with a range between 776,000 and 1,170,000). Based on the North American Breeding Bird Survey (BBS), the Northern Mockingbird population declined by a significant 1.4% annually from 1966–2022 in Virginia, and between Atlases, its population decreased by a significant 0.63% per year from 1987–2018 (Hostetler et al. 2023; Figure 8).
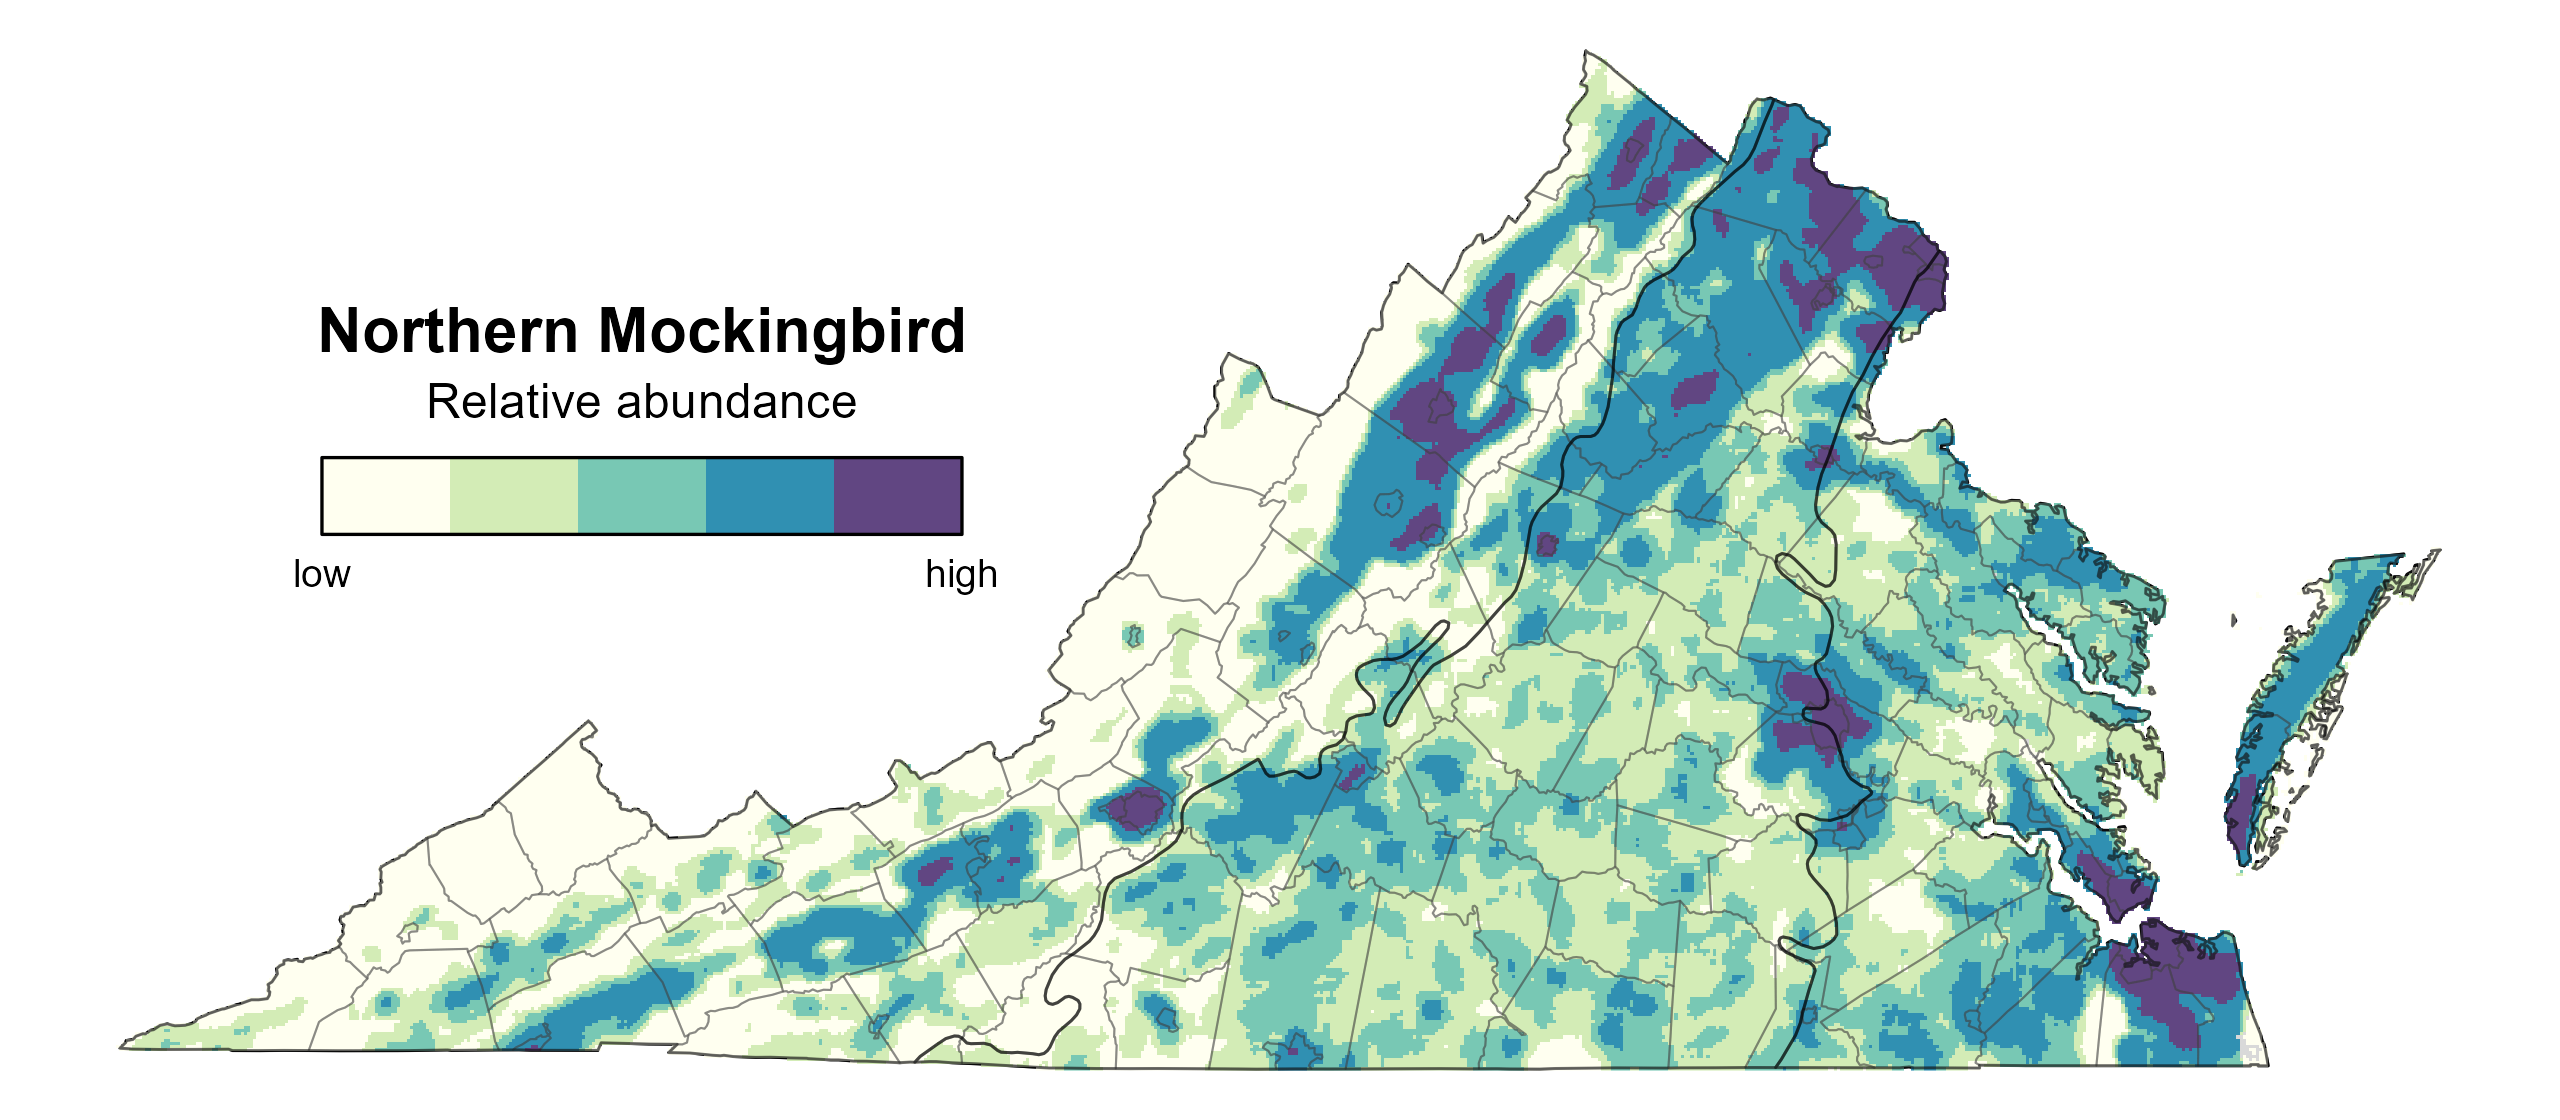
Figure 7: Northern Mockingbird relative abundance (Second Atlas, 2016–2020). This map indicates the predicted abundance of this species at a 0.4 mi2 (1 km2) scale based on environmental (including habitat) factors. Abundance values are presented on a relative scale of low to high.

Figure 8: Northern Mockingbird population trend for Virginia as estimated by the North American Breeding Bird Survey. The vertical axis shows species abundance; the horizontal axis shows the year. The solid line indicates the estimated population trend; there is a 97.5% probability that the true population trend falls between the dashed lines. The shaded bars indicate the First and Second Atlas periods.
Conservation
Northern Mockingbirds have experienced a slight decline in the Commonwealth, which could be due to changes from smaller farms to larger agricultural complexes that have less edge habitat and to efforts focused on reforesting agricultural and pasture lands (Fansworth et al. 2020). Given their decline, Northern Mockingbirds are included in the 2025 Virginia Wildlife Action Plan as a Tier IV Species of Greatest Conservation Need (Moderate Conservation Need) (VDWR 2025).
Interactive Map
The interactive map contains up to six Atlas layers (probability of occurrence for the First and Second Atlases, change in probability of occurrence between Atlases, breeding evidence for the First and Second Atlases, and abundance for the Second Atlas) that can be viewed one at a time. To view an Atlas map layer, mouse over the layer box in the upper left. County lines and physiographic regional boundaries (Mountains and Valleys, Piedmont, and Coastal Plain) can be turned on and off by checking or unchecking the box below the layer box. Within the map window, users can hover on a block to see its value for each layer and pan and zoom to see roads, towns, and other features of interest that are visible beneath a selected layer.
View Interactive Map in Full Screen
References
Farnsworth, G., G. A. Londono, J. U. Martin, K. C. Derrickson, and R. Breitwisch (2020). Northern Mockingbird (Mimus polyglottos), version 1.0. In Birds of the World (A. F. Poole, Editor). Cornell Lab of Ornithology, Ithaca, NY, USA. https://doi.org/10.2173/bow.normoc.01.
Hostetler, J. A., J. R. Sauer, J. E. Hines, D. Ziolkowski, and M. Lutmerding (2023). The North American breeding bird survey, analysis results 1966–2022. U.S. Geological Survey, Laurel, MD, USA. https://doi.org/10.5066/P9SC7T11.
Virginia Department of Wildlife Resources (VDWR) (2025). Virginia wildlife action plan. Virginia Department of Wildlife Resources, Henrico, VA, USA. 506 pp.