Introduction
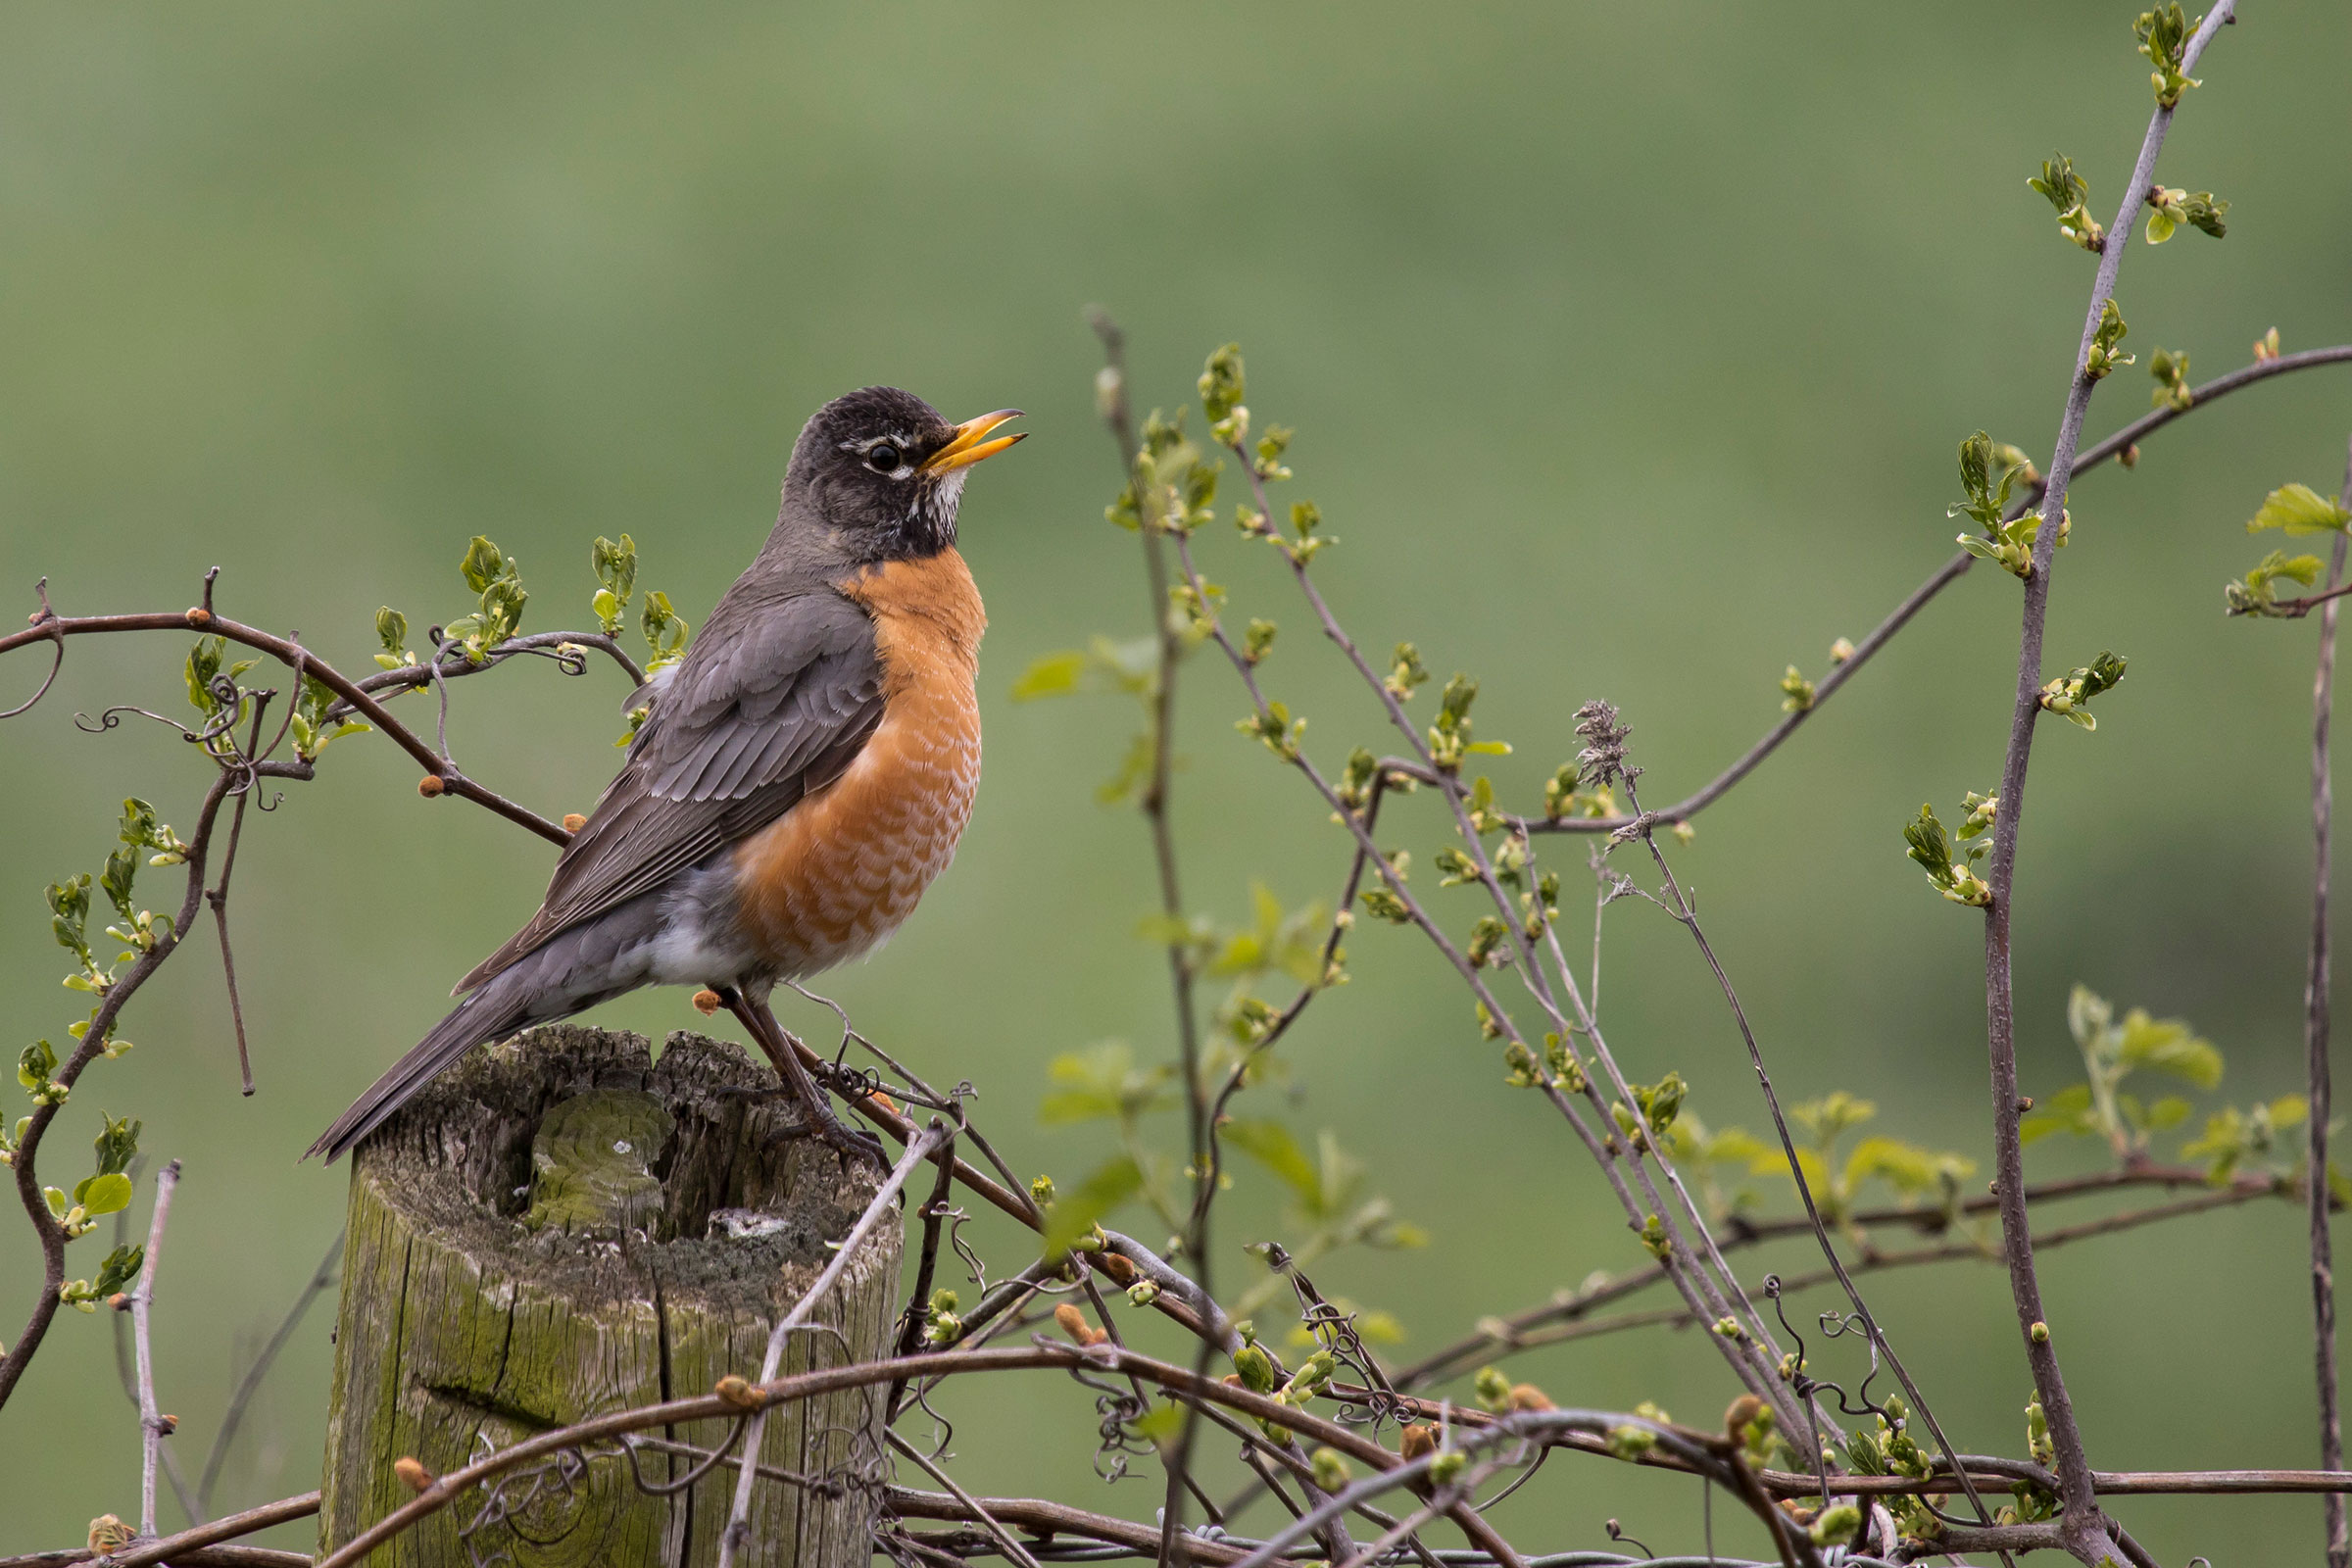
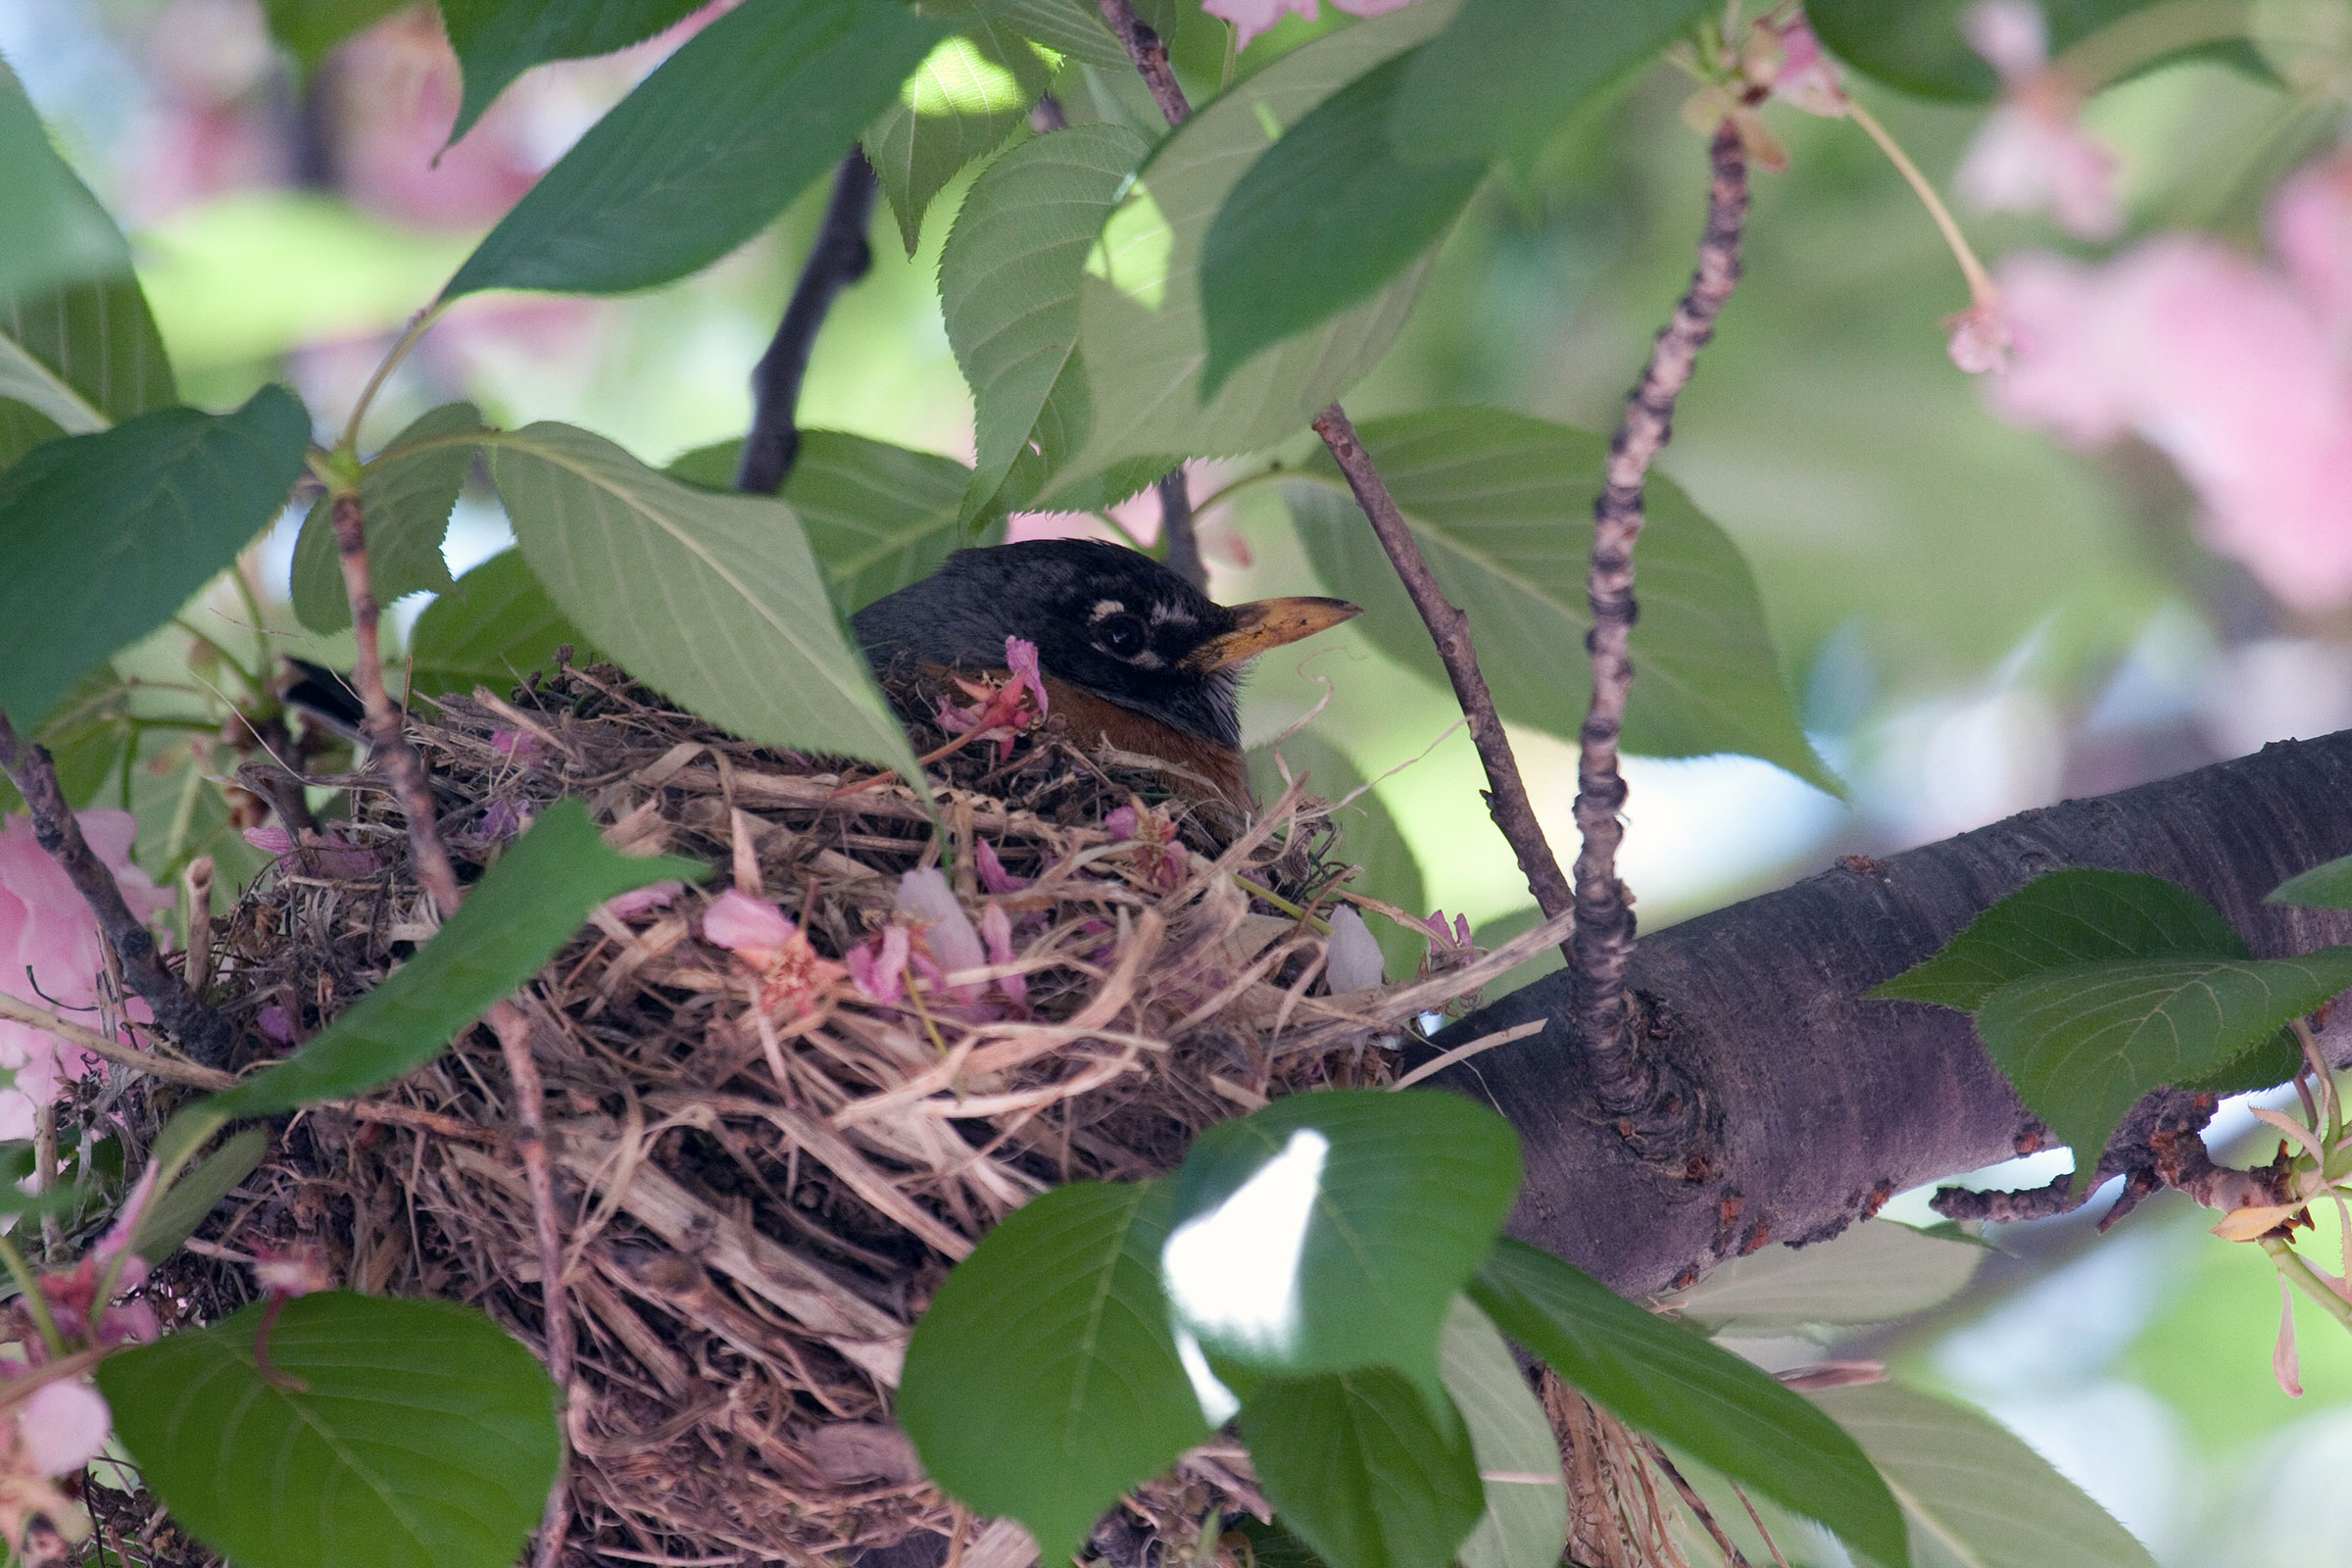
The American Robin is perhaps the most well-known bird in Virginia and throughout North America. It is often the first bird that children learn about at home and in school. In Virginia, the American Robin is a ubiquitous presence in yards, athletic fields, parks, farms, and forests. Surprisingly, it is equally prevalent on the tallest mountains as it is in suburban backyards with at least a small patch of grass. One of the first signs of spring, the American Robin is often the species we think of when uttering the phrase, “the early bird gets the worm” (Vanderhoff et al. 2020).
Breeding Distribution
The American Robin occurs throughout Virginia but has the highest likelihood of occurring in the Mountains and Valleys region and the northern part of the Piedmont region (Figure 1). In the remainder of the Piedmont region and throughout the Coastal Plain, the probability of this species occurring is less consistent, with a few areas of moderate to low occupancy. Their likelihood of occurrence is not associated with any one environmental variable because American Robins have high occupancy across most of the state.
Between the First and Second Breeding Bird Atlases (Figures 1 and 2), American Robin occurrence remained constant across the state (Figure 3).
View Environmental Associations
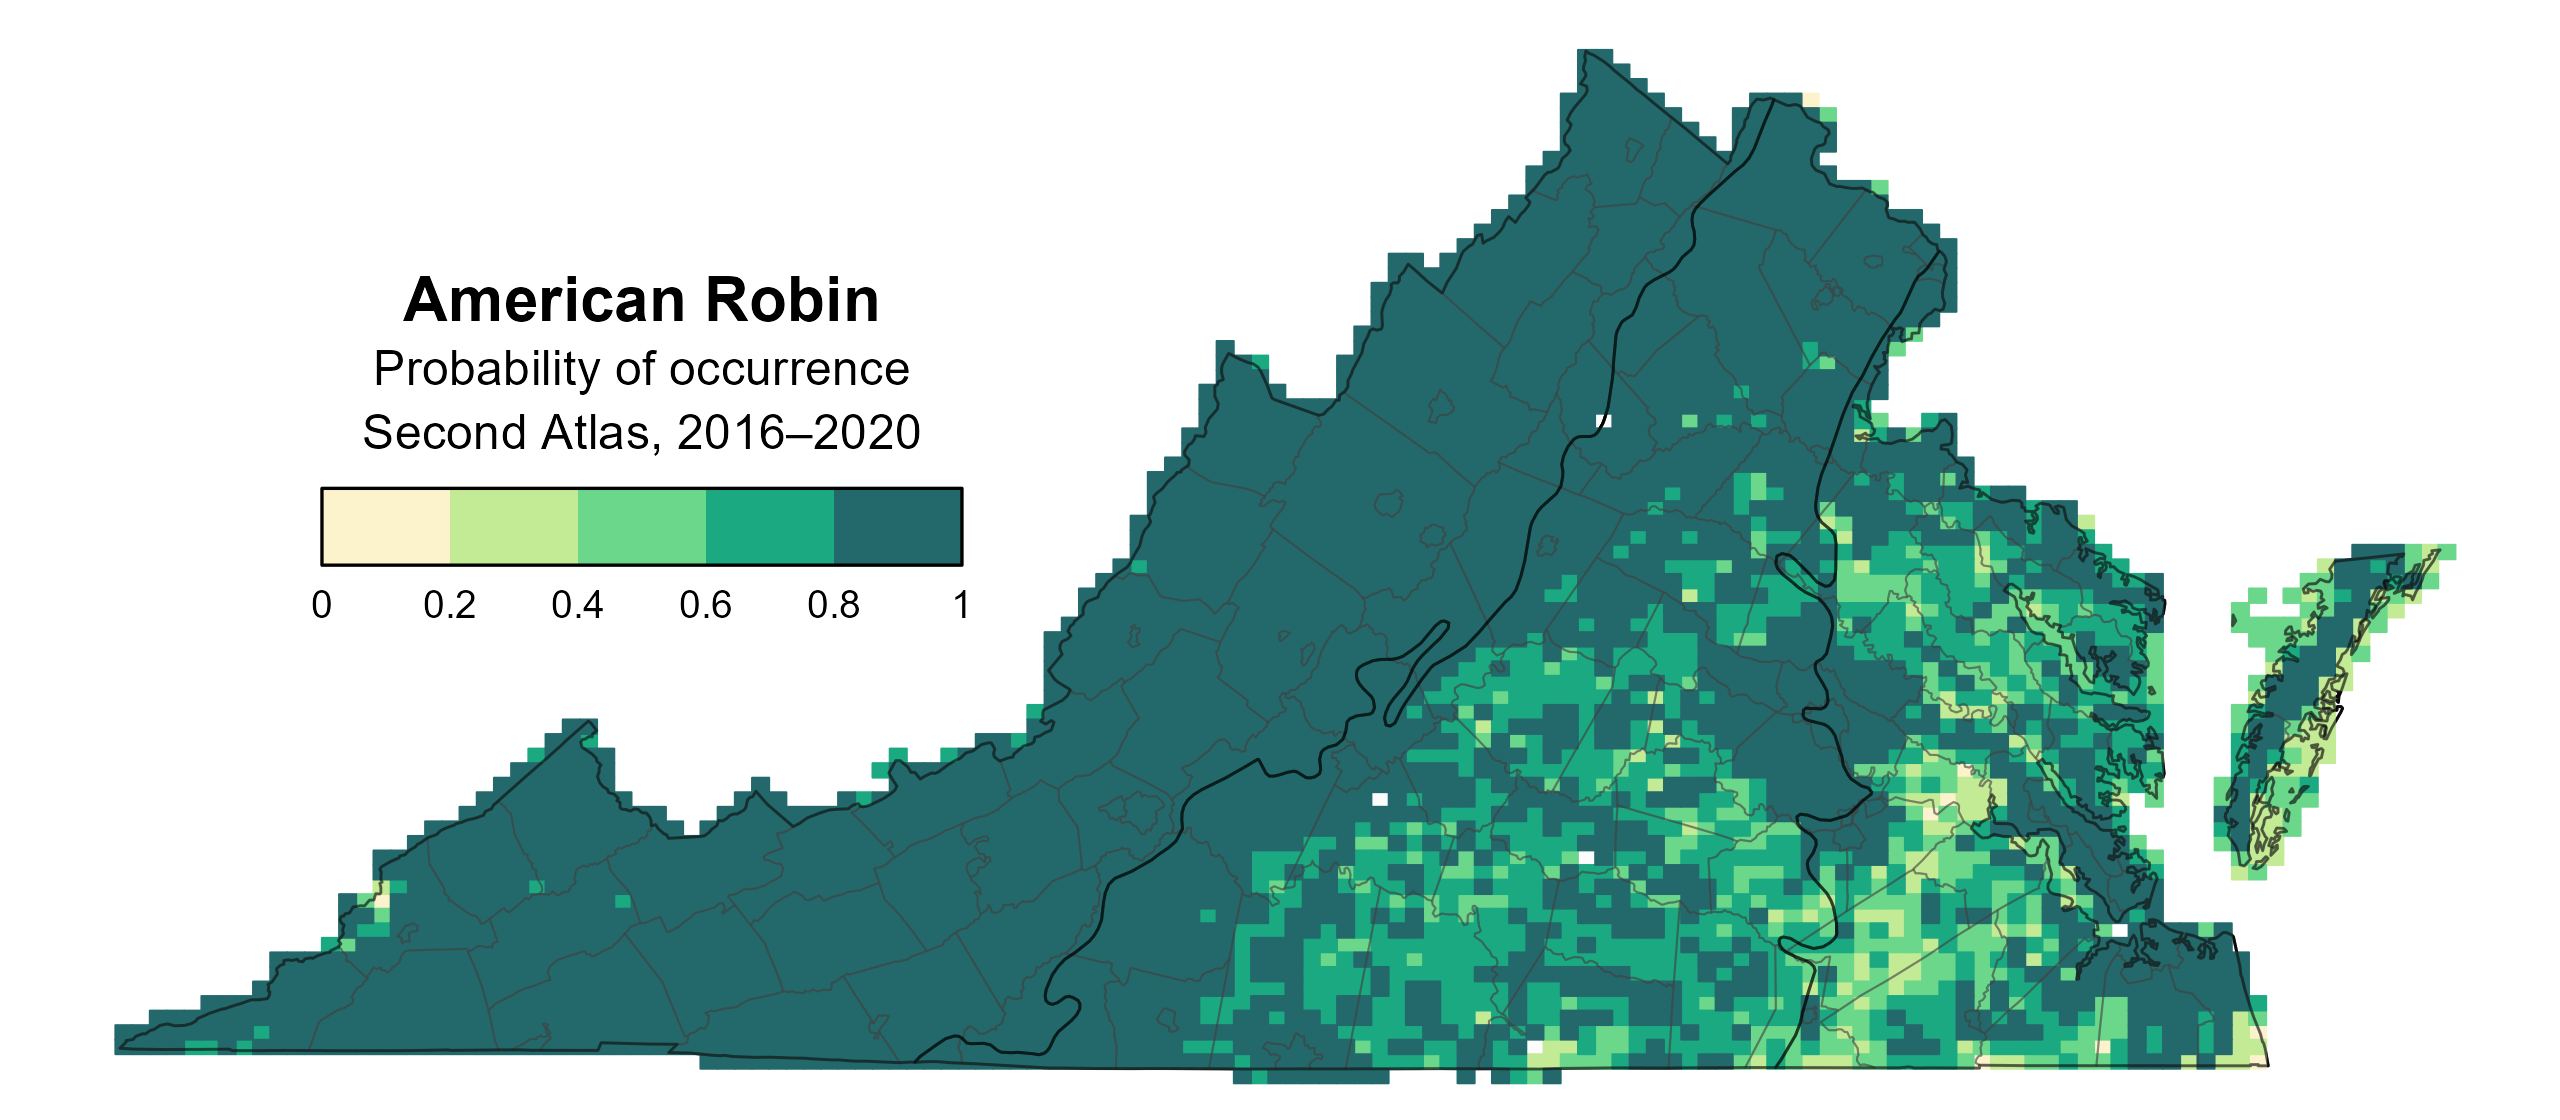
Figure 1: American Robin breeding distribution based on probability of occurrence (Second Atlas, 2016–2020). This map indicates the probability that this species will occur in an Atlas block (an approximately 10 mi2 [26 km2] survey unit) based on environmental (including habitat) factors and after adjusting for the probability of detection (variation in survey effort among blocks).

Figure 2: American Robin breeding distribution based on probability of occurrence (First Atlas, 1985–1989). This map indicates the probability that this species will occur in an Atlas block (an approximately 10 mi2 [26 km2] survey unit) based on environmental (including habitat) factors and after adjusting for the probability of detection (variation in survey effort among blocks). Blocks in white were not surveyed during the First Atlas and were not modeled.
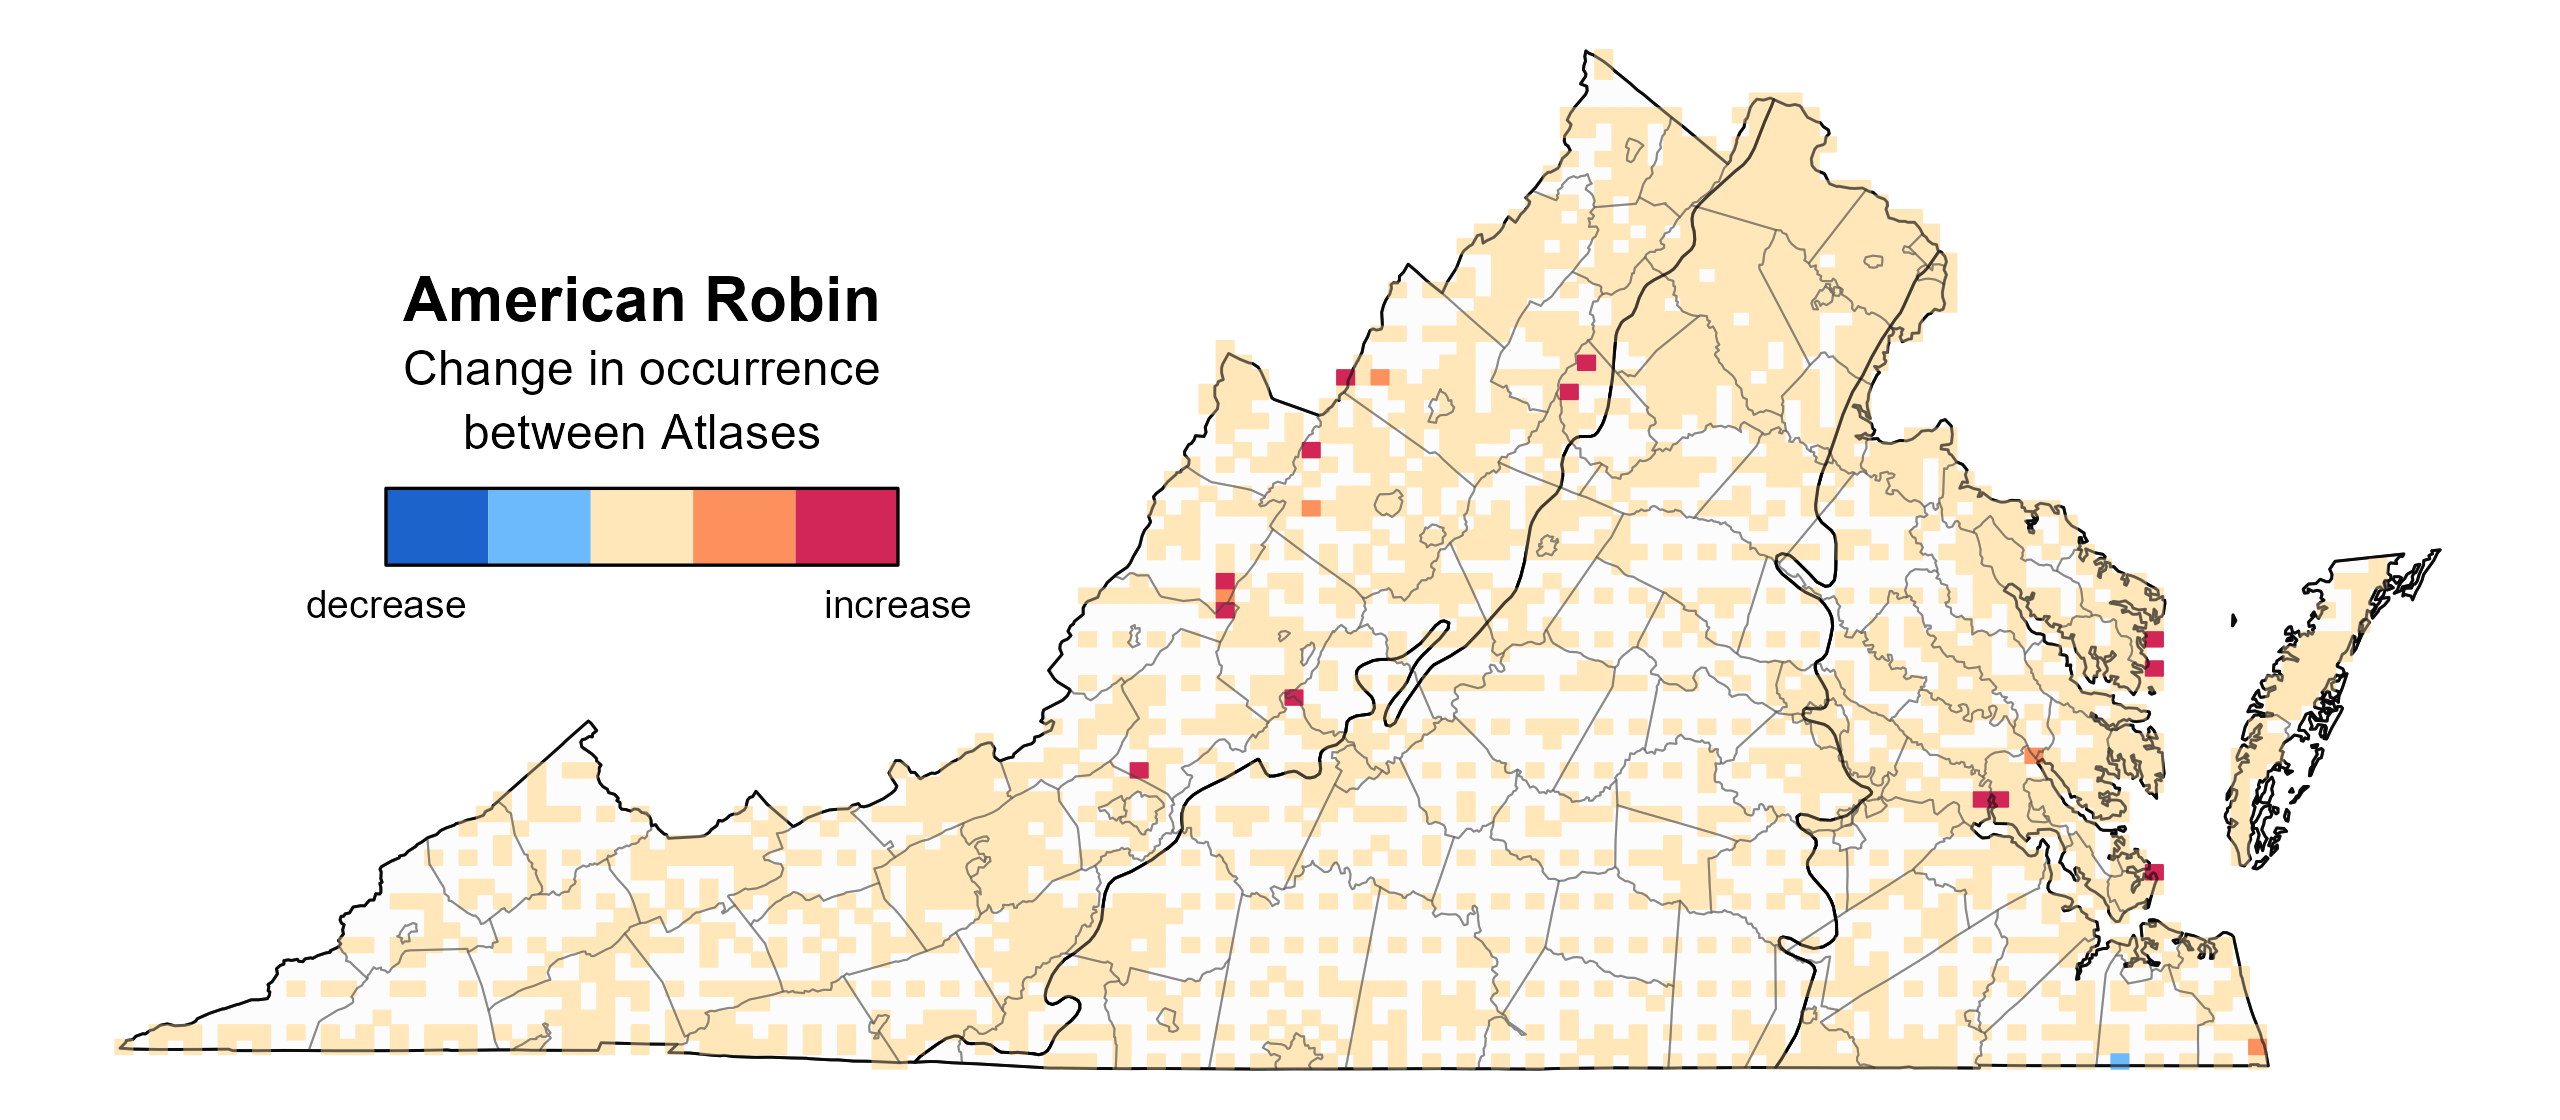
Figure 3: American Robin change in breeding distribution between Atlases (1985–1989 and 2016–2020) based on probability of occurrence. This map indicates the change in the probability that this species will occur in a block (an approximately 10 mi2 [26 km2] survey unit) between Atlas periods. Blocks with no change (tan) may have constant presence or constant absence. Blocks in white were not surveyed during the First Atlas and were not modeled.
Breeding Evidence
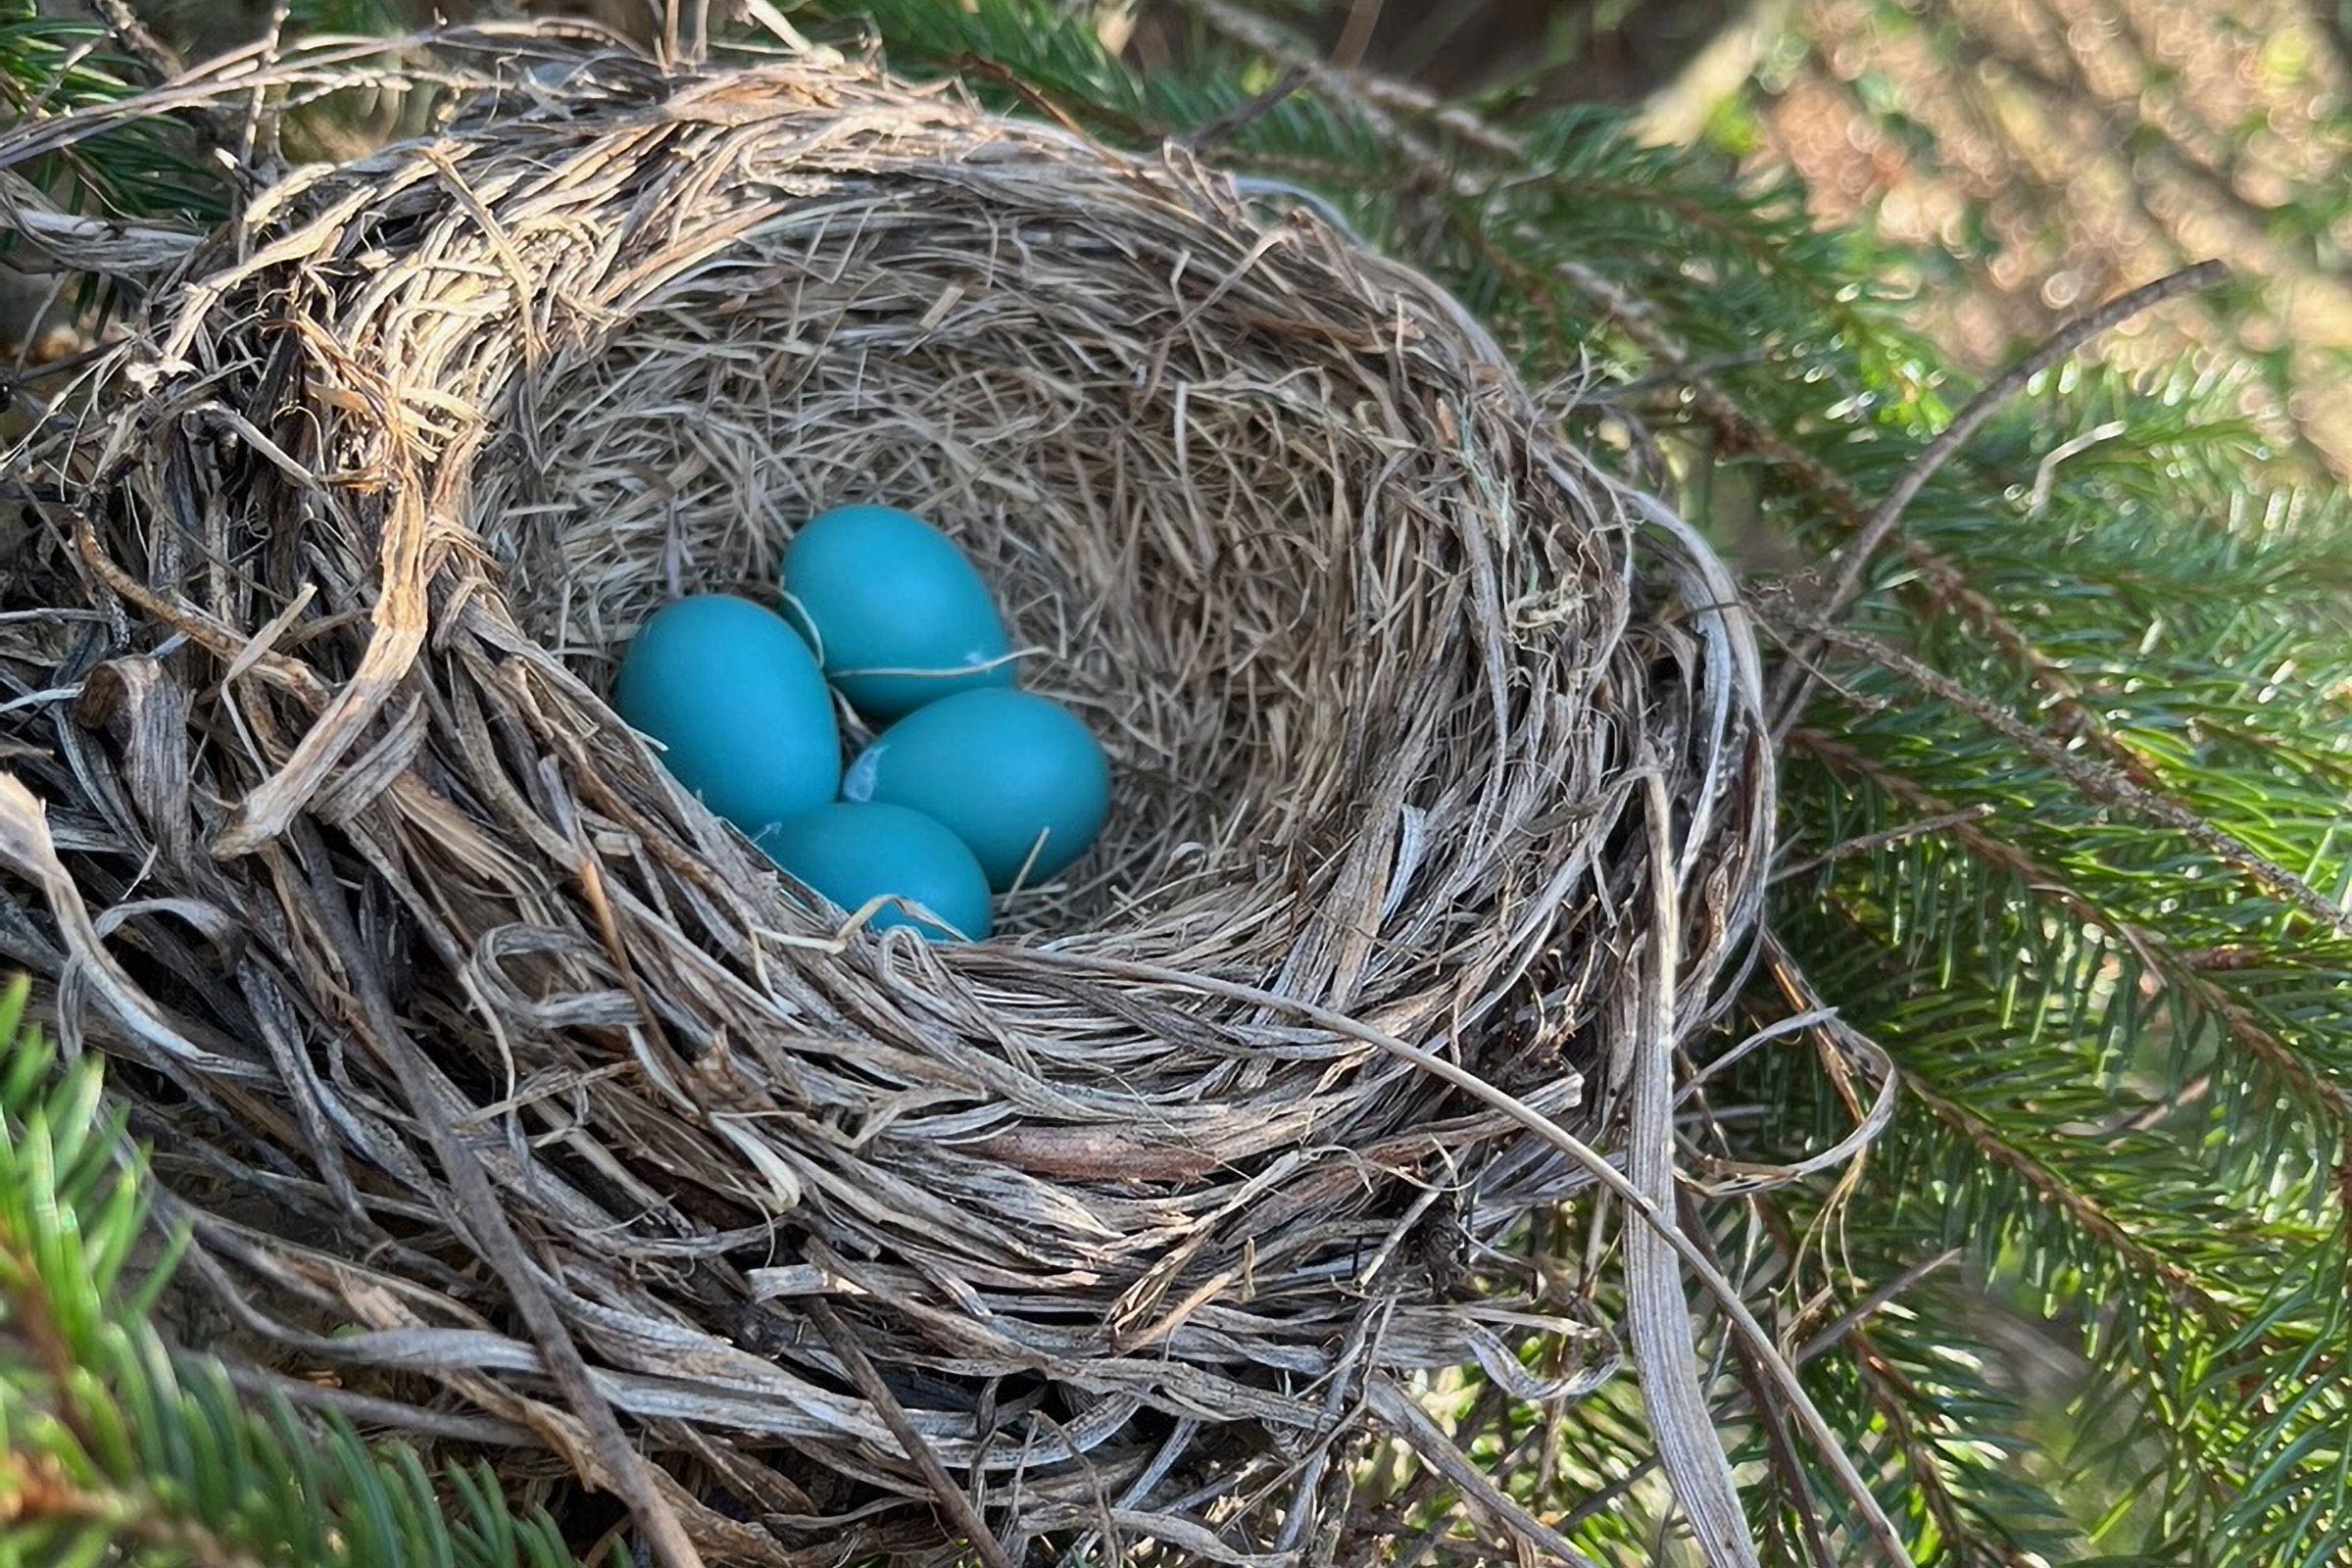
American Robins were confirmed breeders in 1,223 blocks and 131 of the state’s 133 counties (Figure 4). This species was a confirmed breeder across the state during the First Atlas as well (Figure 5).
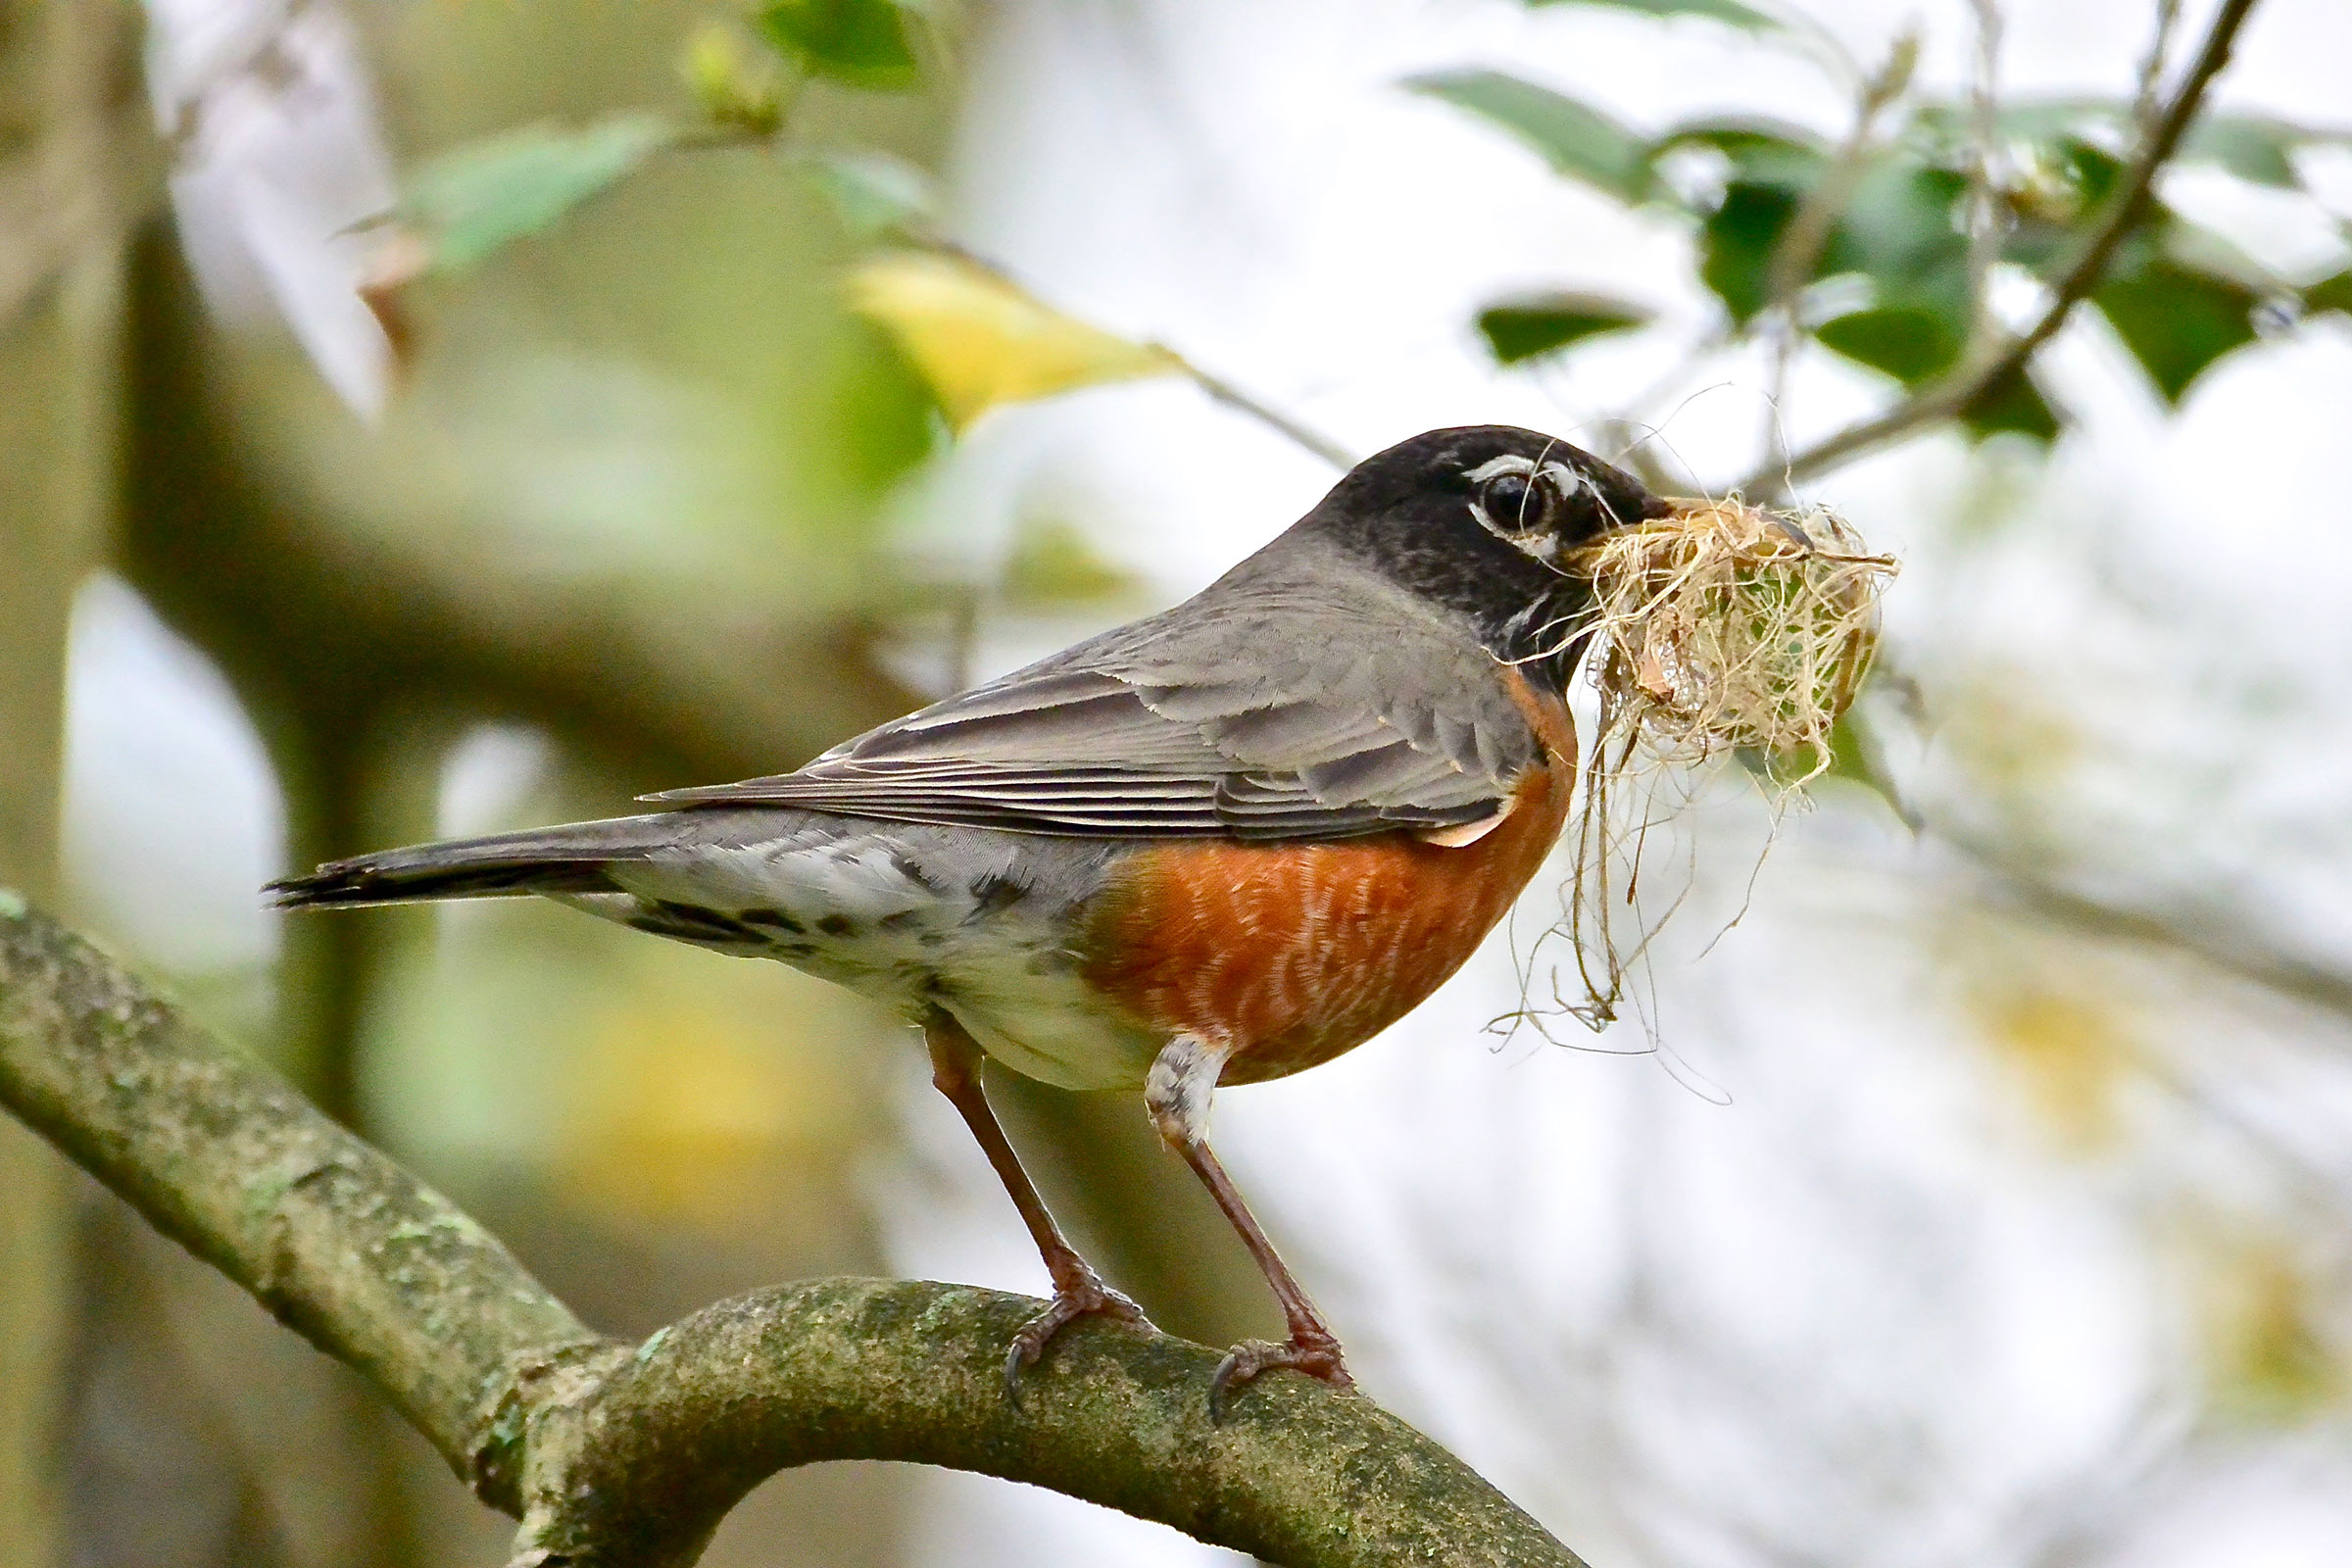
Recently fledged young and adults carrying nesting material were the earliest recorded breeding behaviors on February 15 and February 16, respectively. Other frequently observed breeding behaviors included adults carrying food (April 13 – September 2) and occupied nests (March 25 – August 7) (Figure 6).
For more general information on the breeding habits of this species, please refer to All About Birds.
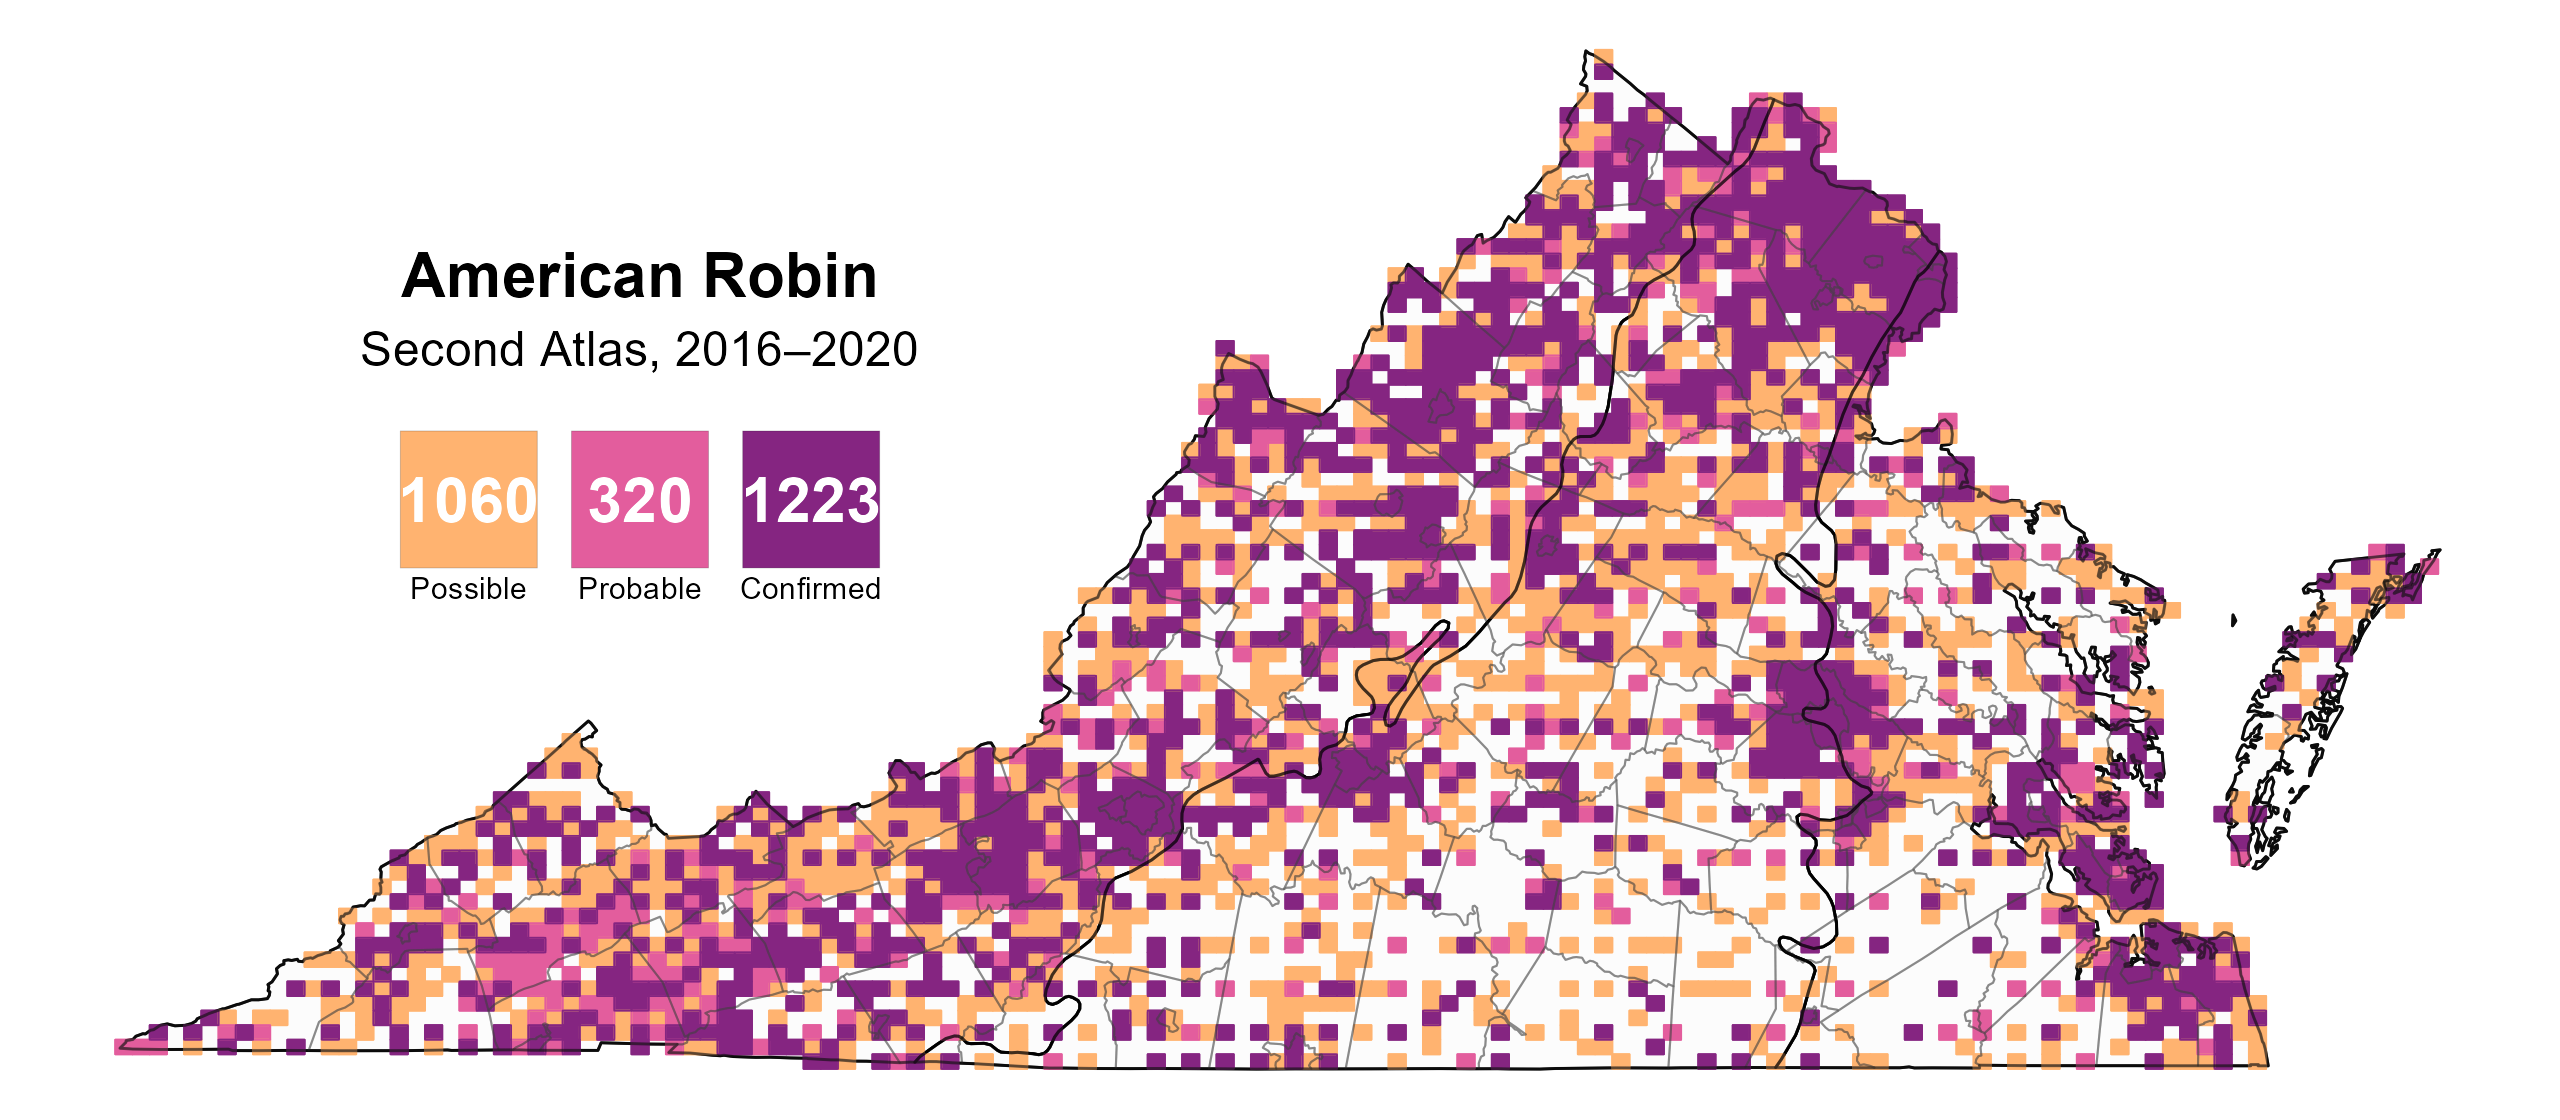
Figure 4: American Robin breeding observations from the Second Atlas (2016–2020). The colored boxes illustrate Atlas blocks (approximately 10 mi2 [26 km2] survey units) where the species was detected. The colors show the highest breeding category recorded in a block. The numbers within the colors in the legend correspond to the number of blocks with that breeding evidence category.
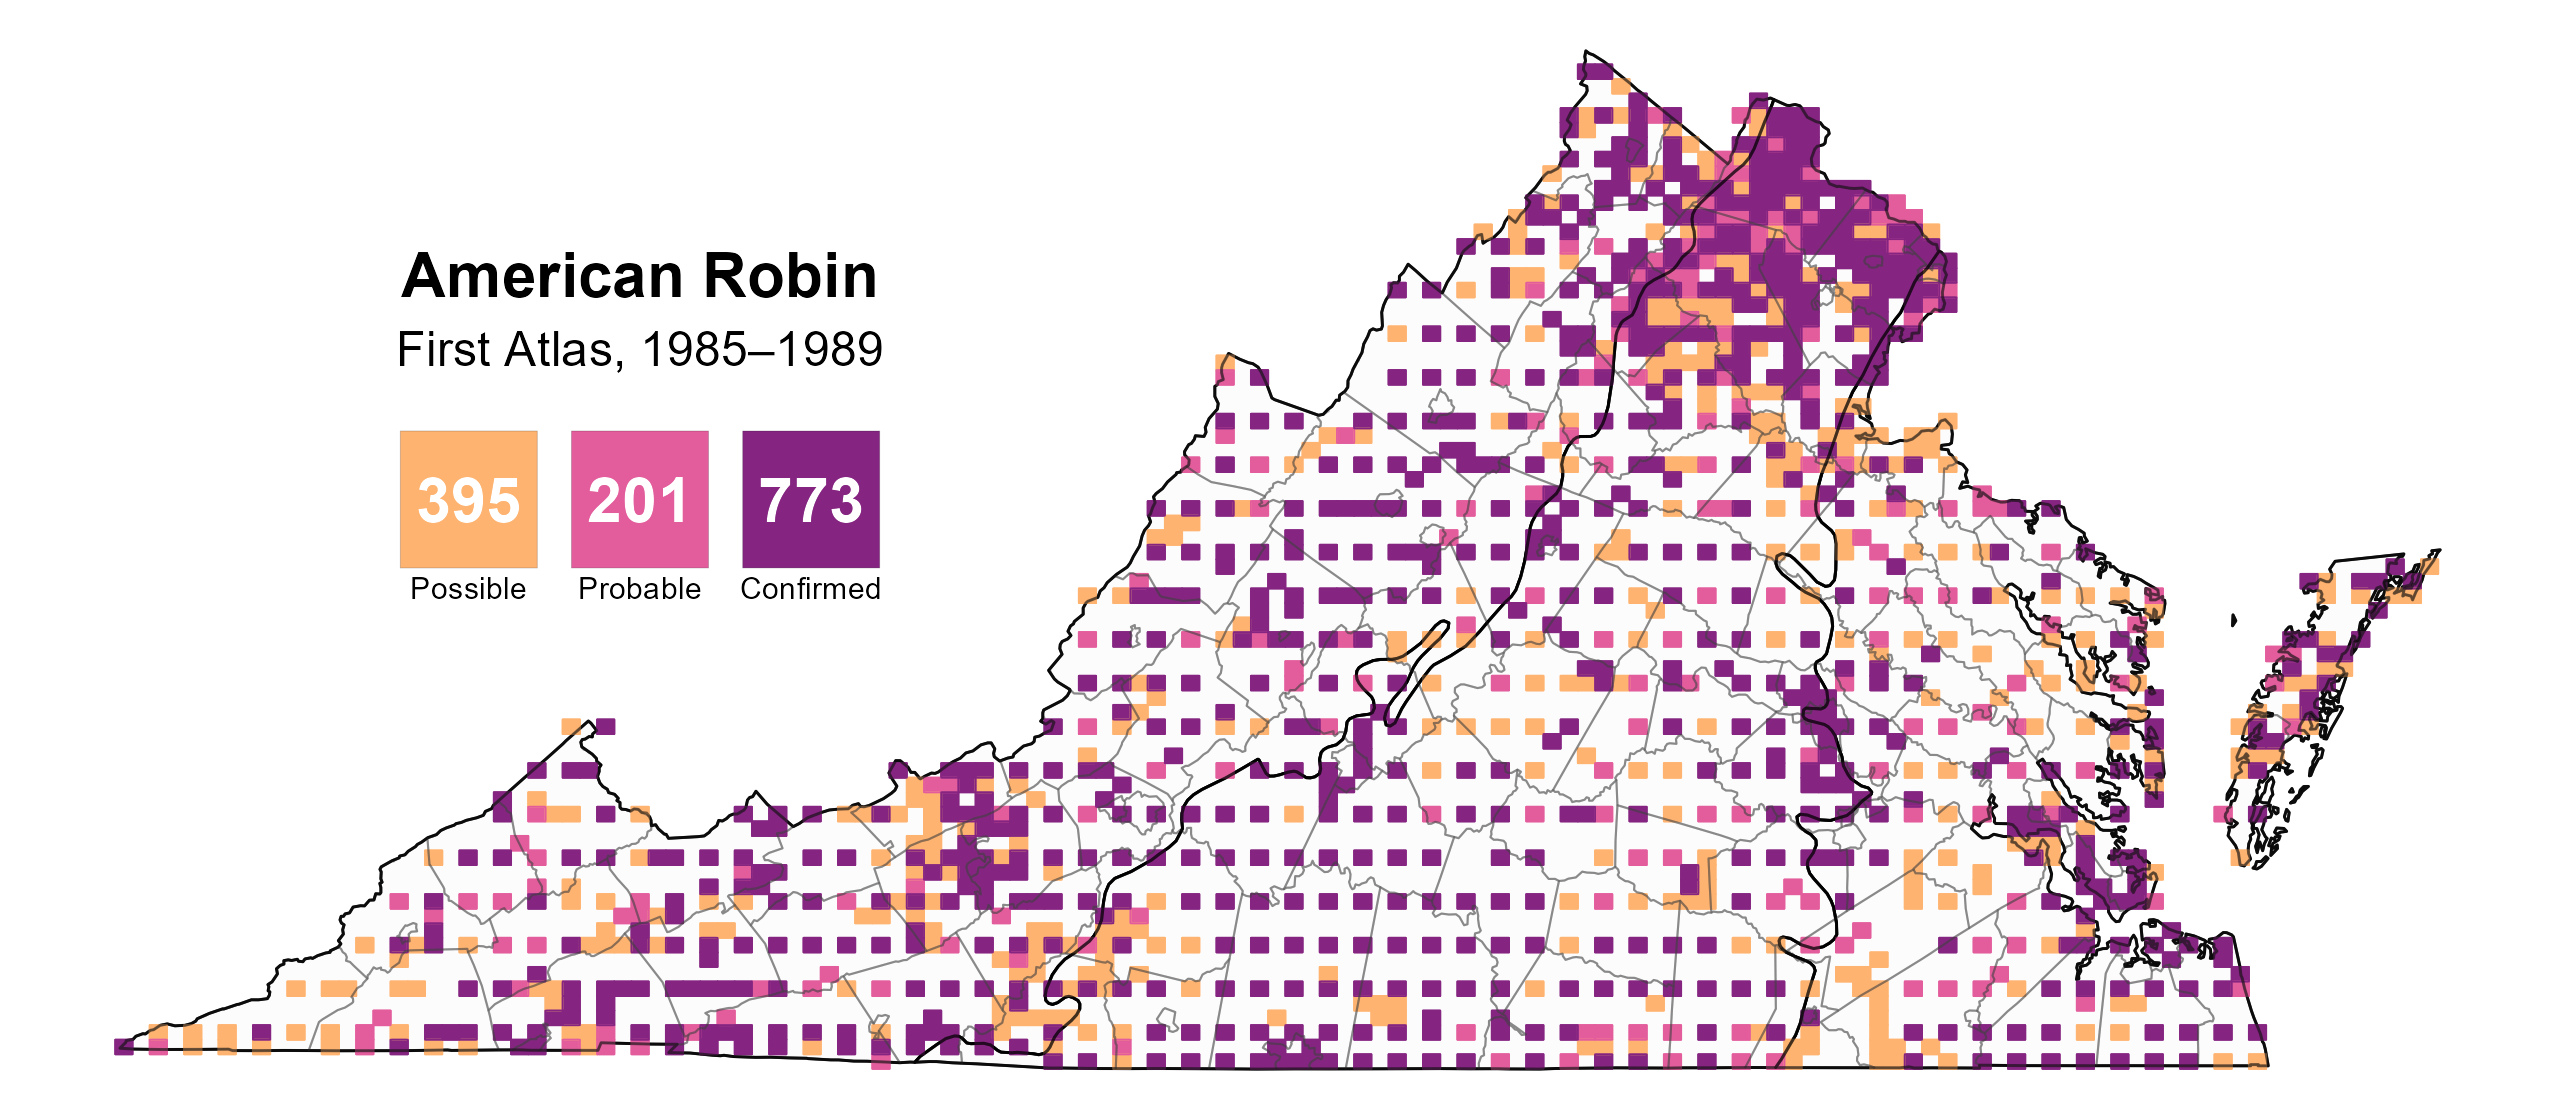
Figure 5: American Robin breeding observations from the First Atlas (1985–1989). The colored boxes illustrate Atlas blocks (approximately 10 mi2 [26 km2] survey units) where the species was detected. The colors show the highest breeding category recorded in a block. The numbers within the colors in the legend correspond to the number of blocks with that breeding evidence category.
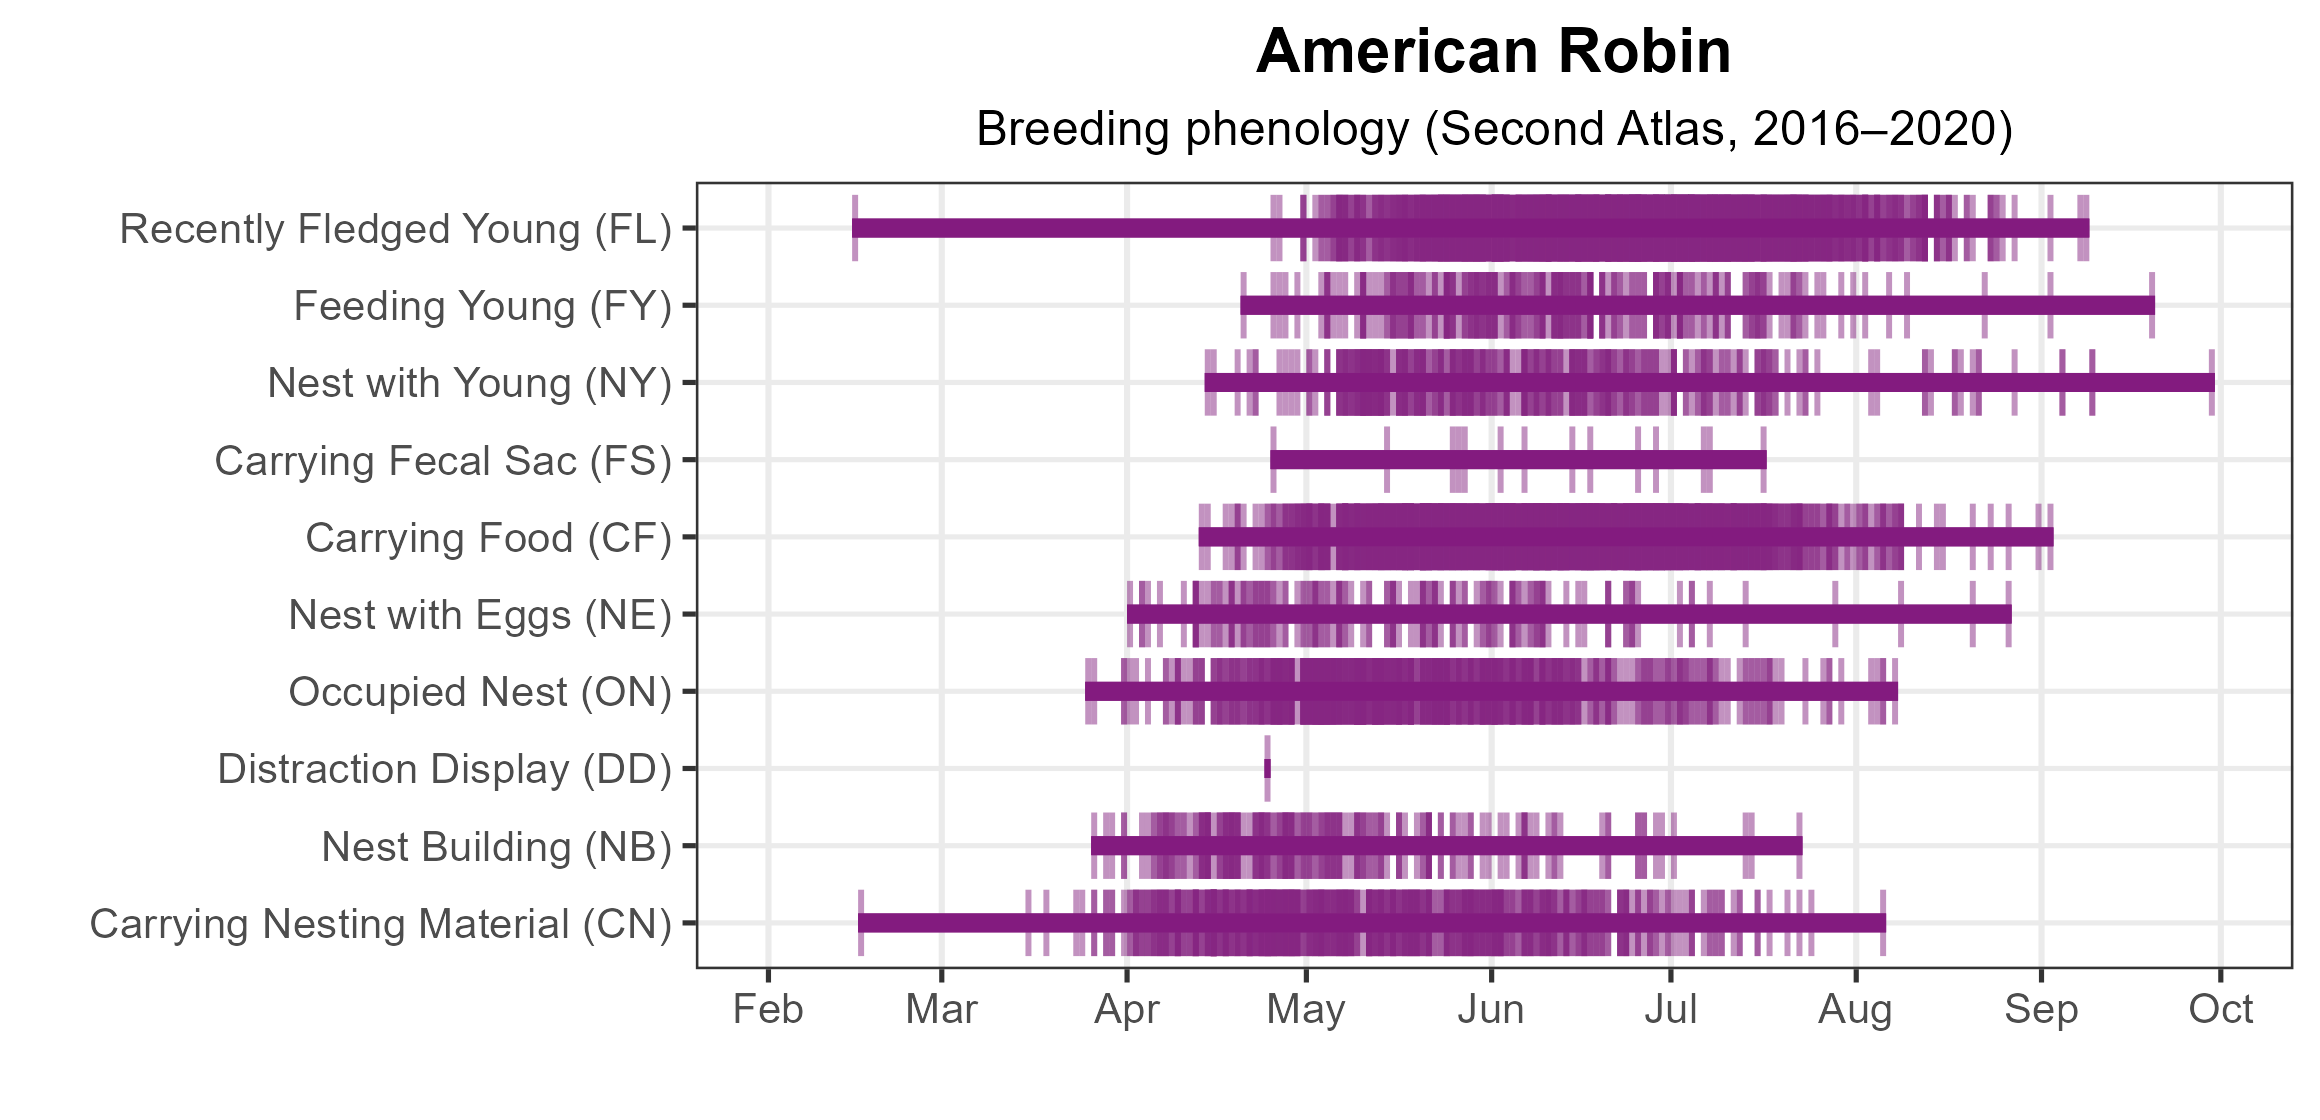
Figure 6: American Robin phenology: confirmed breeding codes. This graph shows a timeline of confirmed breeding behaviors. Tick marks represent individual observations of the behavior.
Population Status
American Robin relative abundance was estimated to be highest within the Mountains and Valleys region, the northern and central Piedmont region, and sporadically in the southern Coastal Plain (Figure 7).
The total estimated American Robin population in the state is approximately 1,576,000 detectable individuals (with a range between 1,392,000 and 1,788,000), making it the eighth most abundant bird in the state (among those species for which abundance could be modeled). Based on the North American Breeding Bird Survey (BBS), the American Robin population declined by a nonsignificant 0.32% annually from 1966–2022 in Virginia; between Atlas periods, American Robins decreased by a significant rate of 0.61% per year from 1987–2018 (Hostetler et al. 2023; Figure 8).
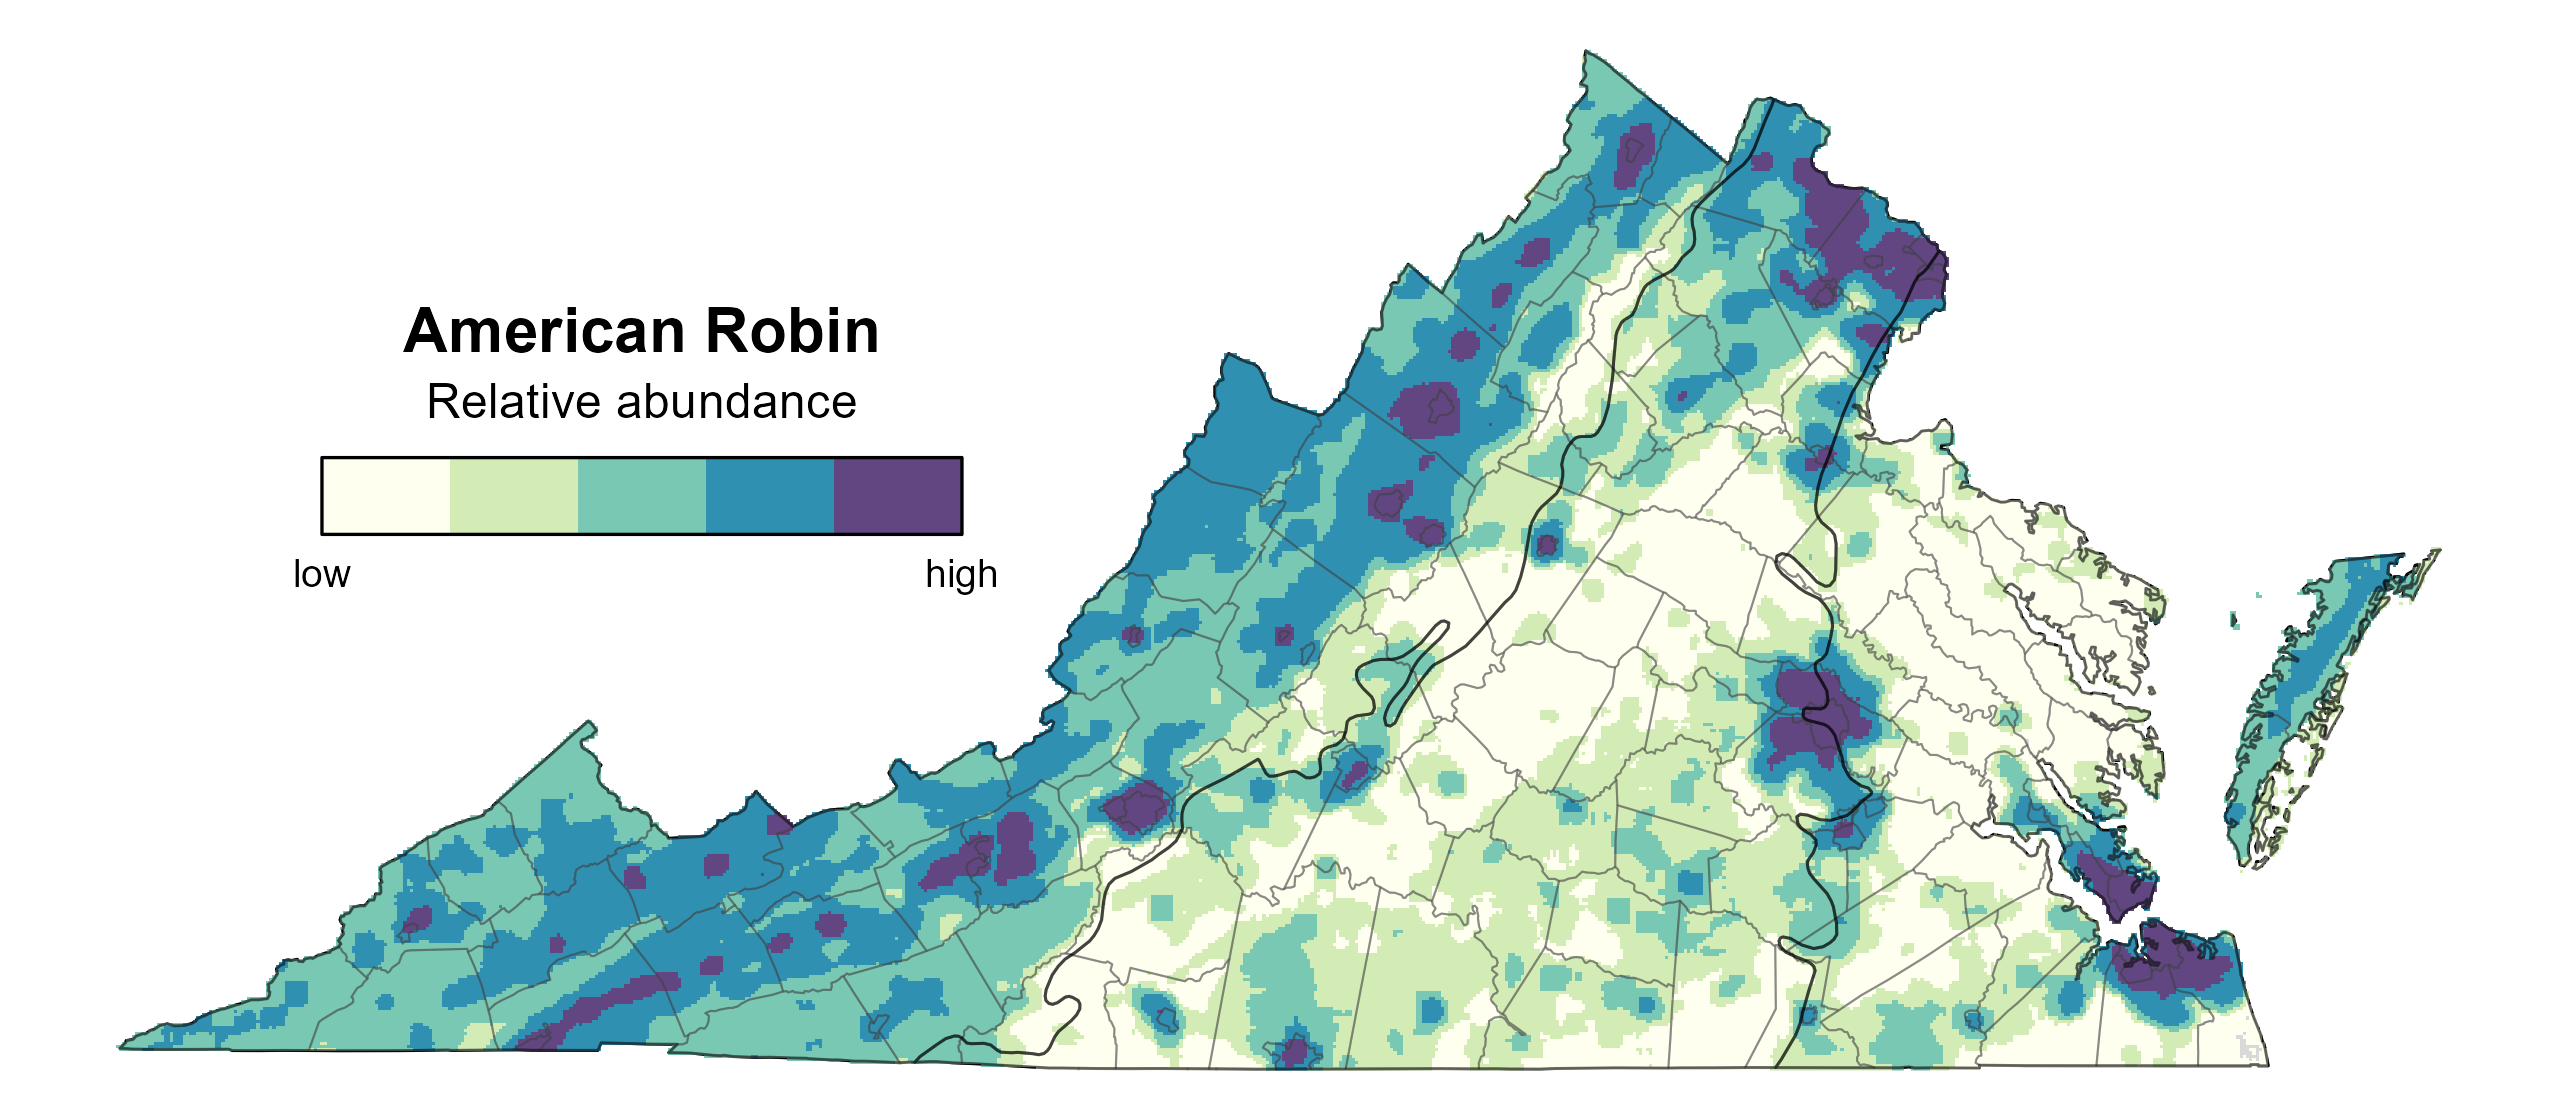
Figure 7: American Robin relative abundance (Second Atlas, 2016–2020). This map indicates the predicted abundance of this species at a 0.4 mi2 (1 km2) scale based on environmental (including habitat) factors. Abundance values are presented on a relative scale of low to high.
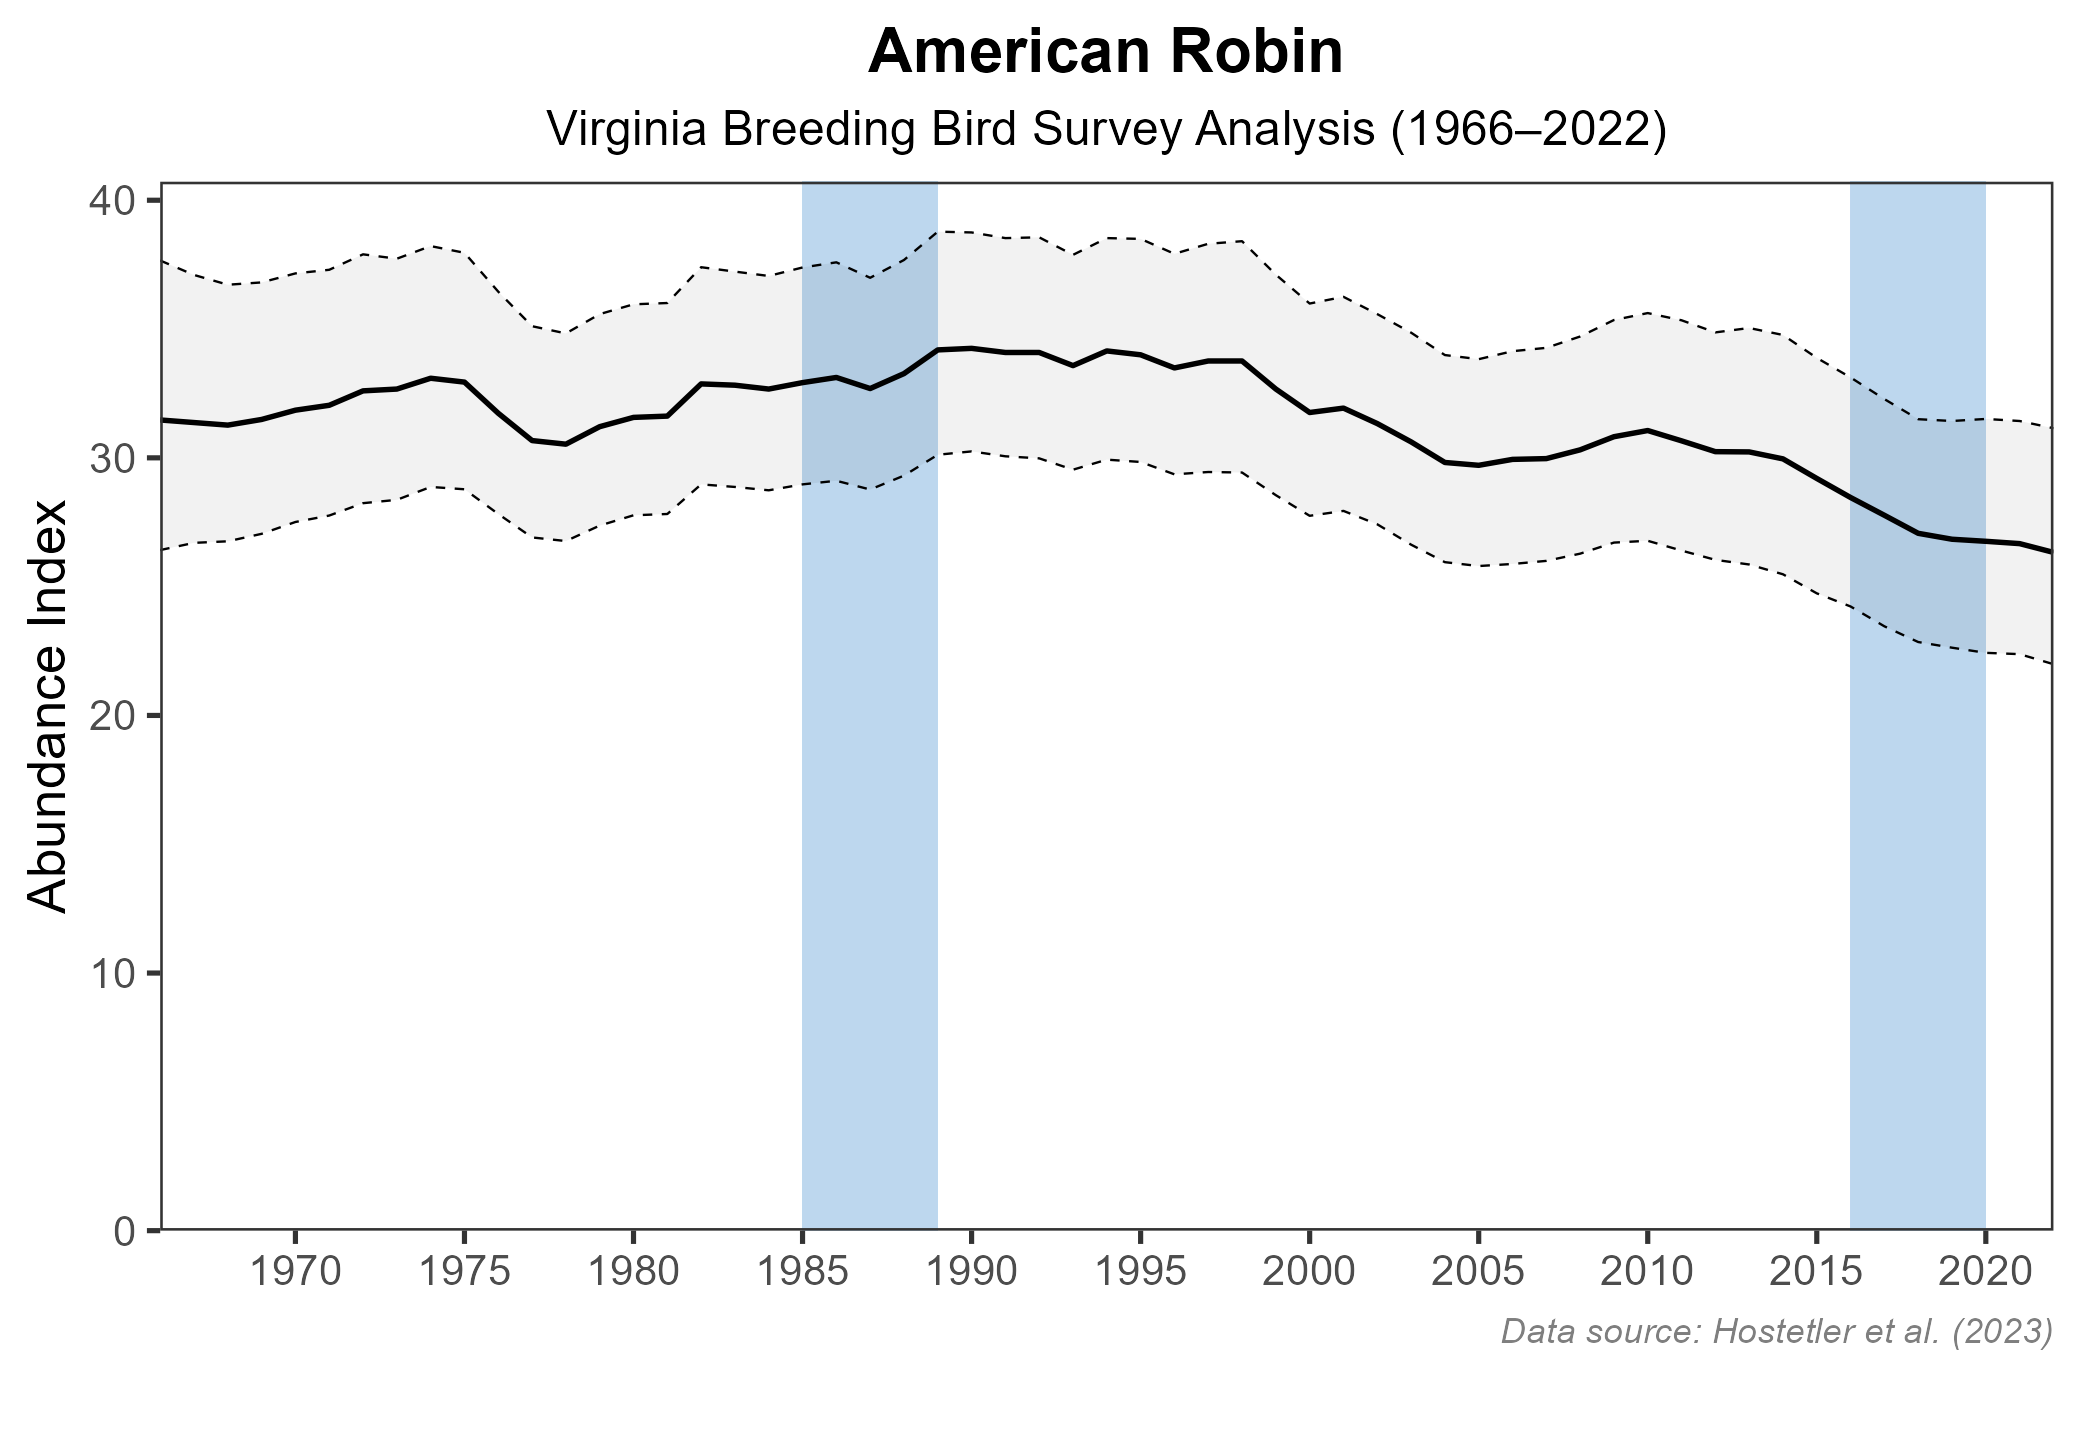
Figure 8: American Robin population trend for Virginia as estimated by the North American Breeding Bird Survey. The vertical axis shows species abundance; the horizontal axis shows the year. The solid line indicates the estimated population trend; there is a 97.5% probability that the true population trendfalls between the dashed lines. The shaded bars indicate the First and Second Atlas periods.
Conservation
Americans Robins remain common and widespread in Virginia. They are not considered a species of special concern, and no species-specific conservation projects are underway in Virginia.
Interactive Map
The interactive map contains up to six Atlas layers (probability of occurrence for the First and Second Atlases, change in probability of occurrence between Atlases, breeding evidence for the First and Second Atlases, and abundance for the Second Atlas) that can be viewed one at a time. To view an Atlas map layer, mouse over the layer box in the upper left. County lines and physiographic regional boundaries (Mountains and Valleys, Piedmont, and Coastal Plain) can be turned on and off by checking or unchecking the box below the layer box. Within the map window, users can hover on a block to see its value for each layer and pan and zoom to see roads, towns, and other features of interest that are visible beneath a selected layer.
View Interactive Map in Full Screen
References
Hostetler, J. A., J. R. Sauer, J. E. Hines, D. Ziolkowski, and M. Lutmerding (2023). The North American breeding bird survey, analysis results 1966 – 2022. U.S. Geological Survey, Laurel, MD, USA. https://doi.org/10.5066/P9SC7T11.
Vanderhoff, N., P. Pyle, M. A. Patten, R. Sallabanks, and F. C. James (2020). American Robin (Turdus migratorius), version 1.0. In Birds of the World (P. G. Rodewald, Editor). Cornell Lab of Ornithology, Ithaca, NY, USA. https://doi.org/10.2173/bow.amerob.01.