Introduction
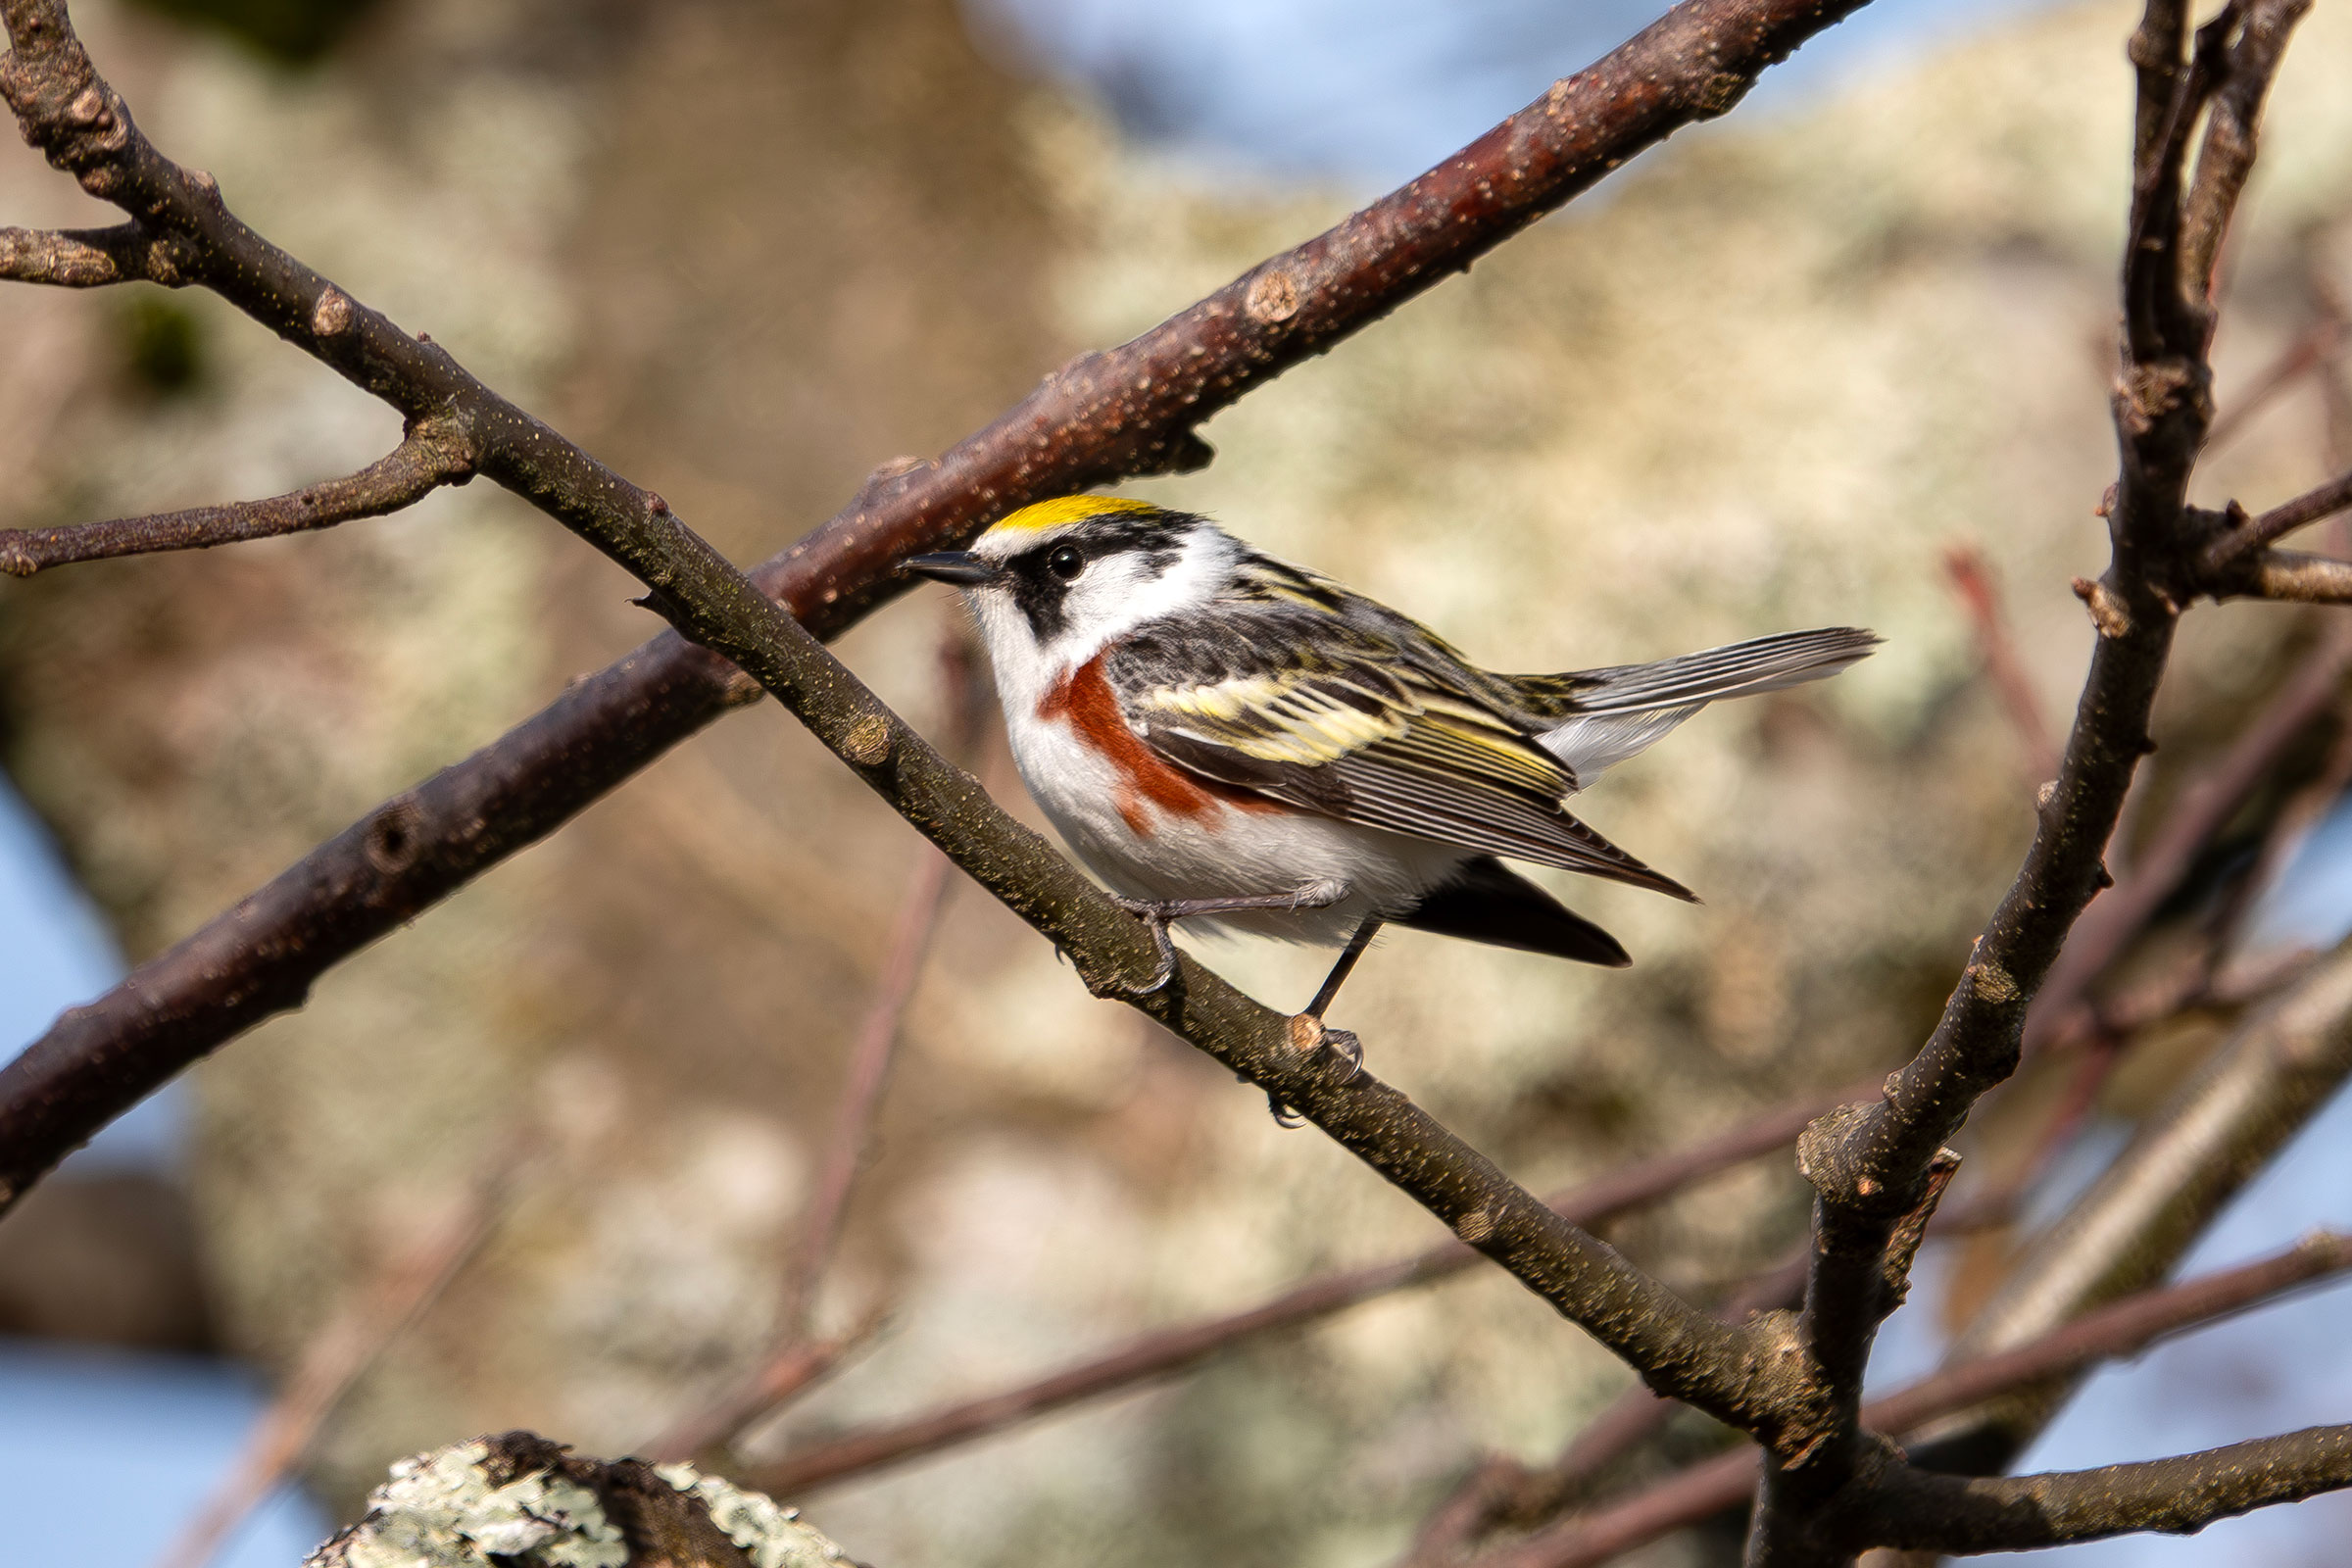
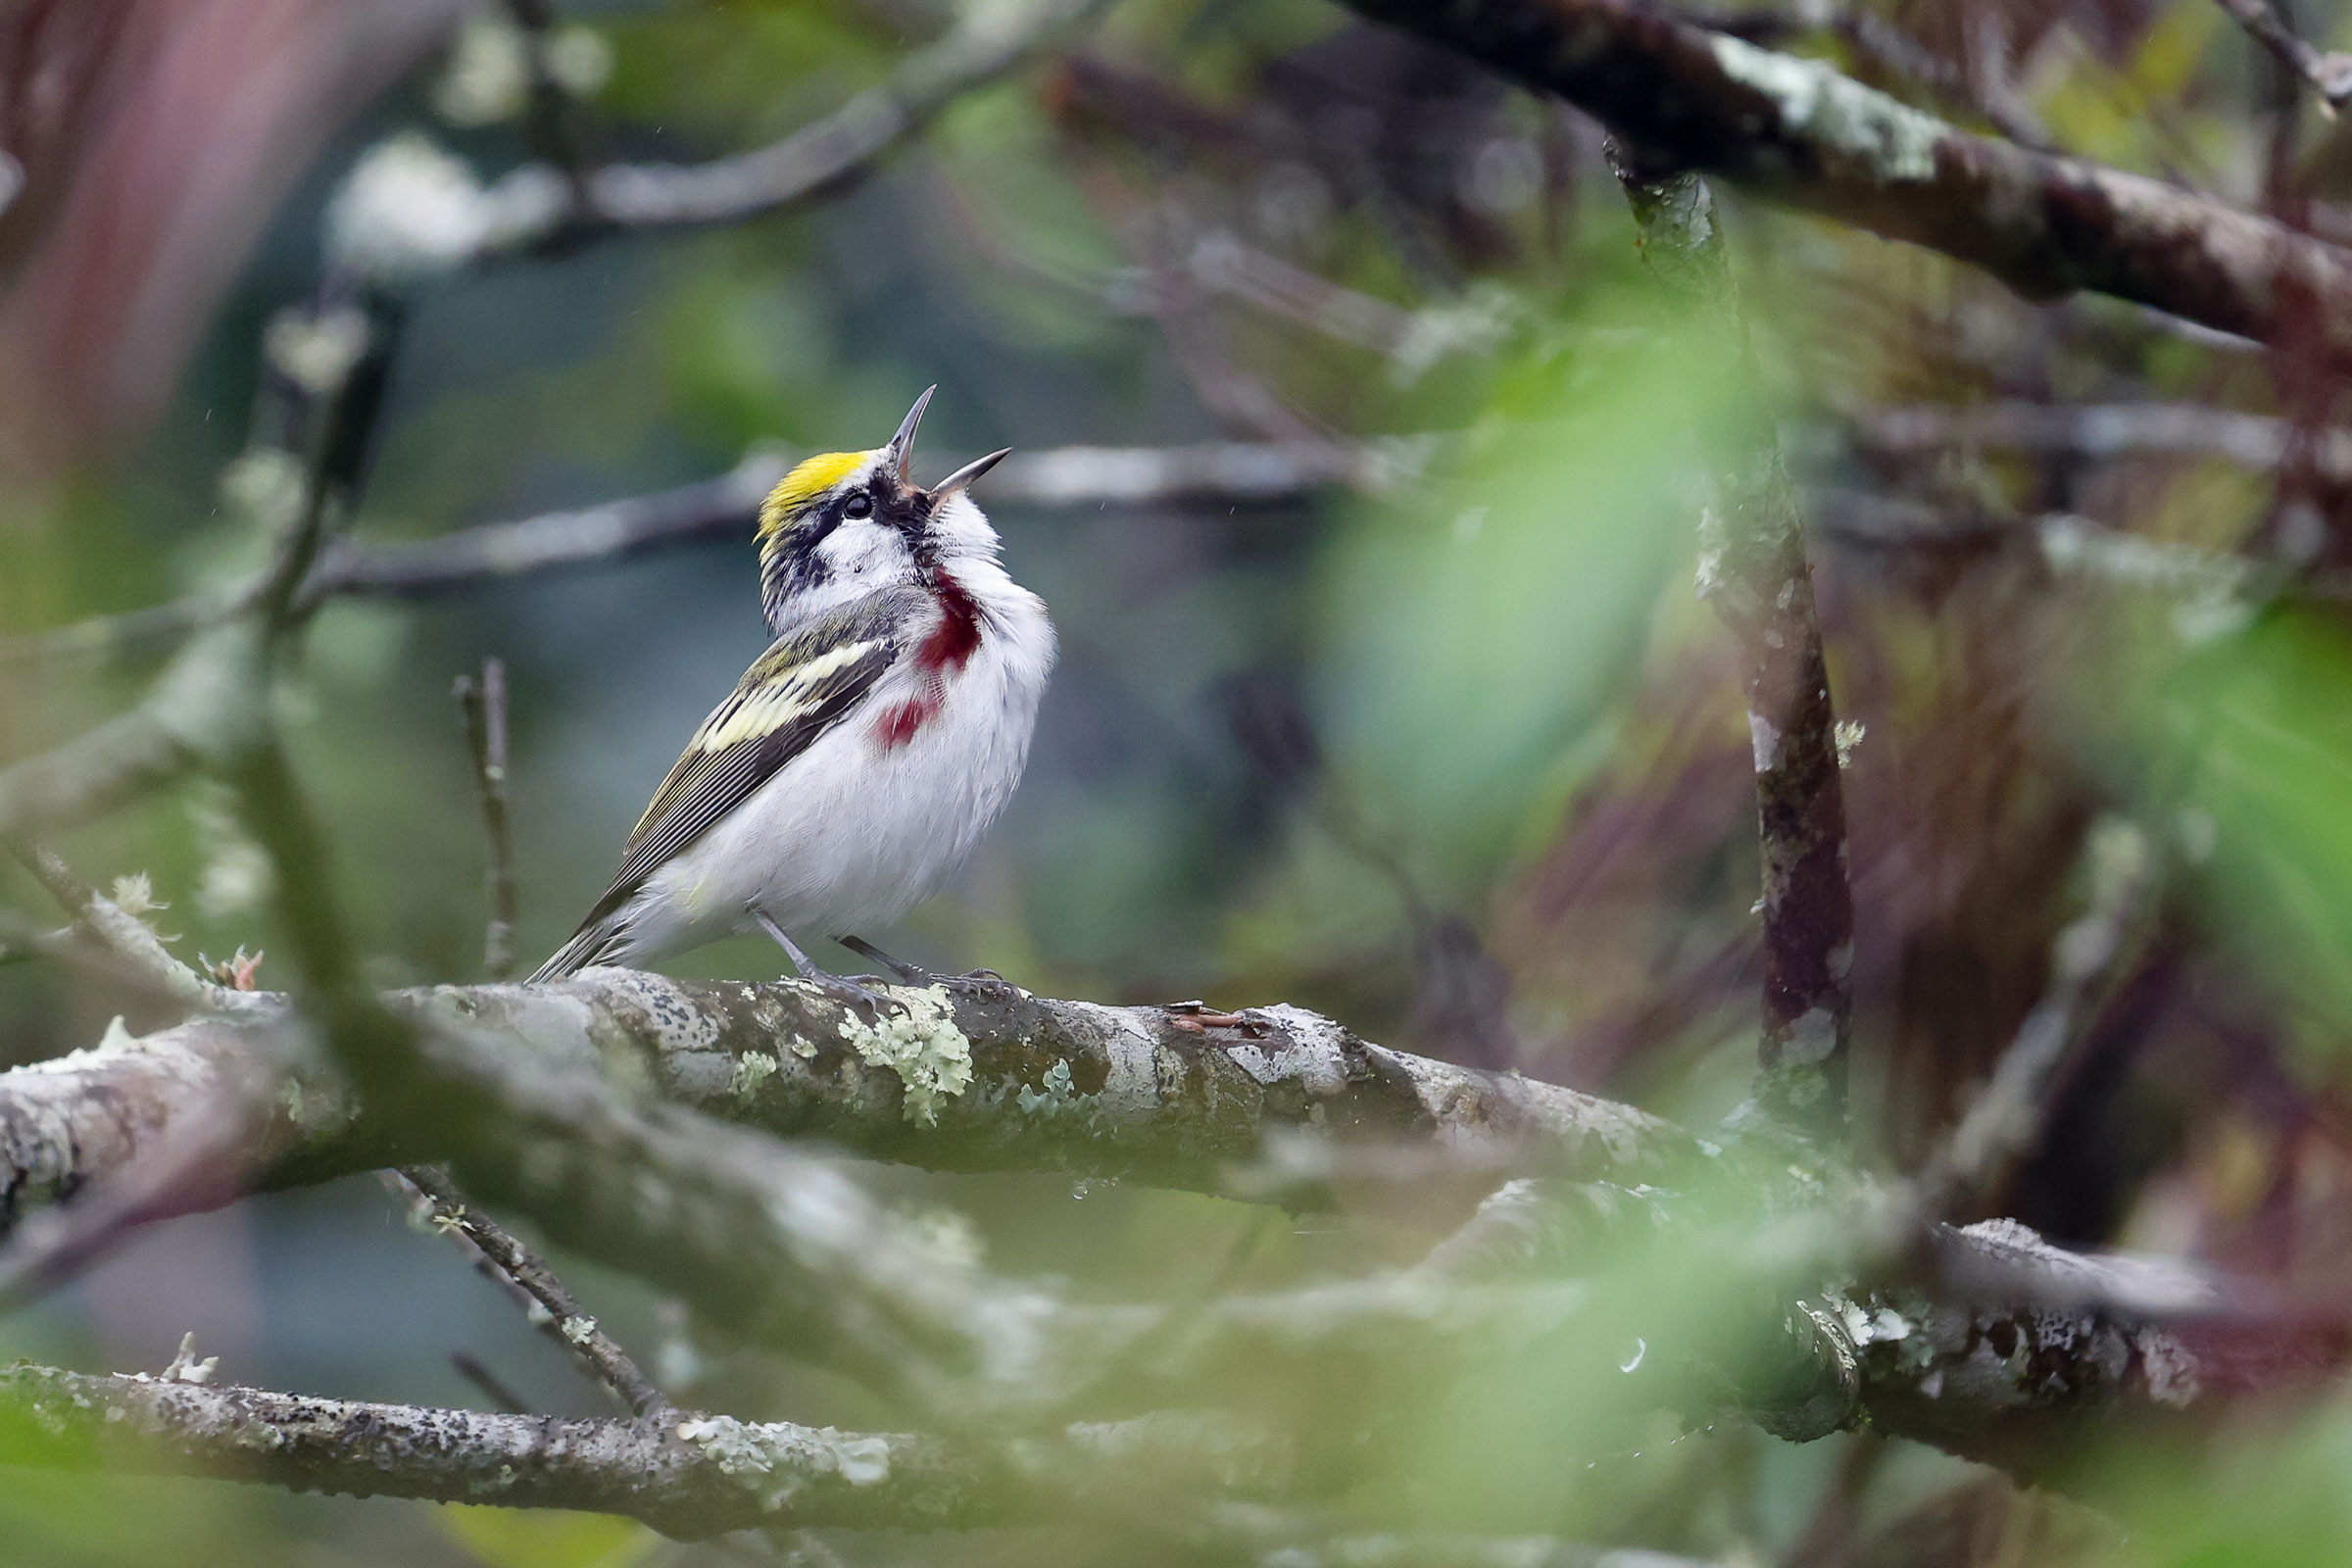
With its exuberant, pleased, pleased, pleased to meetcha!, the Chestnut-sided Warbler has a distinct song. The bulk of the Chestnut-sided Warbler’s breeding range is north and west of Virginia, extending into southern Canada and the upper Great Lakes. However, there is a narrow extension of the range that follows the Appalachian Mountains south into western Virginia as well as into West Virginia, Kentucky, North Carolina, and Tennessee. Throughout their range, Chestnut-sided Warblers are considered “disturbance species,” capitalizing on the young forest conditions created by storms, timber harvests, and fires (Byers et al. 2020).
Breeding Distribution
Chestnut-sided Warblers are found only in the Mountains and Valleys region. Within most of this region, this species is absent or slightly likely to occur, except for isolated areas where it is moderately to highly likely to occur in young forest habitat (Figure 1). These areas include the mountainous areas bordering West Virginia and the Blue Ridge Mountains and sections of Augusta, Bath, Giles, Grayson, Highland, Madison, Nelson, Page, Rockingham, Tazewell, and Smyth Counties.
Chestnut-sided Warbler likelihood of occurrence increases with the proportion of edge habitat in a block as well as with elevation. Their occurrence is also slightly positively associated with the amount of forest cover in a block.
Between the First and Second Atlases (Figures 1 and 2), the Chestnut-sided Warbler’s likelihood of occurrence remained generally constant throughout most of the Mountains and Valleys region but decreased in the southwestern portion of the region (Figure 3).
View Environmental Associations
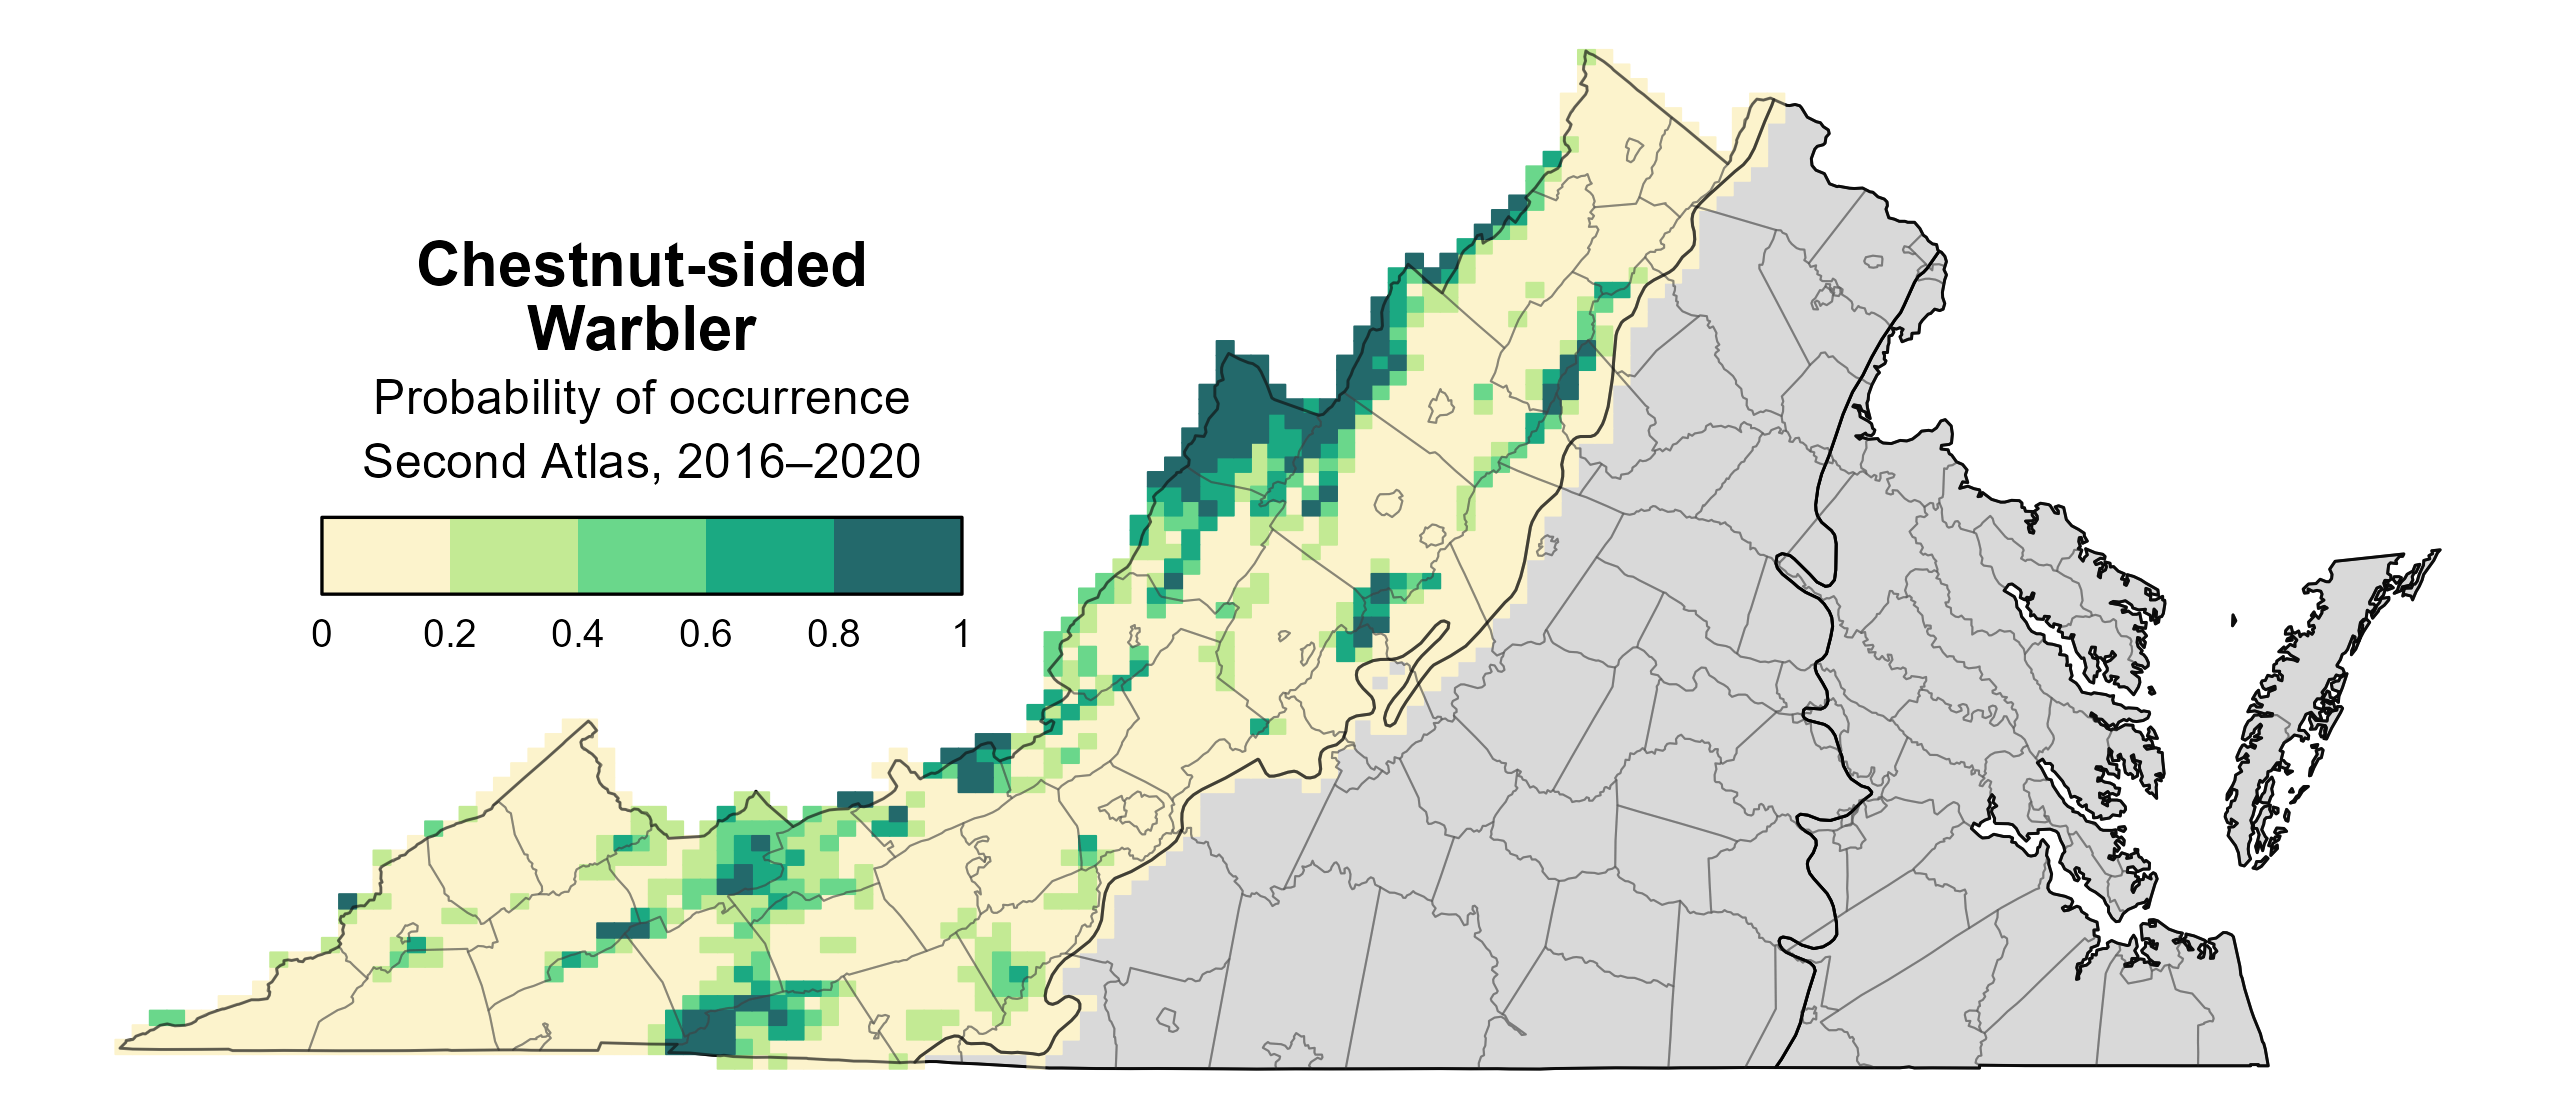
Figure 1: Chestnut-sided Warbler breeding distribution based on probability of occurrence (Second Atlas, 2016–2020). This map indicates the probability that this species will occur in an Atlas block (an approximately 10 mi2 [26 km2] survey unit) based on environmental (including habitat) factors and after adjusting for the probability of detection (variation in survey effort among blocks). Blocks in gray lie outside the species' core range and were note modeled.

Figure 2: Chestnut-sided Warbler breeding distribution based on probability of occurrence (First Atlas, 1985–1989). This map indicates the probability that this species will occur in an Atlas block (an approximately 10 mi2 [26 km2] survey unit) based on environmental (including habitat) factors and after adjusting for the probability of detection (variation in survey effort among blocks). Blocks in white were not surveyed during the First Atlas and were not modeled. Blocks in gray are outside the species’ core range and were not modeled.
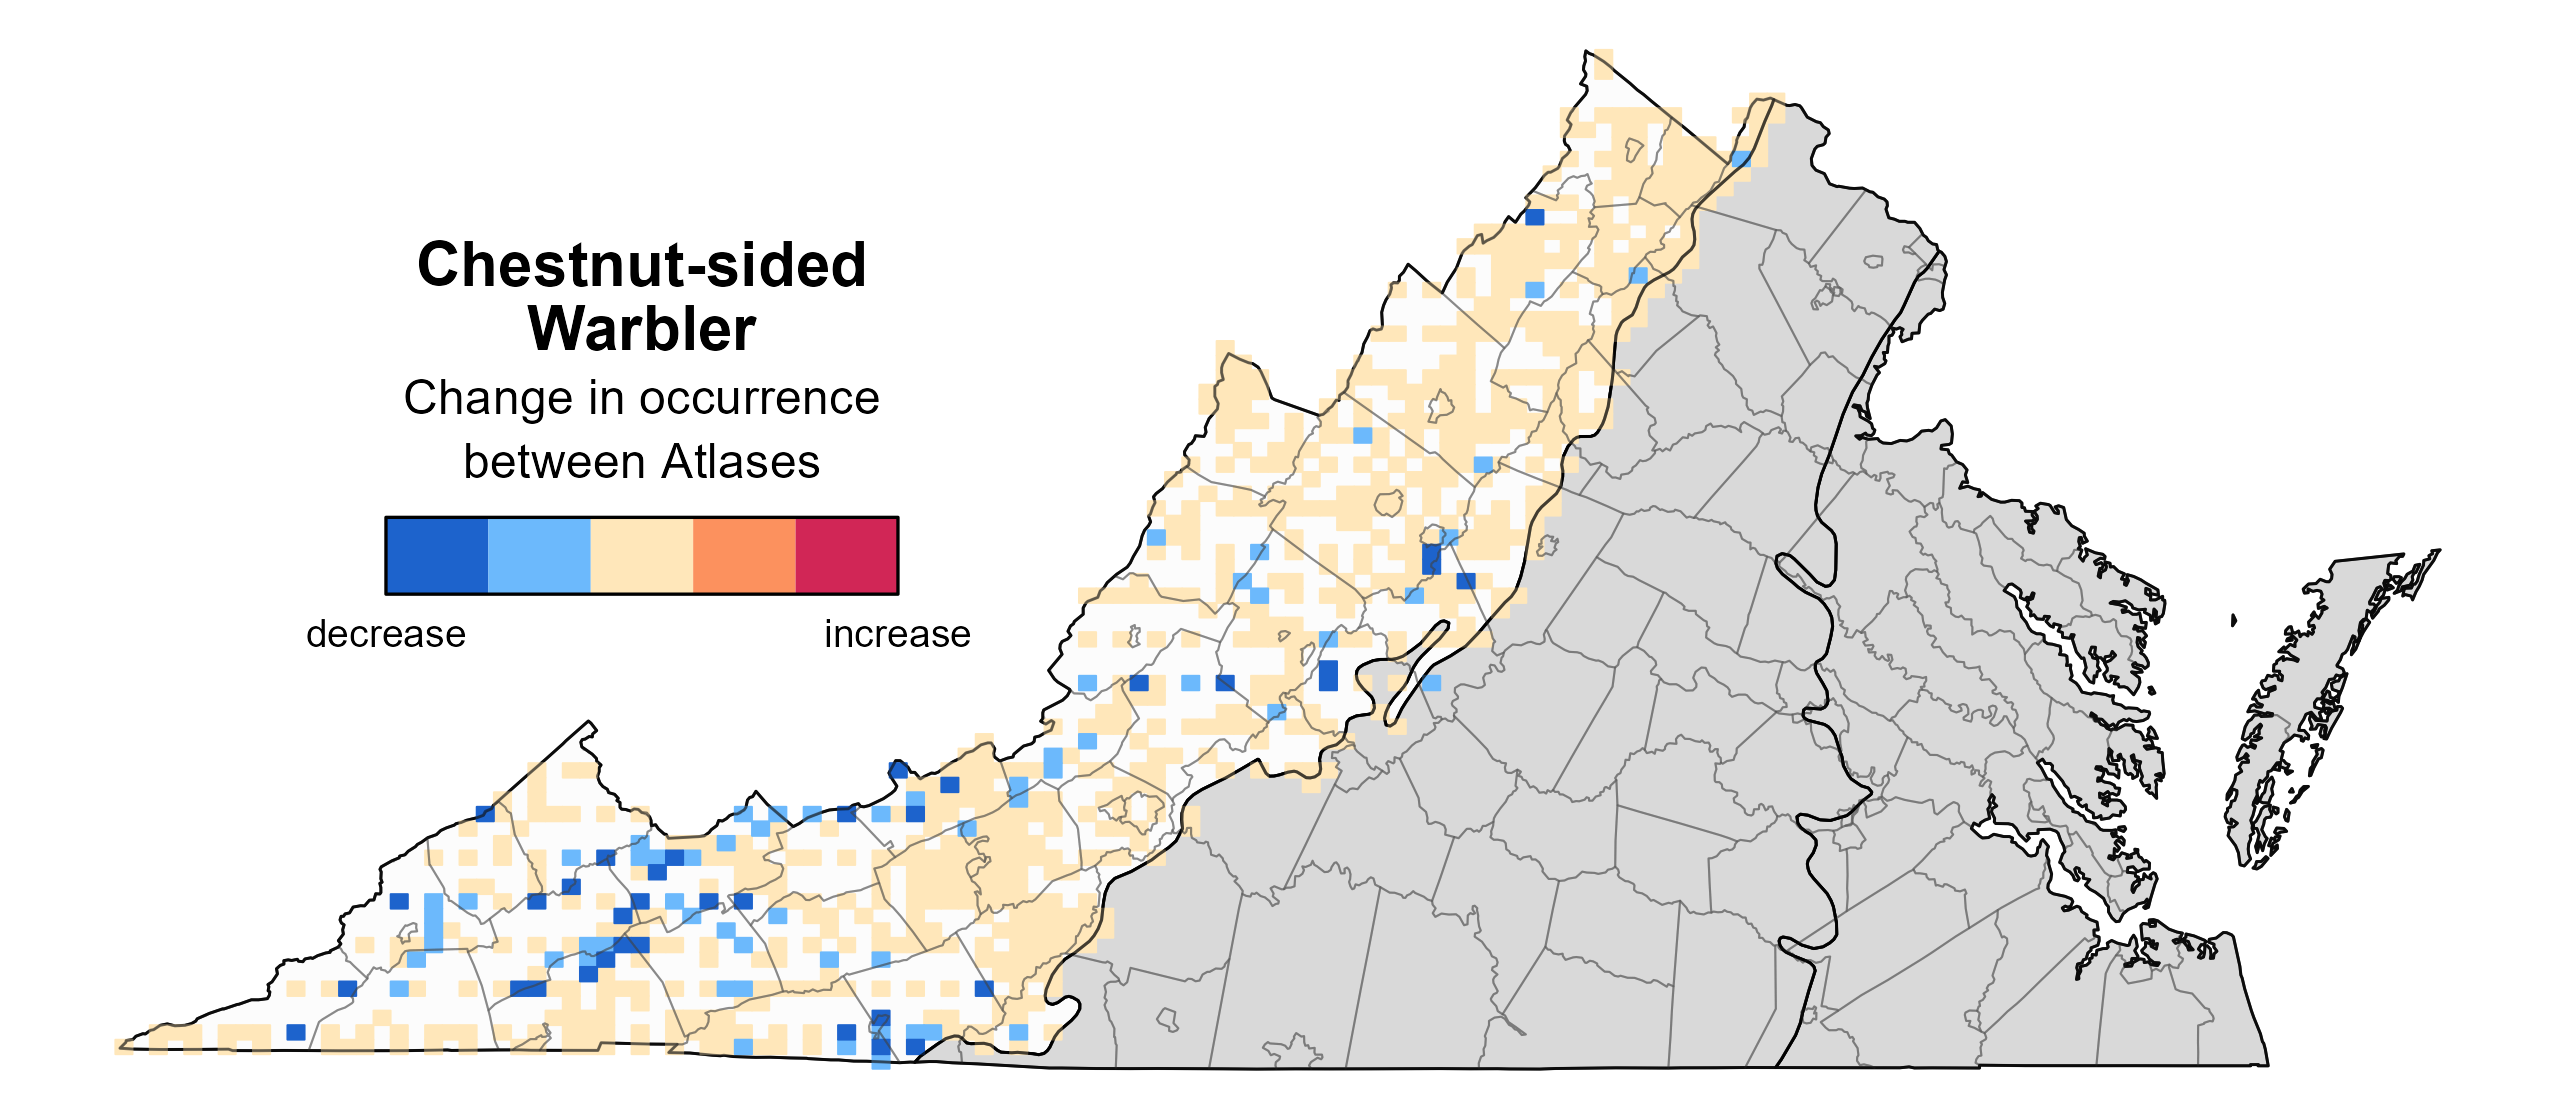
Figure 3: Chestnut-sided Warbler change in breeding distribution between Atlases (1985–1989 and 2016–2020) based on probability of occurrence. This map indicates the change in the probability that this species will occur in a block (an approximately 10 mi2 [26 km2] survey unit) between Atlas periods. Blocks with no change (tan) may have constant presence or constant absence. Blocks in white were not surveyed during the First Atlas and were not modeled. Blocks in gray are outside the species’ core range and were not modeled.
Breeding Evidence
Chestnut-sided Warblers were confirmed breeders in 50 blocks and 20 counties and found to be probable breeders in six additional counties (Figure 4). Breeding observations generally were recorded in similar areas during both Atlas periods (Figures 4 and 5).
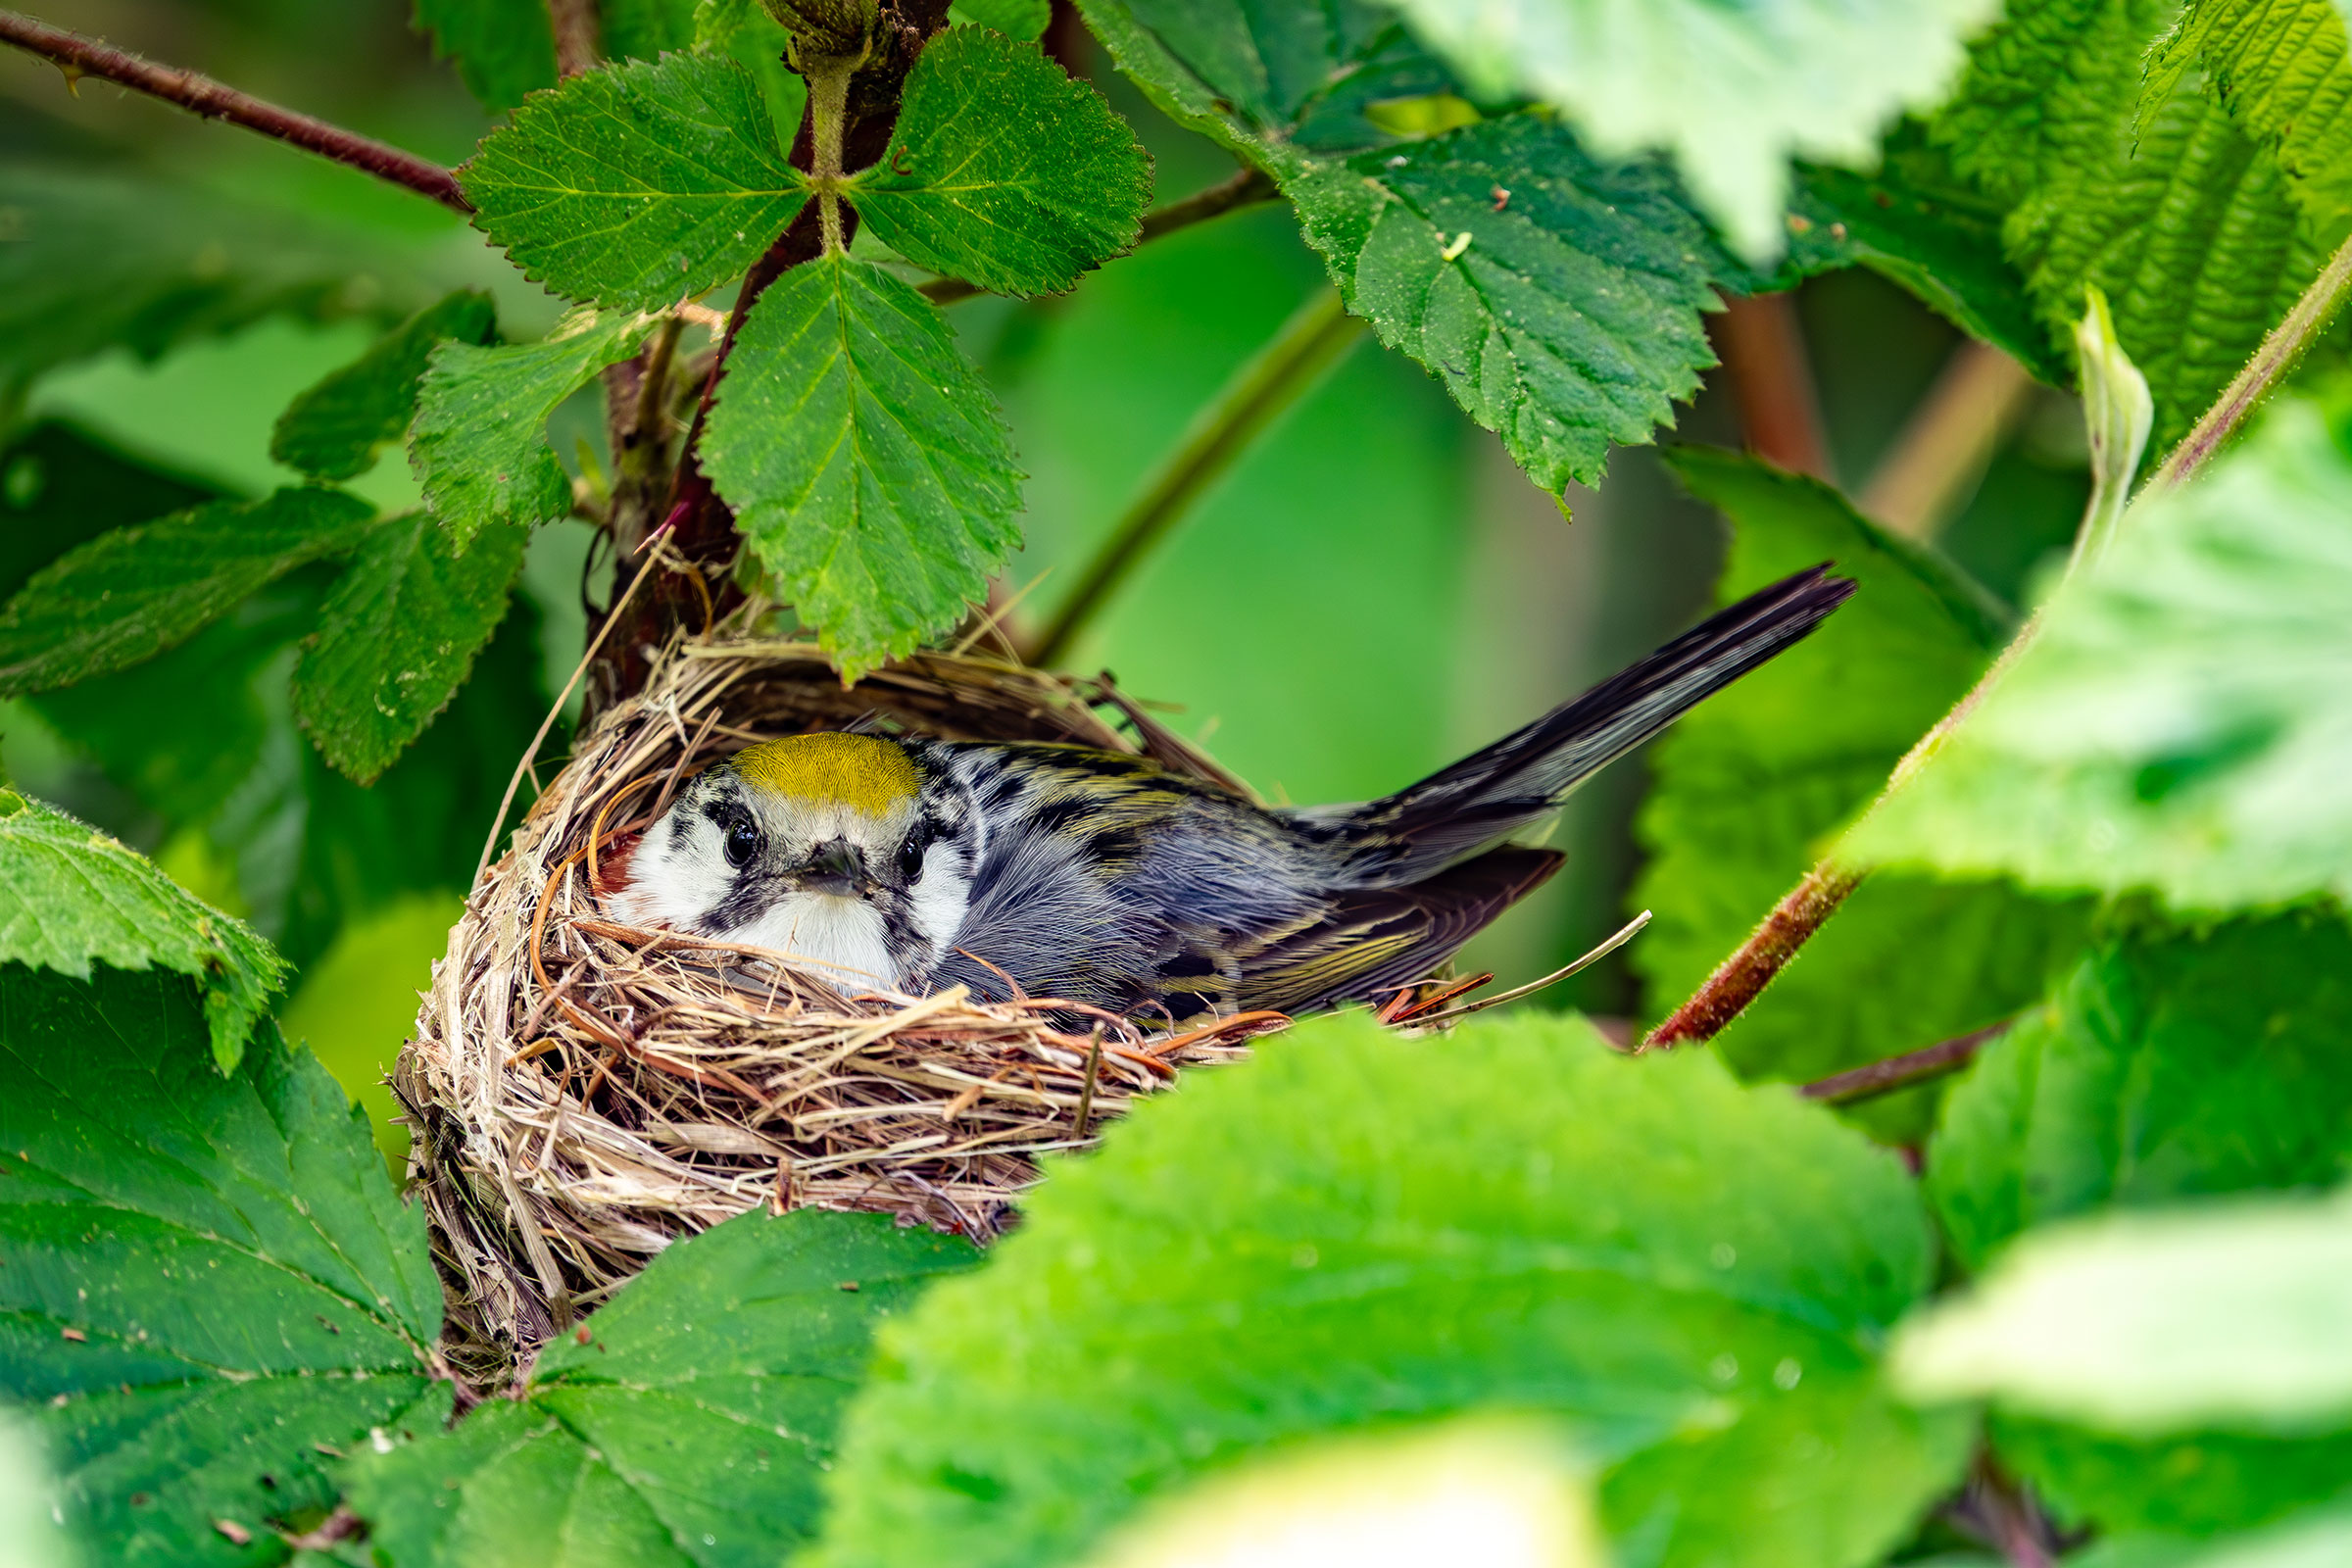
The earliest confirmed breeding behavior was confirmed on May 11 when adults were observed nest building. Adults were last observed carrying food on August 2. In addition to carrying food, breeding was confirmed primarily through observations of recently fledged young (Jun 22 – July 29) and adults feeding young (June 17 – July 20) (Figure 6).
For more general information on the breeding habits of this species, please refer to All About Birds.
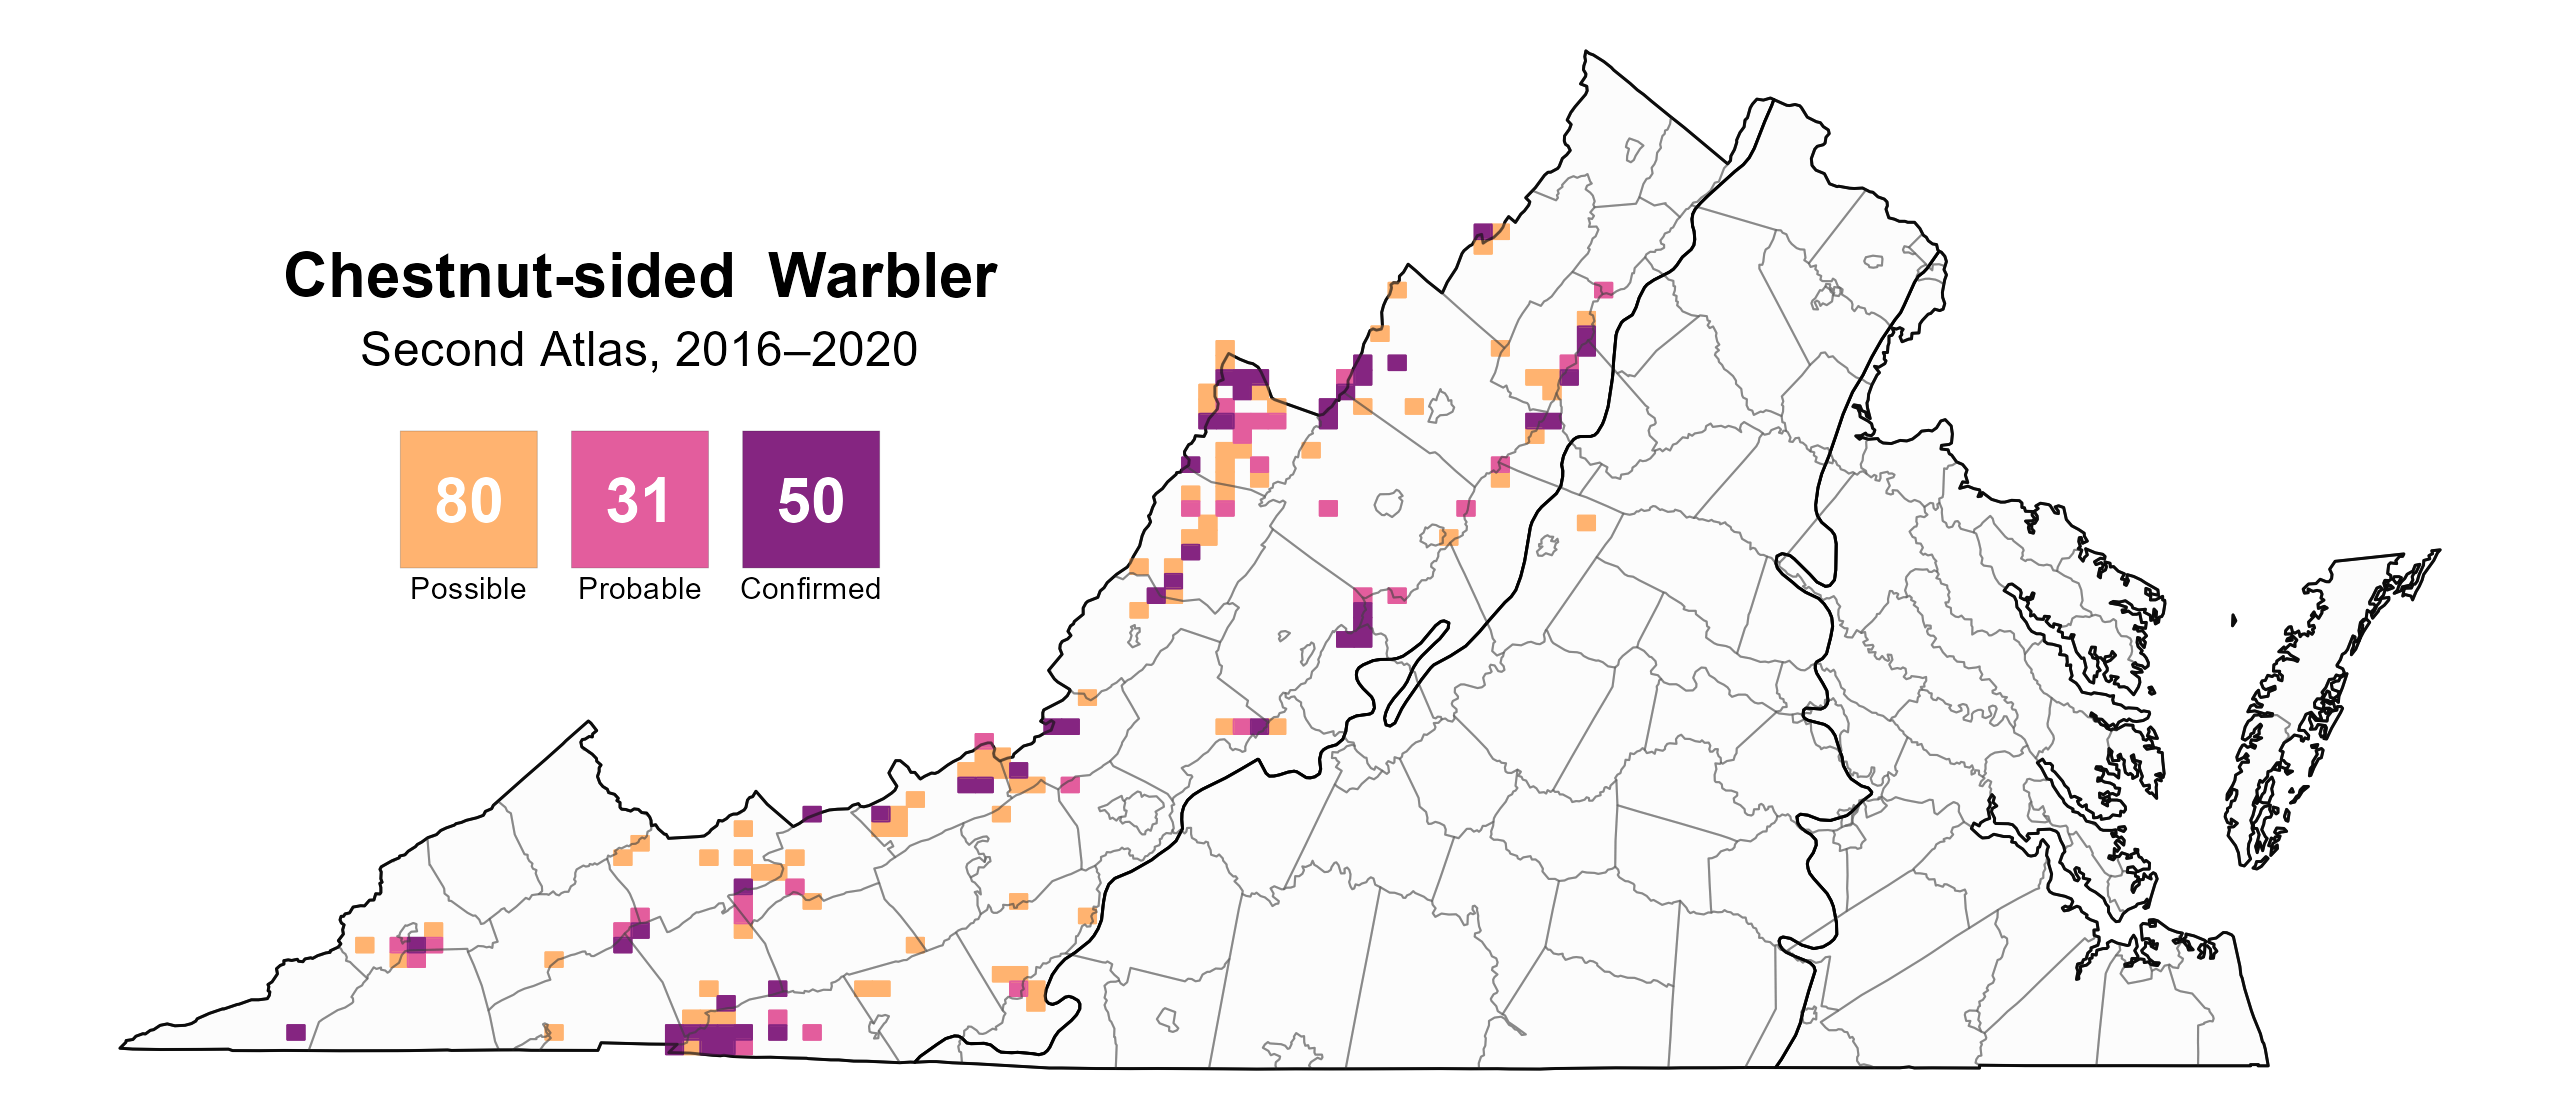
Figure 4: Chestnut-sided Warbler breeding observations from the Second Atlas (2016–2020). The colored boxes illustrate Atlas blocks (approximately 10 mi2 [26 km2] survey units) where the species was detected. The colors show the highest breeding category recorded in a block. The numbers within the colors in the legend correspond to the number of blocks with that breeding evidence category.

Figure 5: Chestnut-sided Warbler breeding observations from the First Atlas (1985–1989). The colored boxes illustrate Atlas blocks (approximately 10 mi2 [26 km2] survey units) where the species was detected. The colors show the highest breeding category recorded in a block. The numbers within the colors in the legend correspond to the number of blocks with that breeding evidence category.
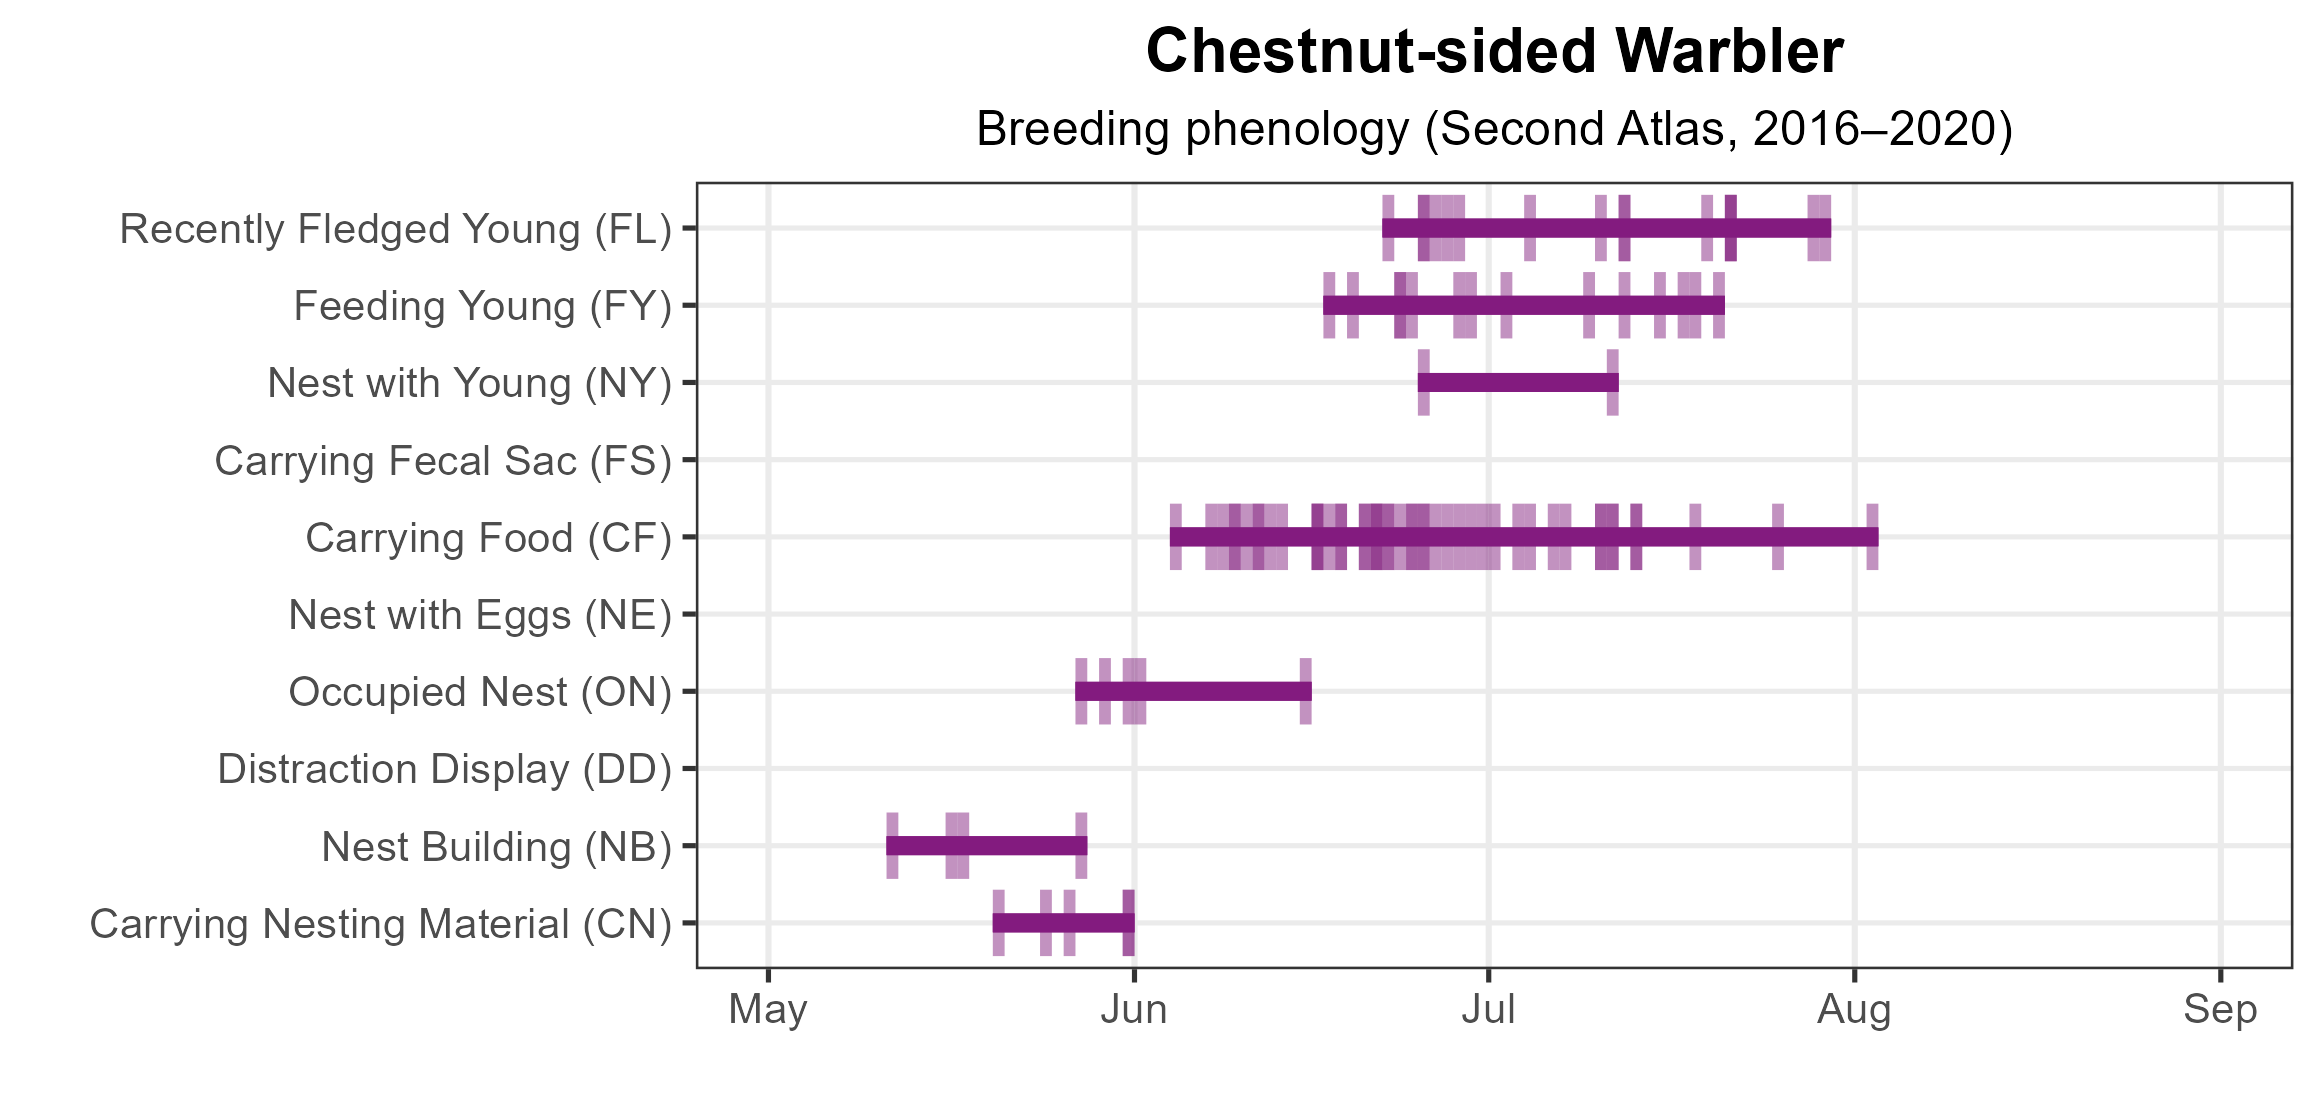
Figure 6: Chestnut-sided Warbler phenology: confirmed breeding codes. This graph shows a timeline of confirmed breeding behaviors. Tick marks represent individual observations of the behavior.
Population Status
Chestnut-sided Warbler relative abundance was estimated to be highest in the counties bordering West Virginia in the central portion of the region (Figure 7). The Blue Ridge Mountains, however, were less important in driving abundance estimates than they were in influencing distribution.
The total estimated Chestnut-sided Warbler population in the state is approximately 38,000 individuals (with a range between 15,000 and 104,000). Based on the North American Breeding Bird Survey (BBS) population trend data for the Appalachian Mountains region (as the Virginia data does not produce a credible trend for the state), the Chestnut-sided Warbler population decreased by a nonsignificant 0.08% annually from 1966–2022 in the region, and between Atlas periods, Chestnut-sided Warblers increased by a nonsignificant 0.42% per year from 1987–2018 (Hostetler et al. 2023; Figure 8).
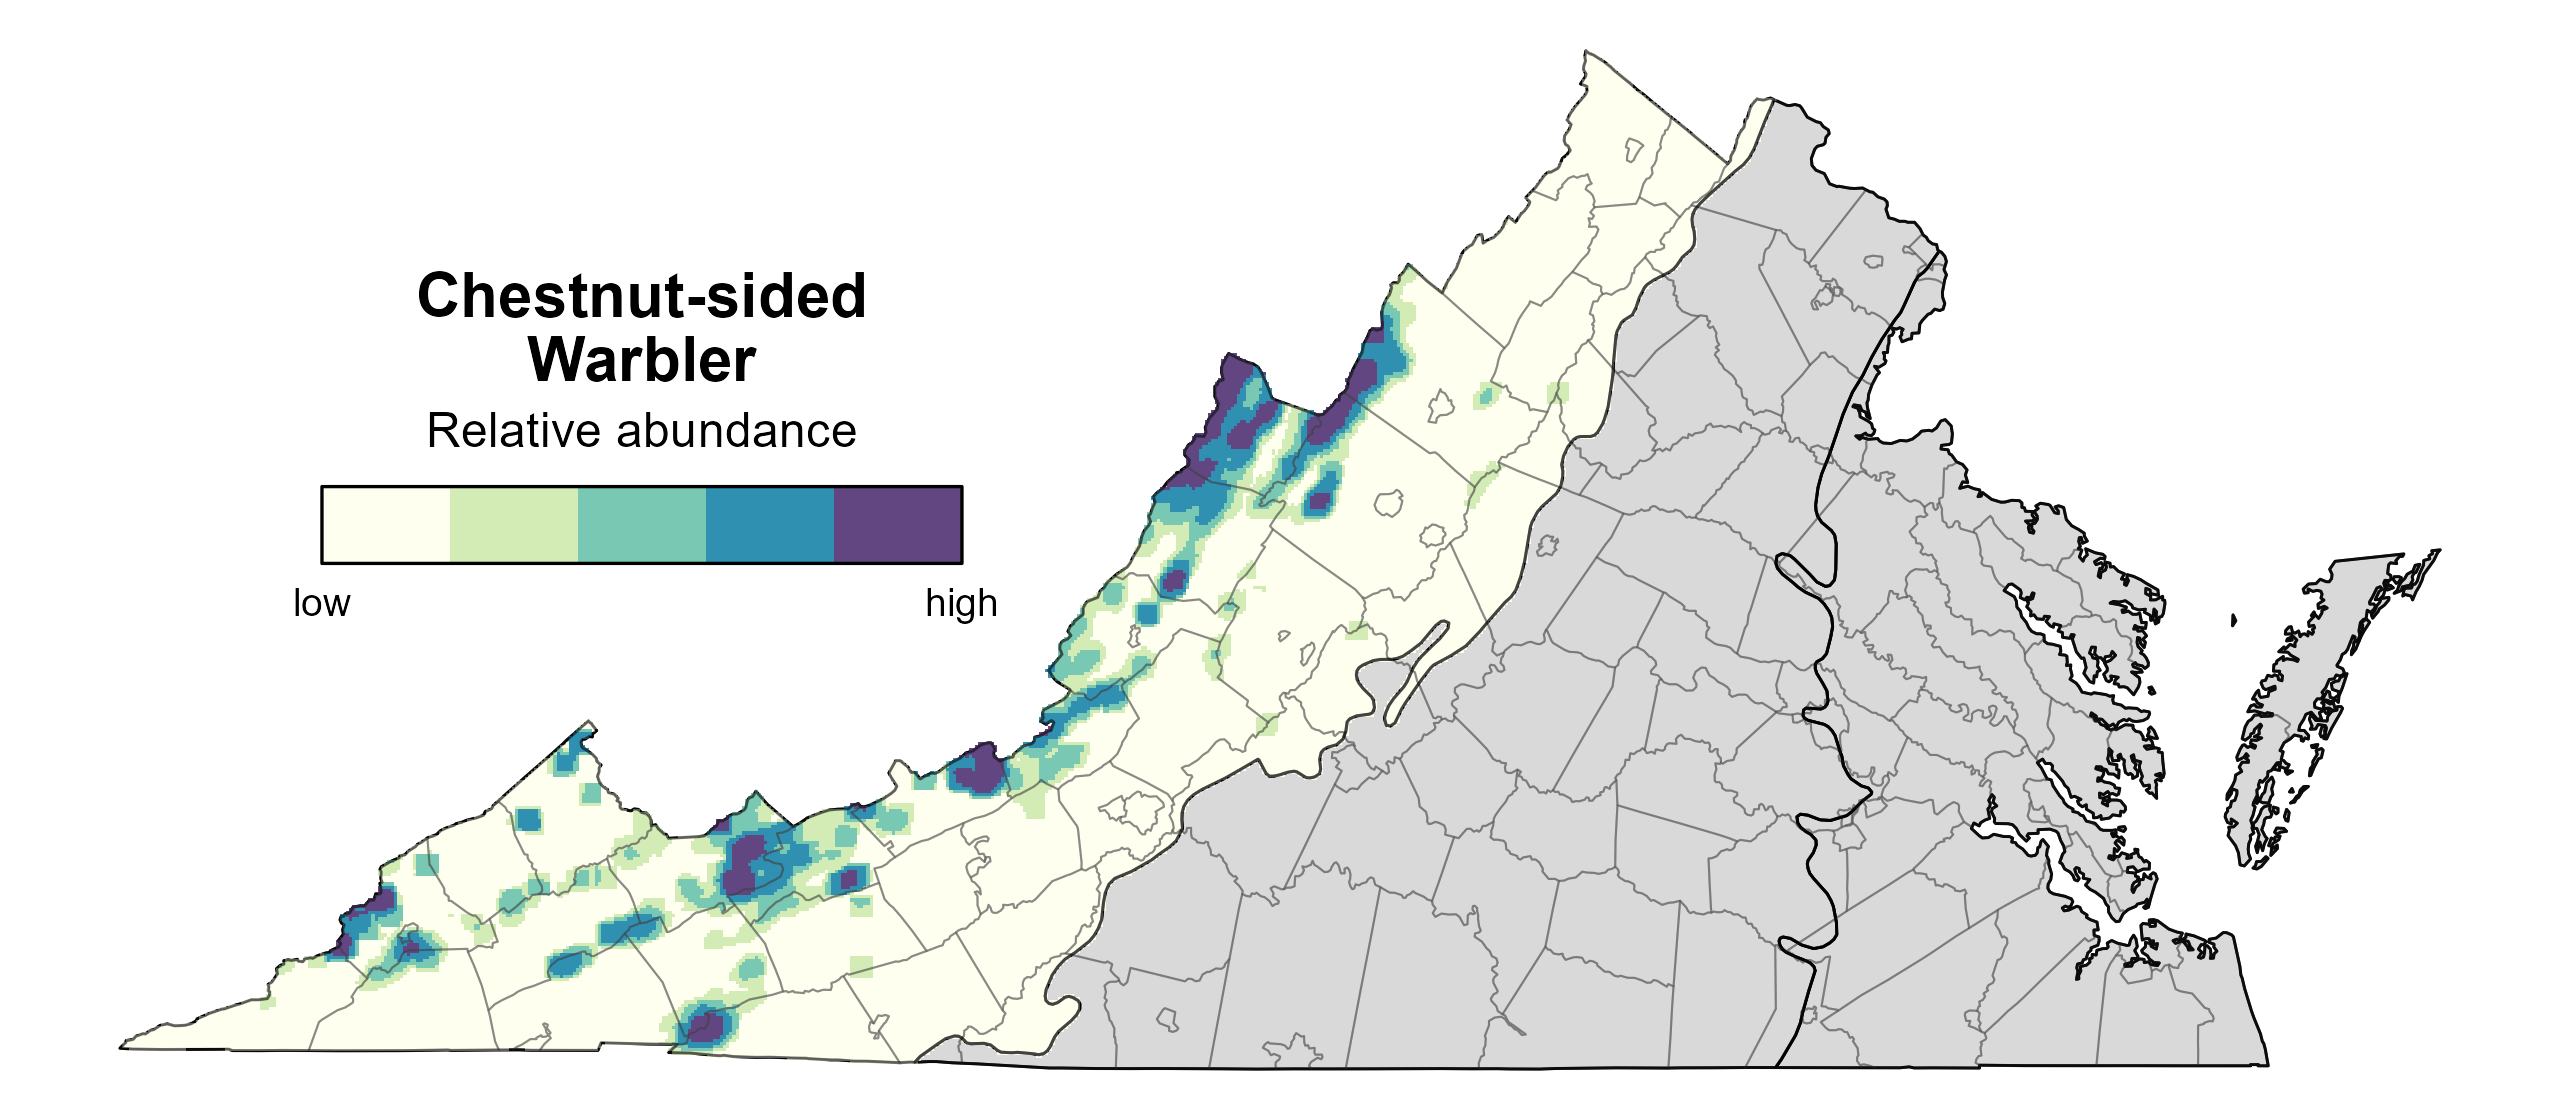
Figure 7: Chestnut-sided Warbler relative abundance (Second Atlas, 2016–2020). This map indicates the predicted abundance of this species at a 0.4 mi2 (1 km2) scale based on environmental (including habitat) factors. Abundance values are presented on a relative scale of low to high. Areas in gray are outside the species’ core range and were not modeled.
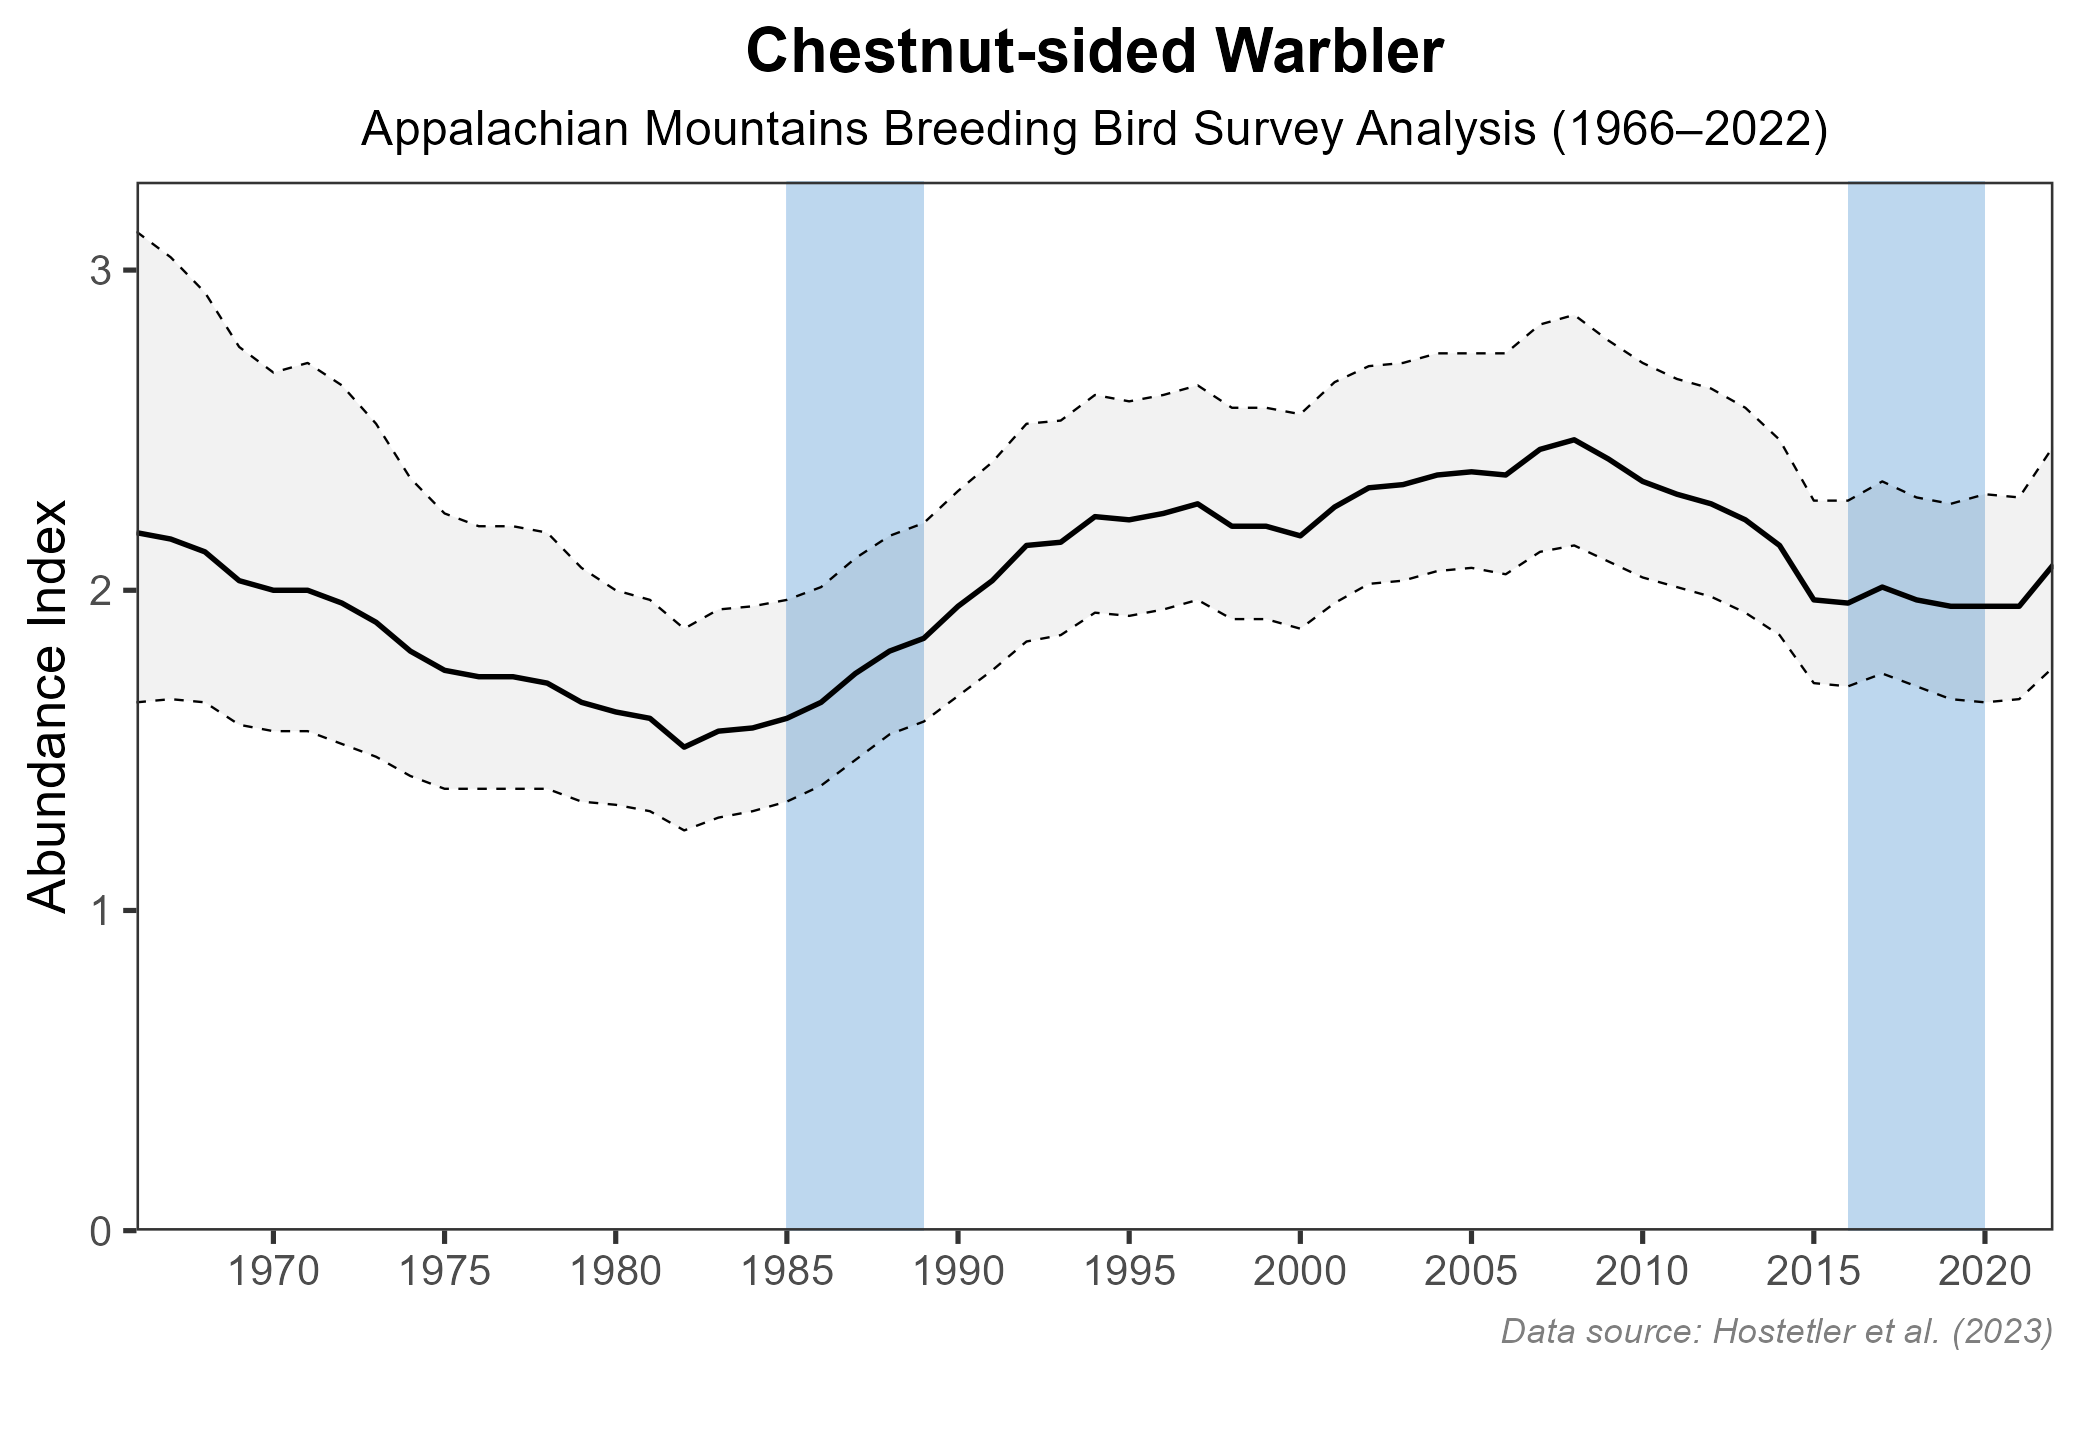
Figure 8: Chestnut-sided Warbler population trend for the Appalachian Mountains as estimated by the North American Breeding Bird Survey. The vertical axis shows species abundance; the horizontal axis shows the year. The solid line indicates the estimated population trend; there is a 97.5% probability that the true population trend falls between the dashed lines. The shaded bars indicate the First and Second Atlas periods.
Conservation
Although relatively less common in Virginia, Chestnut-sided Warblers are common and widespread throughout their range (Byers et al. 2020). Thus, they are not considered a species of special concern, and no specific conservation projects for Chestnut-sided Warblers are underway in Virginia.
Interactive Map
The interactive map contains up to six Atlas layers (probability of occurrence for the First and Second Atlases, change in probability of occurrence between Atlases, breeding evidence for the First and Second Atlases, and abundance for the Second Atlas) that can be viewed one at a time. To view an Atlas map layer, mouse over the layer box in the upper left. County lines and physiographic regional boundaries (Mountains and Valleys, Piedmont, and Coastal Plain) can be turned on and off by checking or unchecking the box below the layer box. Within the map window, users can hover on a block to see its value for each layer and pan and zoom to see roads, towns, and other features of interest that are visible beneath a selected layer.
View Interactive Map in Full Screen
References
Byers, B. E., M. Richardson, and D. W. Brauning (2020). Chestnut-sided Warbler (Setophaga pensylvanica), version 1.0. In Birds of the World (A. F. Poole, Editor). Cornell Lab of Ornithology, Ithaca, NY, USA. https://doi.org/10.2173/bow.chswar.01.
Hostetler, J. A., J. R. Sauer, J. E. Hines, D. Ziolkowski, and M. Lutmerding (2023). The North American breeding bird survey, analysis results 1966–2022. U.S. Geological Survey, Laurel, MD, USA. https://doi.org/10.5066/P9SC7T11.