Introduction
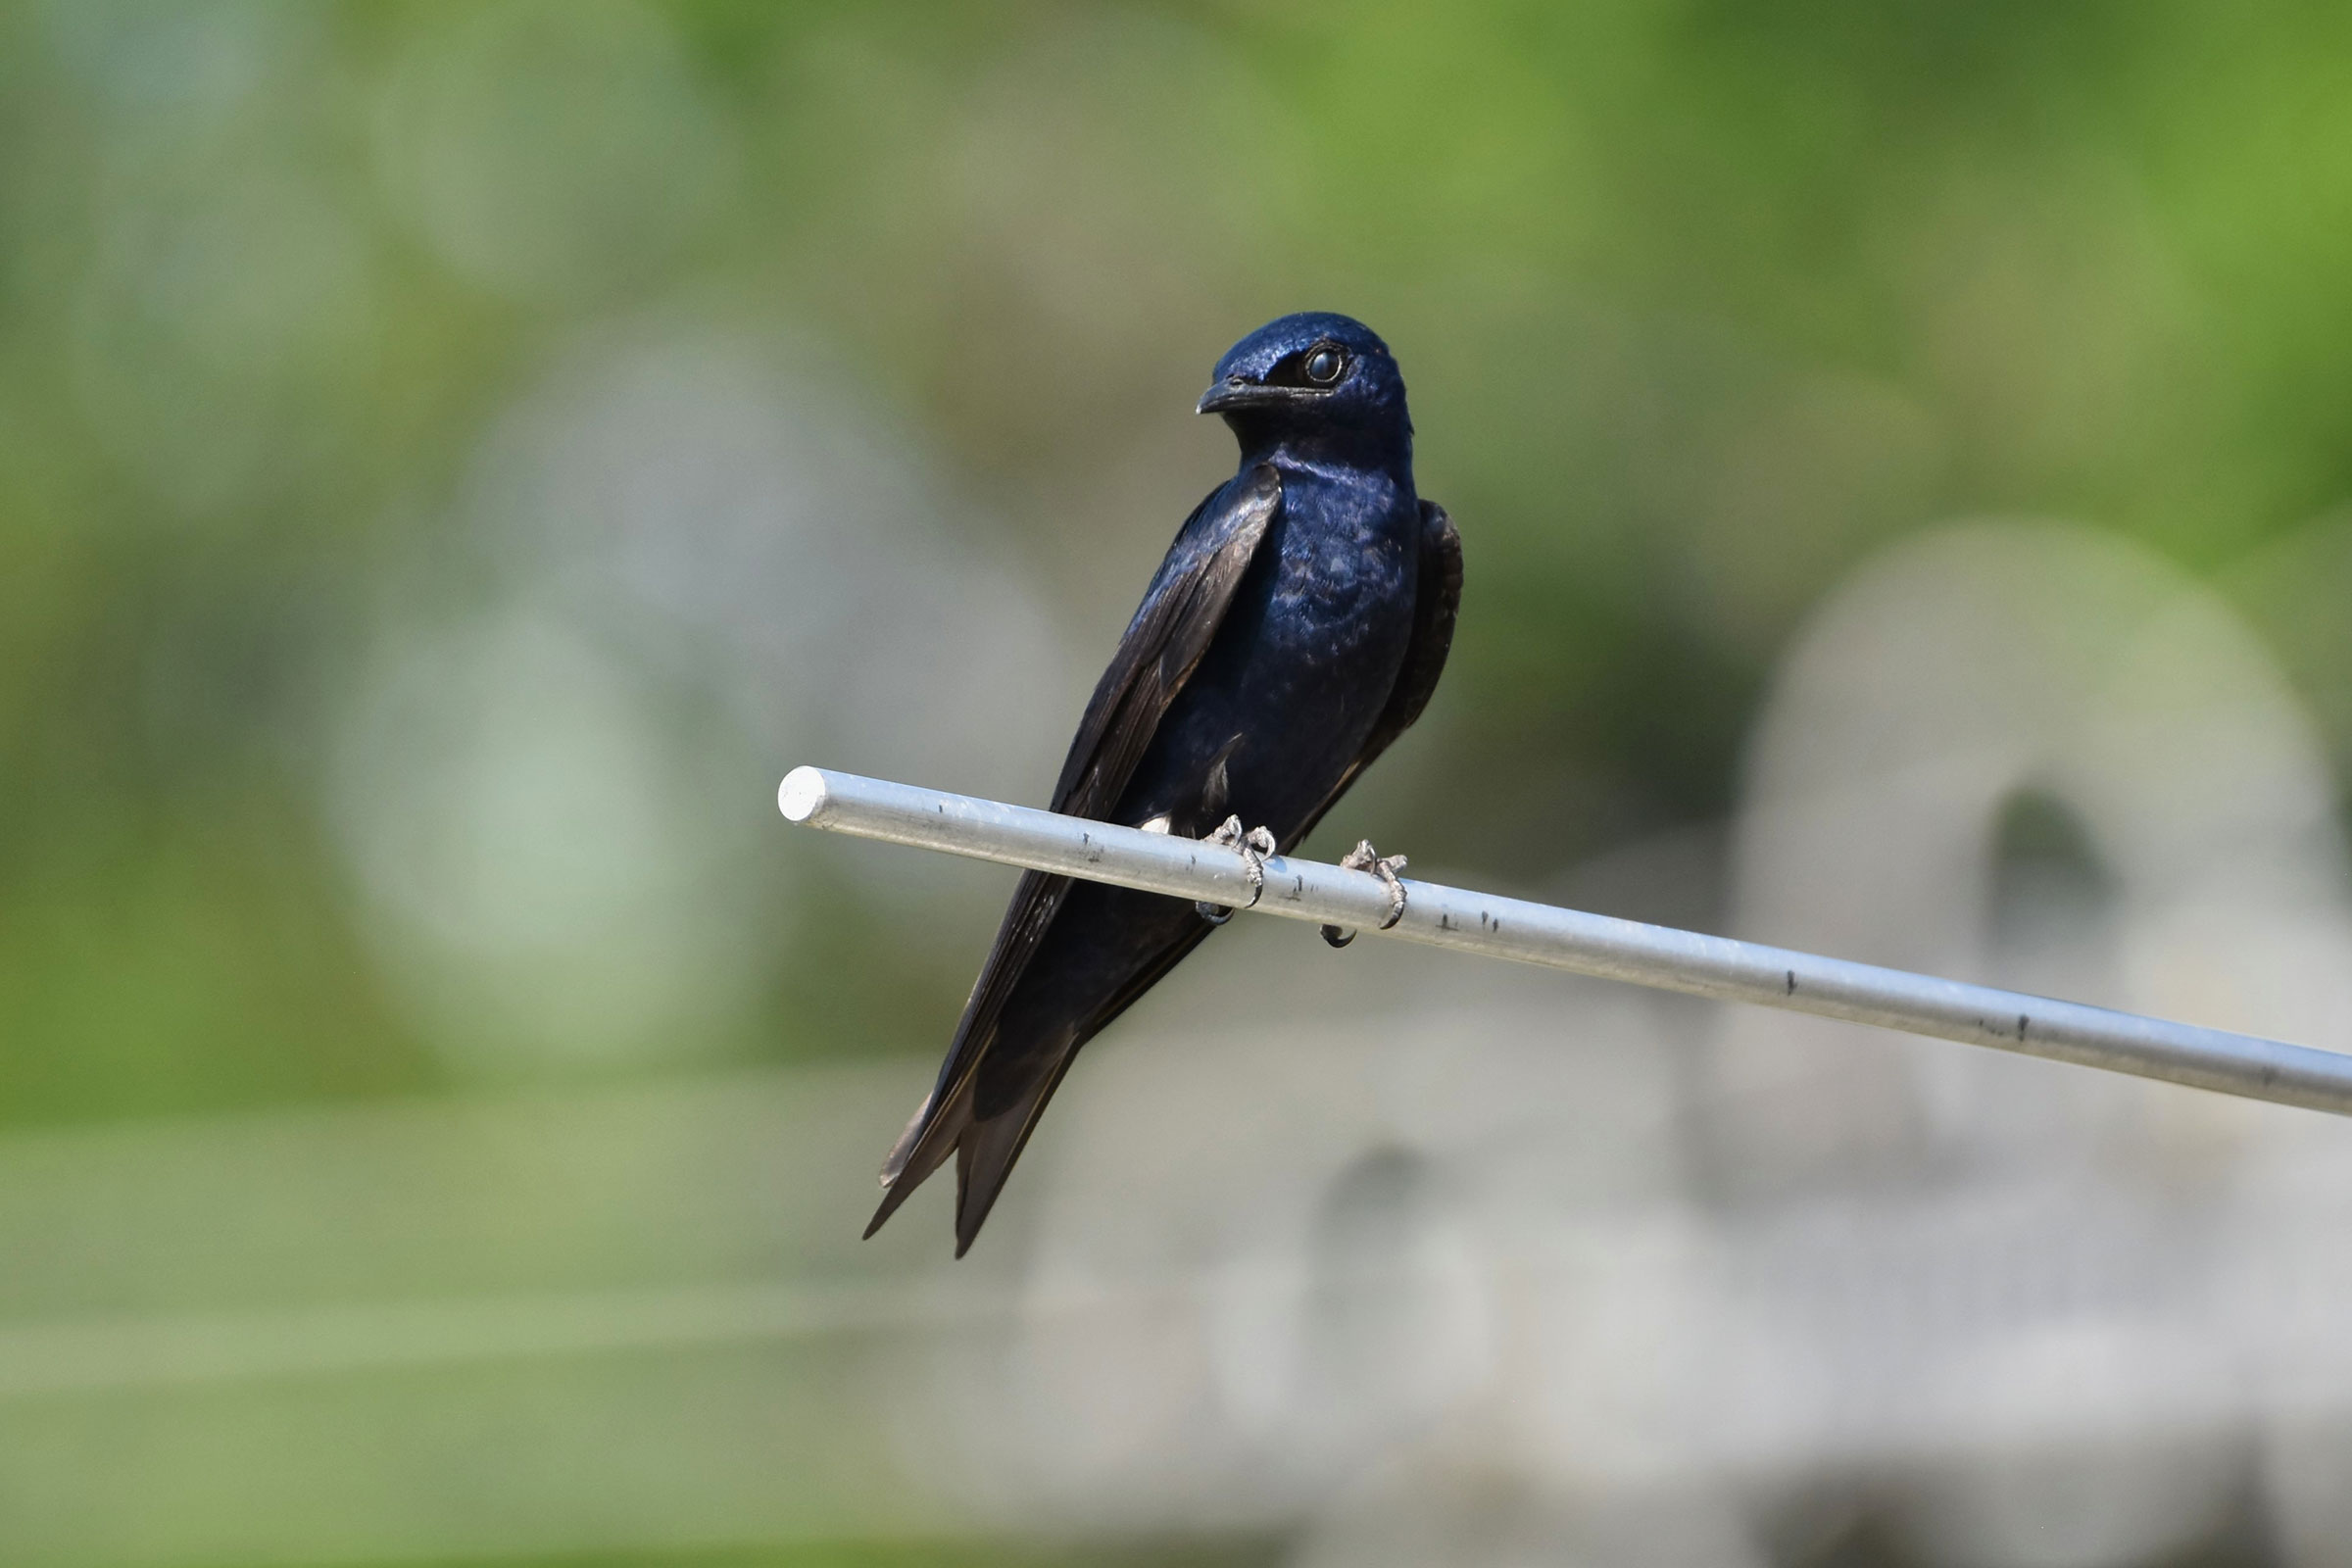
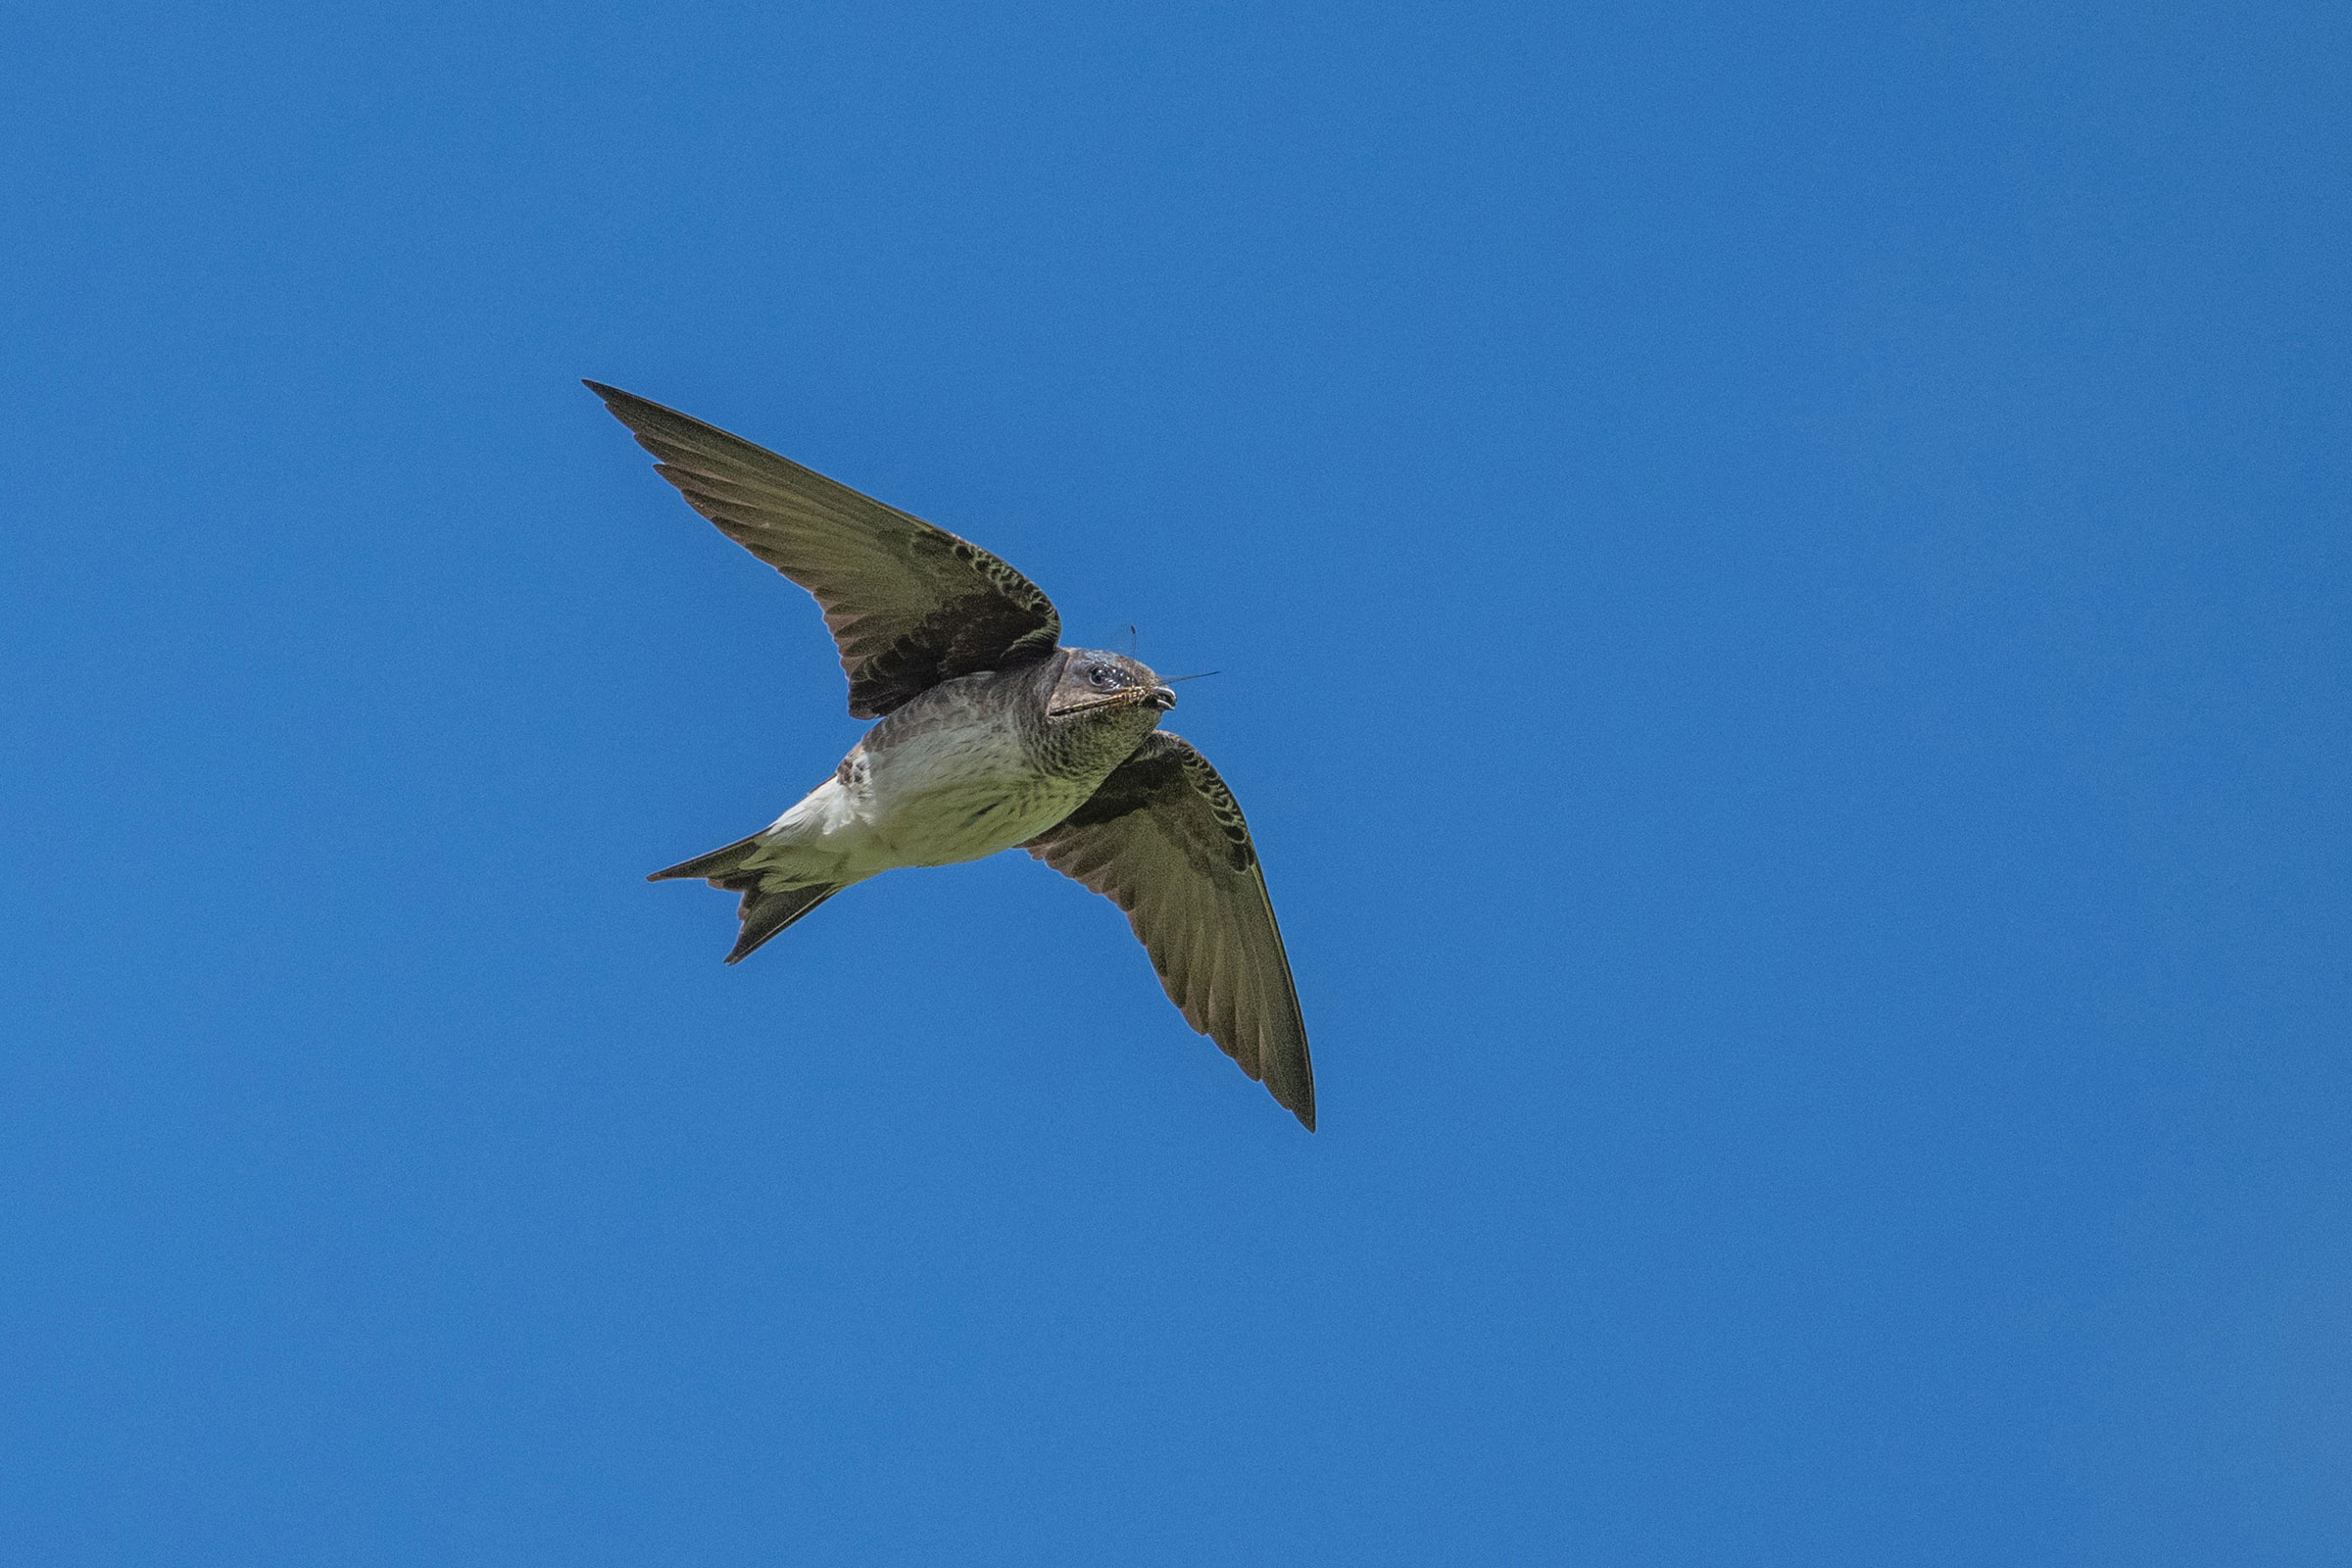
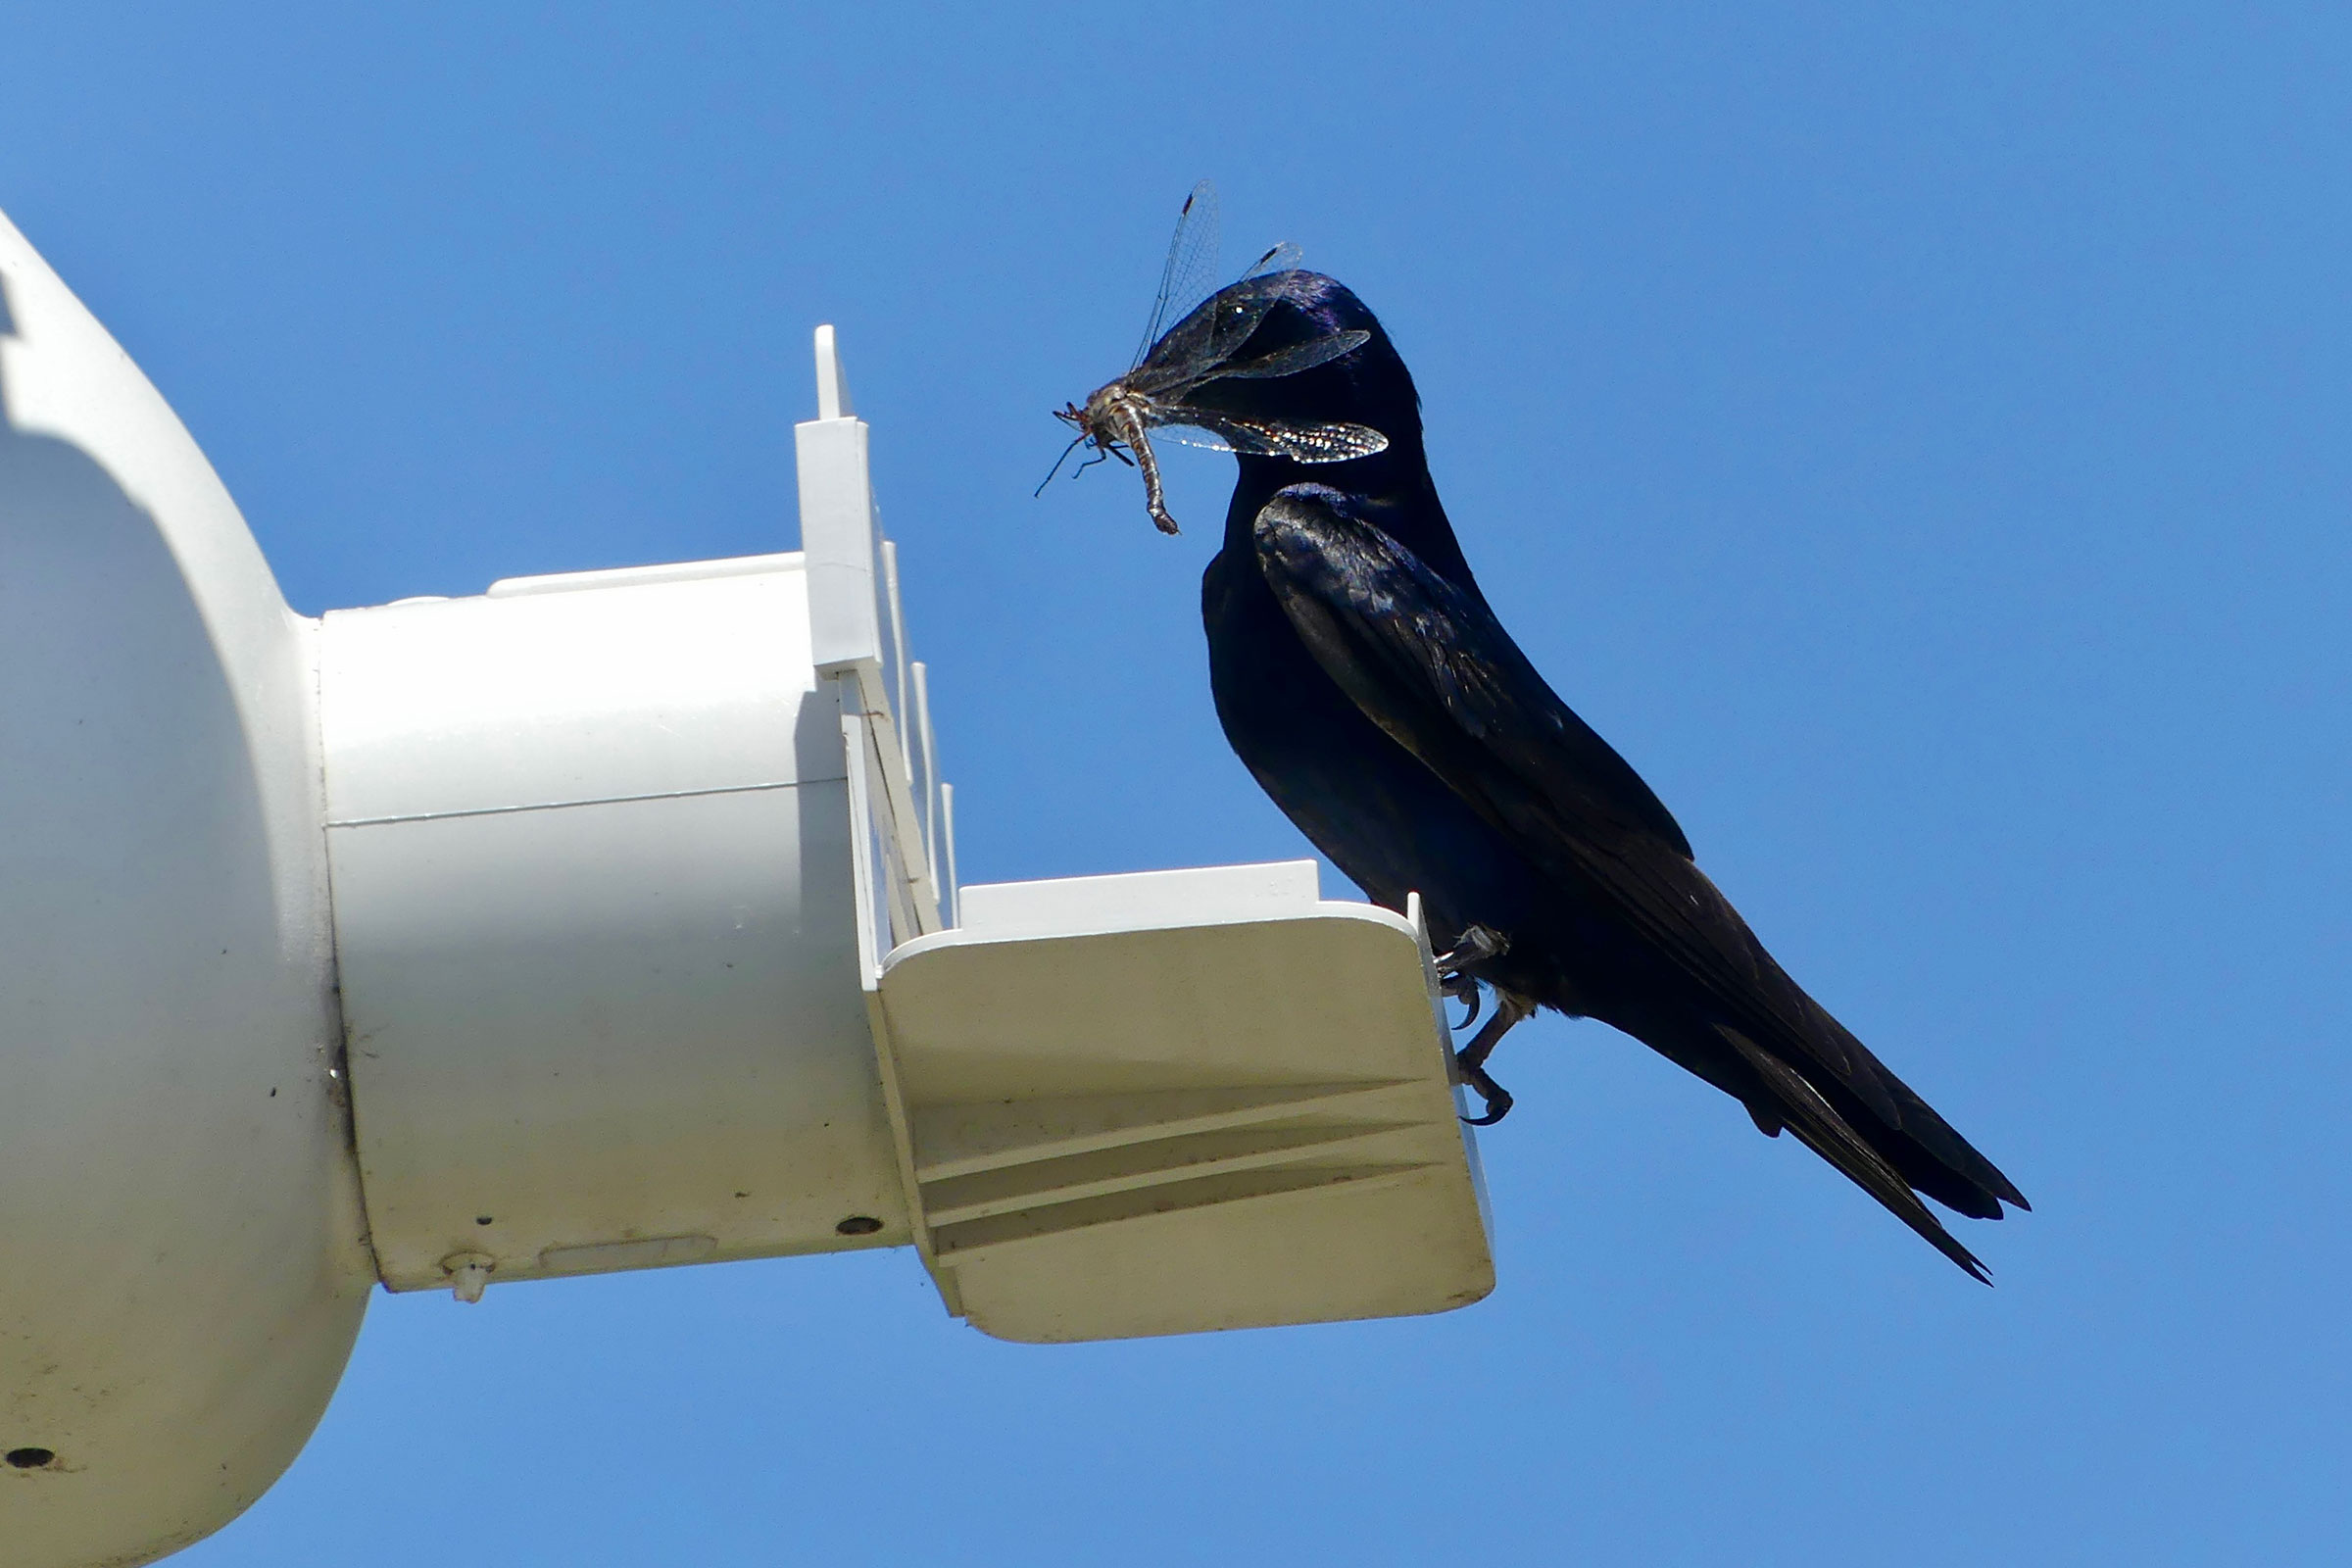
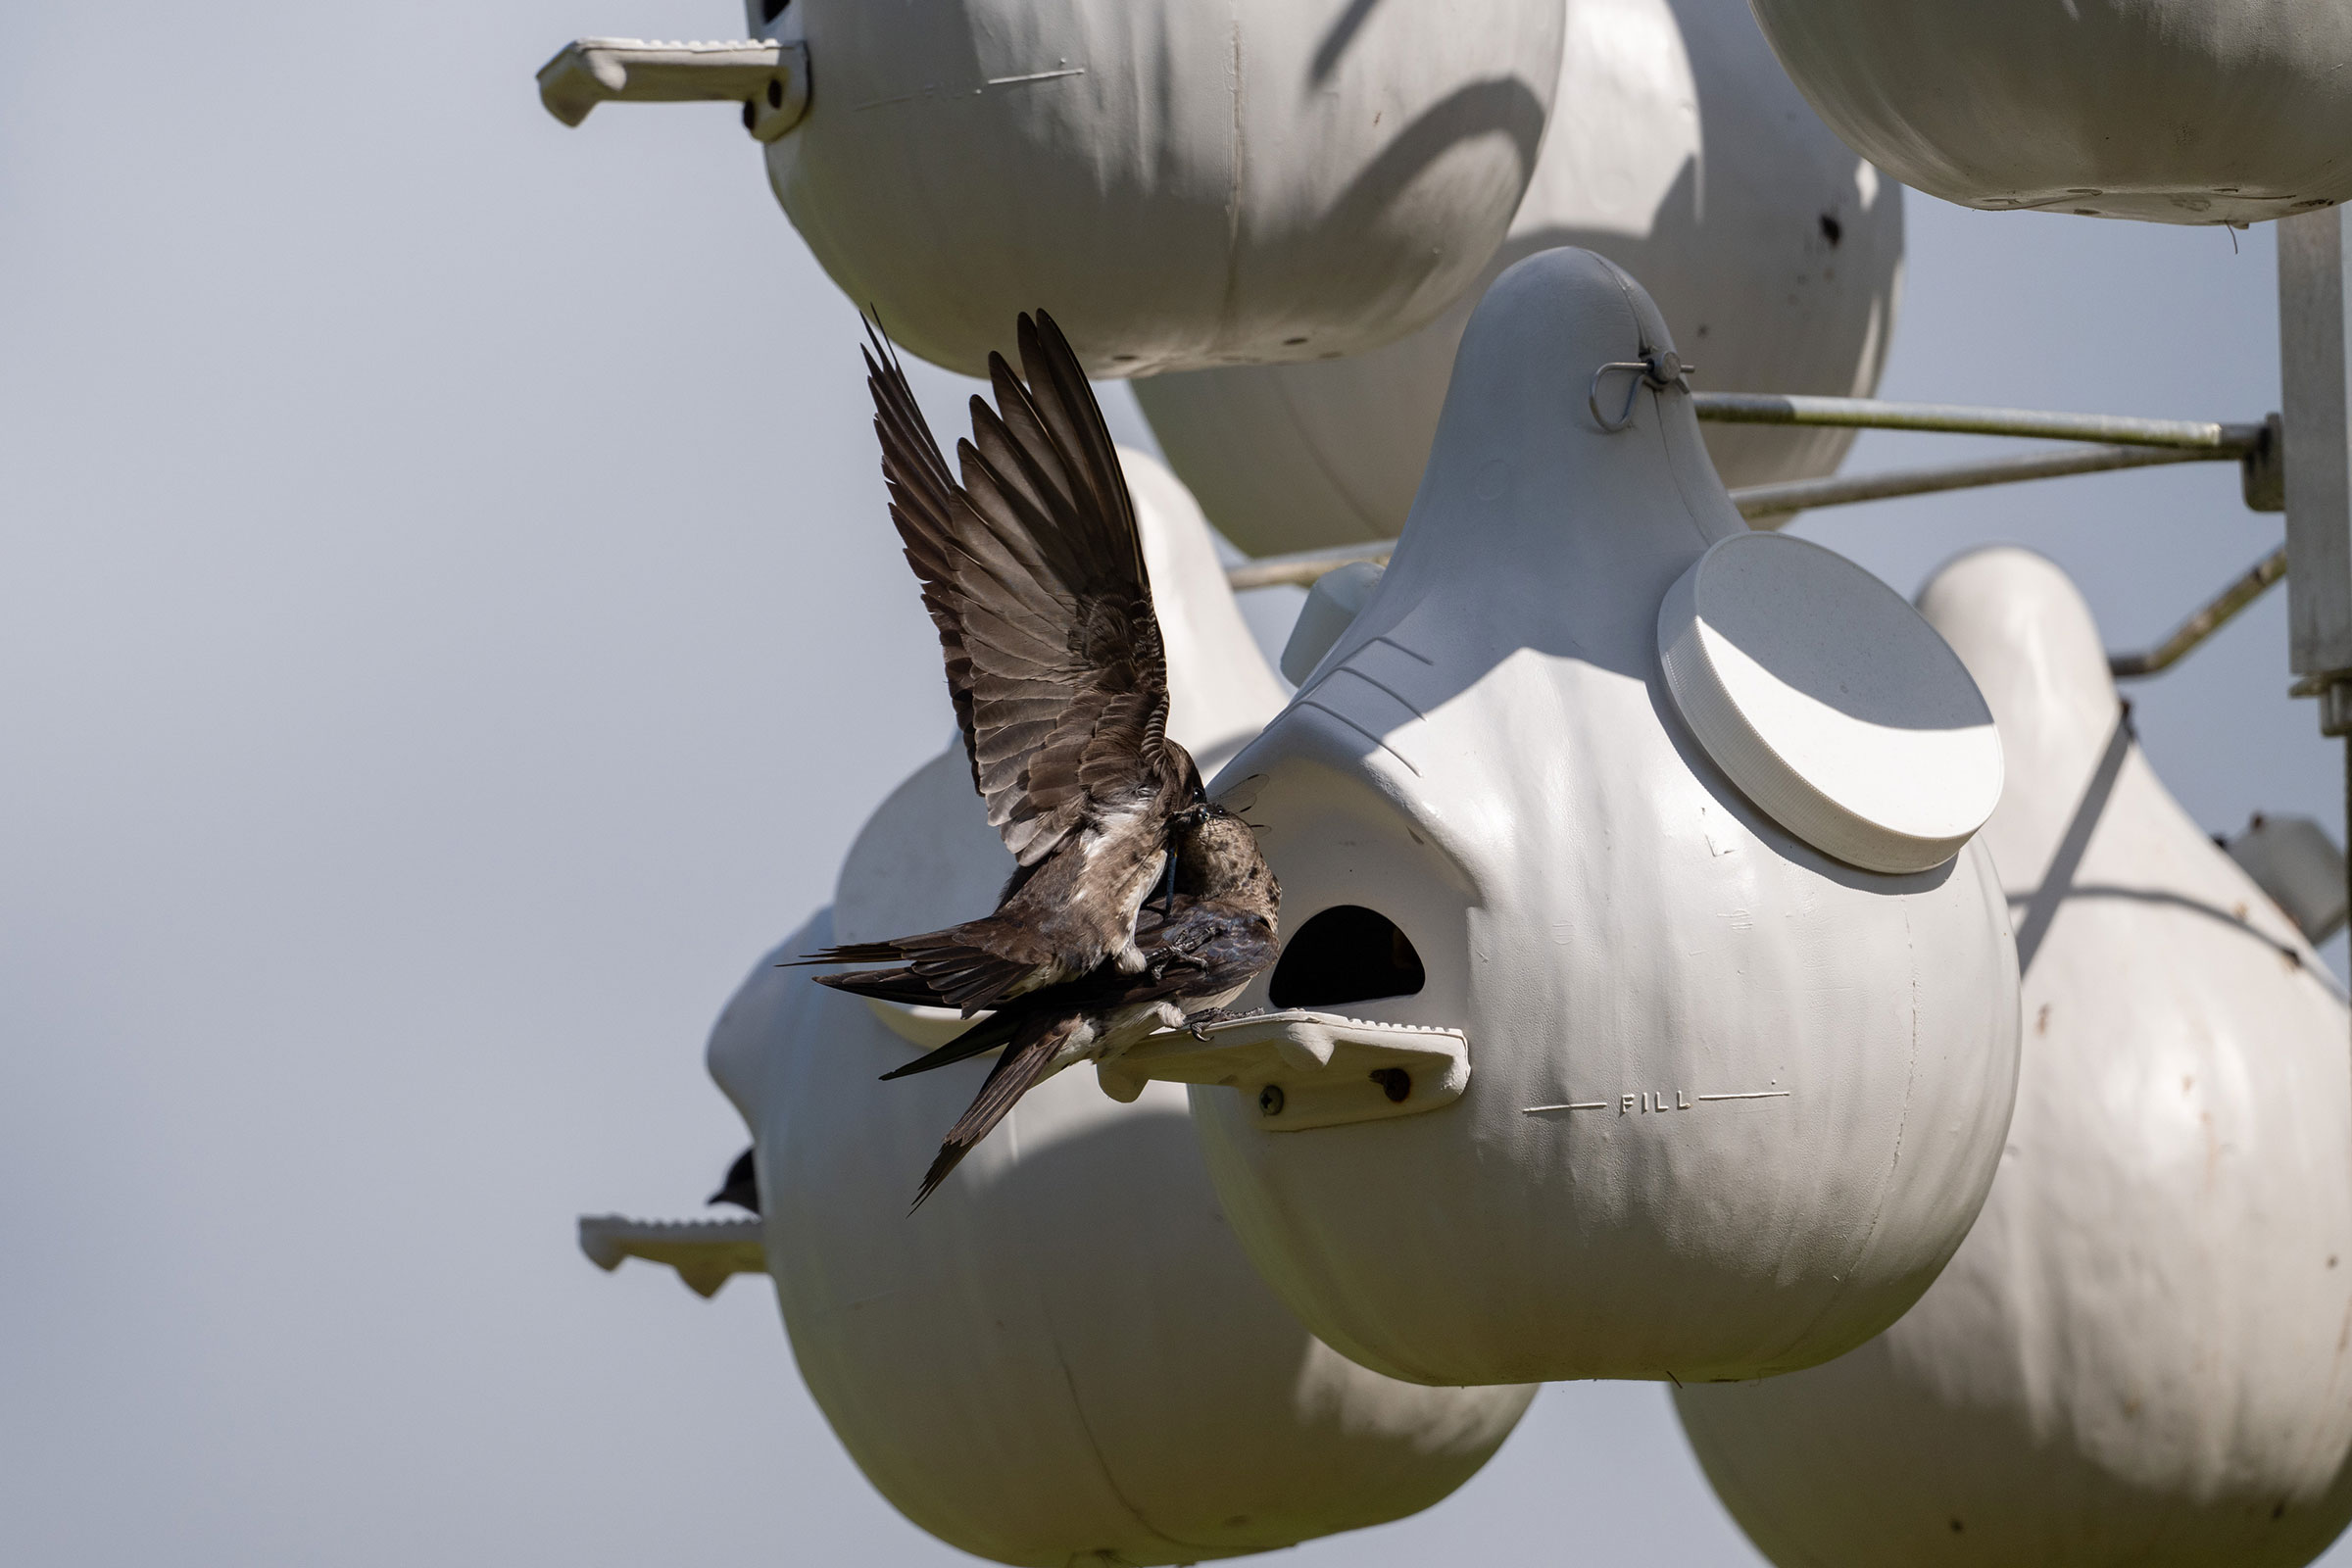
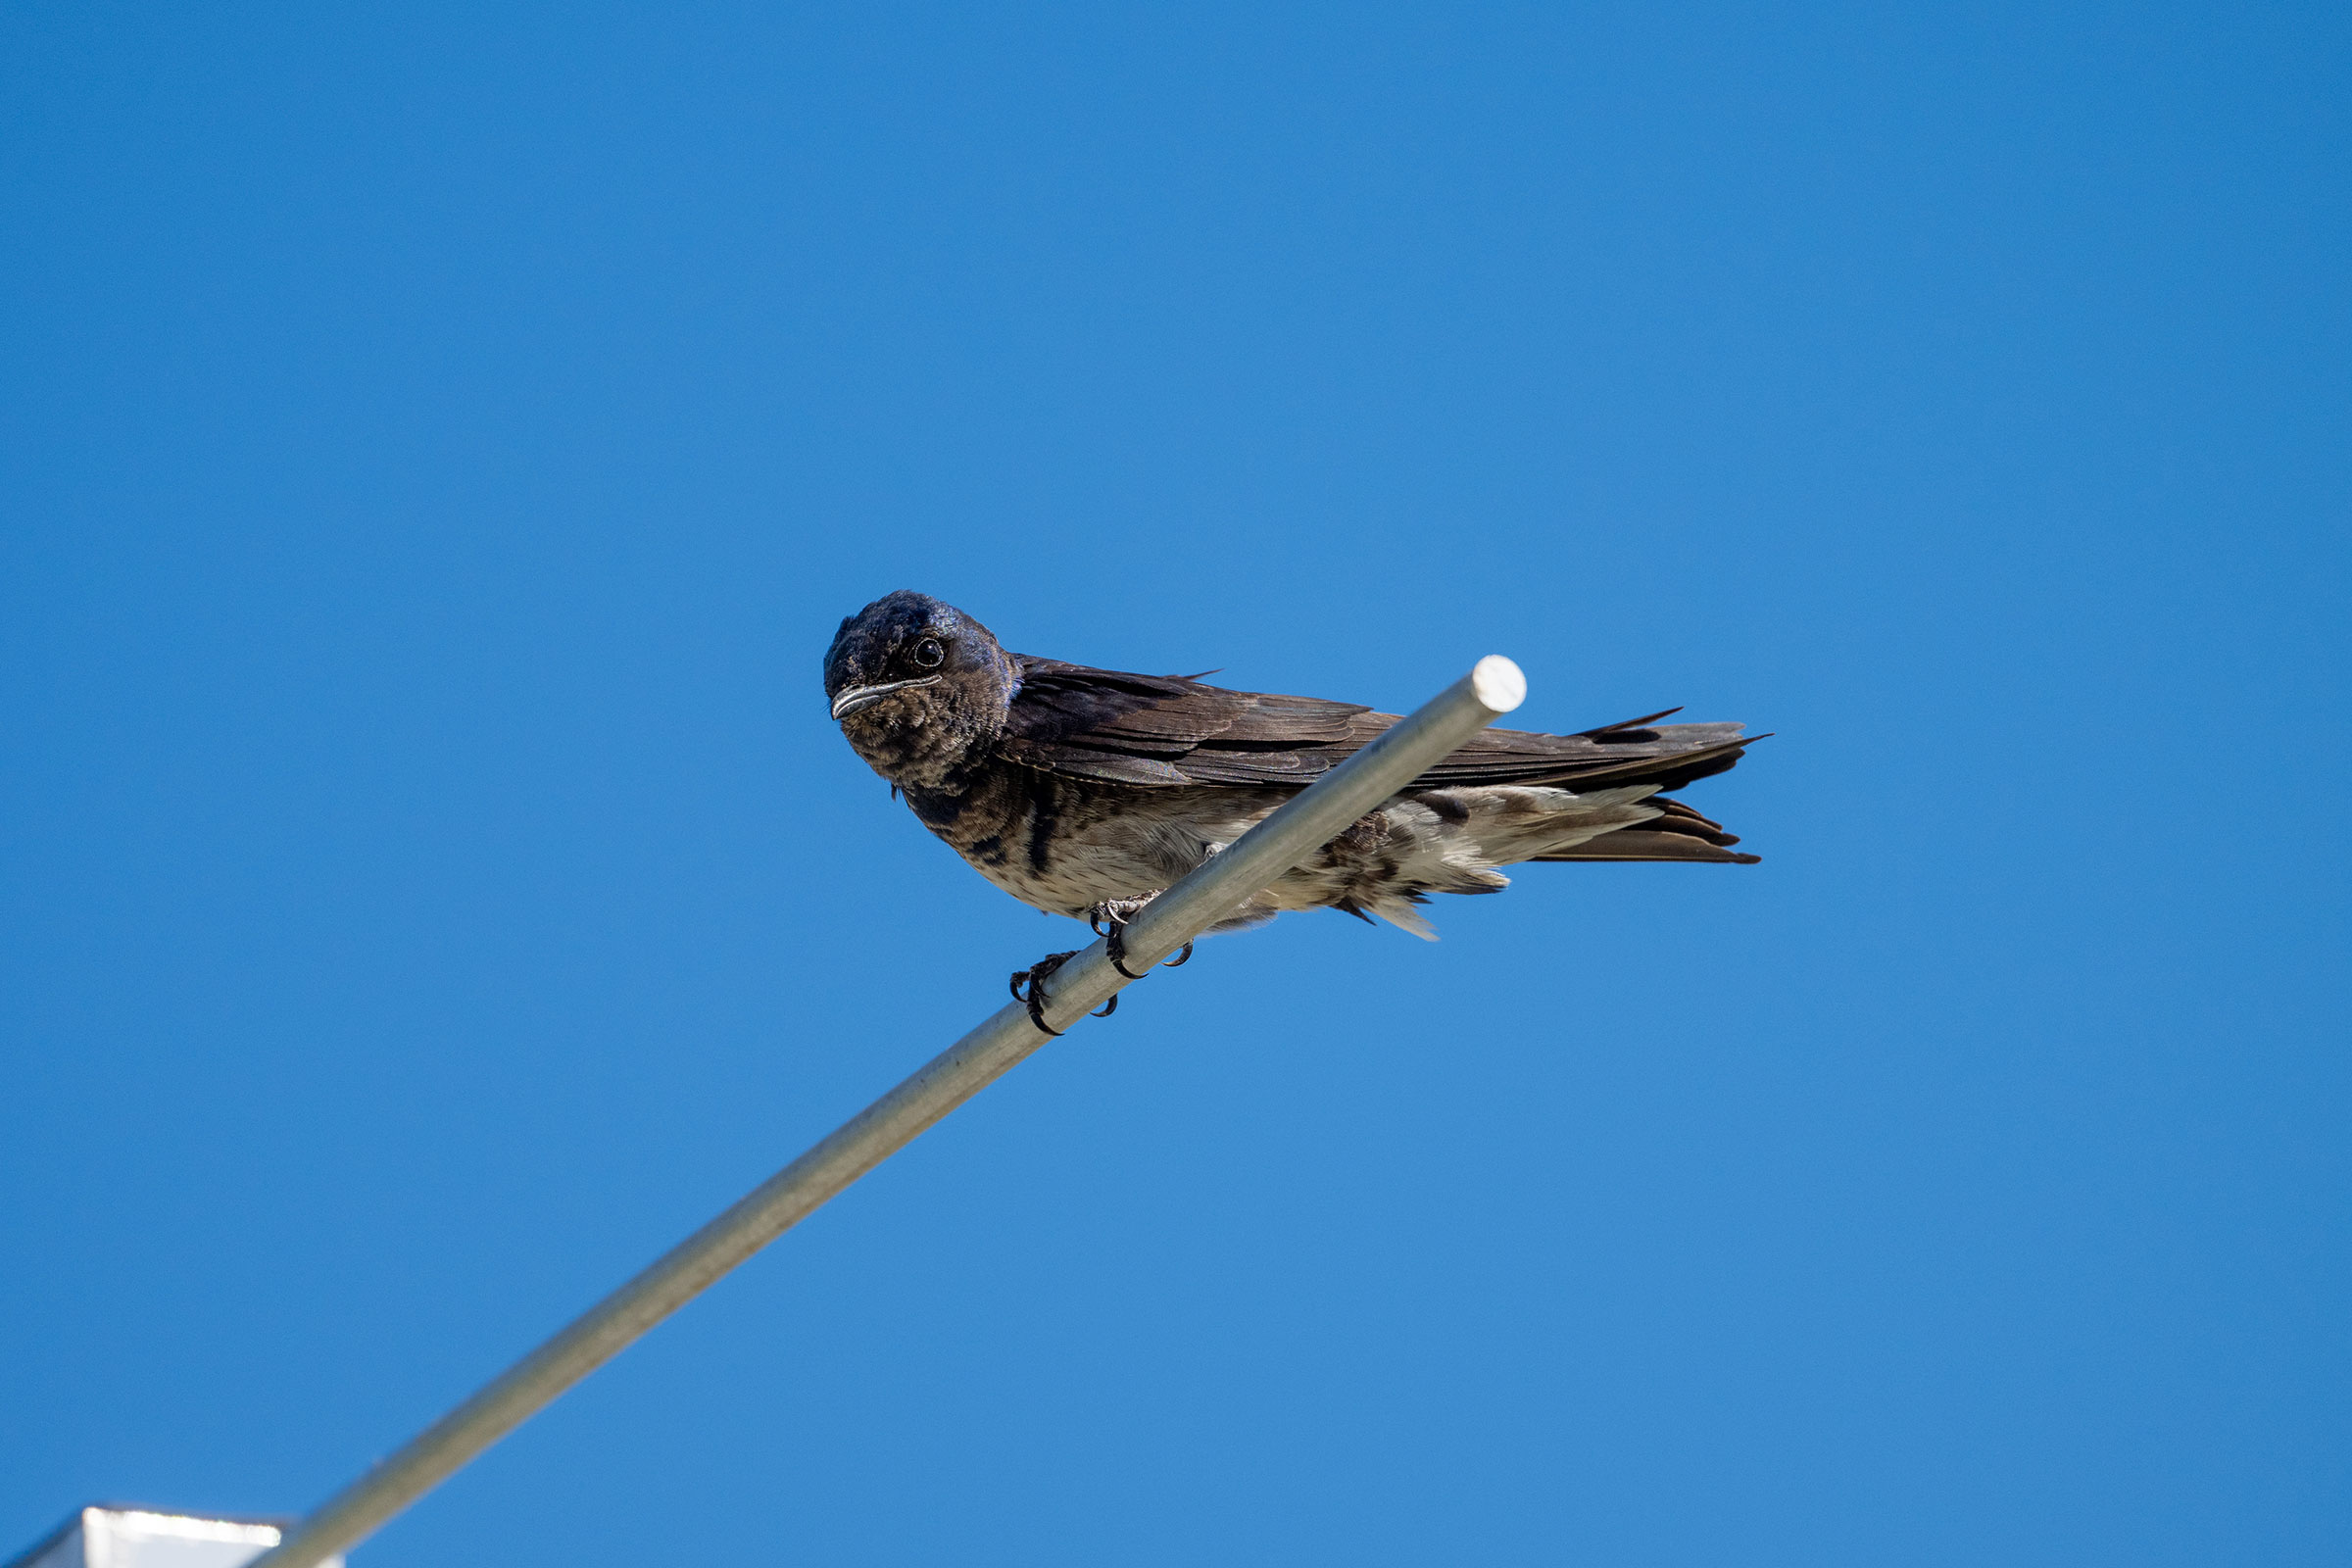
The Purple Martin is the largest swallow in the Commonwealth and even North America. Virginians have been living alongside Purple Martins for thousands of years. Native Americans placed hollowed gourds for martins, and colonists constructed houses to attract the insect eaters to towns and storefronts (Brown et al. 2021). Today, in Virginia and elsewhere in the eastern portion of their range, Purple Martins tend to nest only in birdhouses. However, they typically forage for flying insects at high altitudes, making it difficult spot their sometimes acrobatic displays when catching their prey (Brown et al. 2021).
Breeding Distribution
Purple Martins are found throughout Virginia but are most likely to occur in the Coastal Plain and Piedmont regions, especially in southeastern portions of the Coastal Plain and on the Eastern Shore (Figure 1). They are less likely to occur in the Mountains and Valleys region where there are fewer open habitats, but within that region, they are predicted to be more likely to occur on valley floors. Purple Martins typically nest near water in open areas, such as hayfields and suburban yards (Brown et al. 2021). Accordingly, the species’ probable occurrence in a block increases as the amount of shrubland and grassland habitat increases. The distribution of Purple Martins in the state is likely driven by a combination of habitat conditions and the availability of nesting houses.
Between Atlases (Figures 1 and 2), the Purple Martin’s predicted occurrence decreased in Northern Virginia, possibly in response to ongoing urbanization. The remaining portions of the Piedmont region and all the Coastal Plain and Mountains and Valleys regions showed no change in likely occurrence (Figure 3).
View Environmental Associations
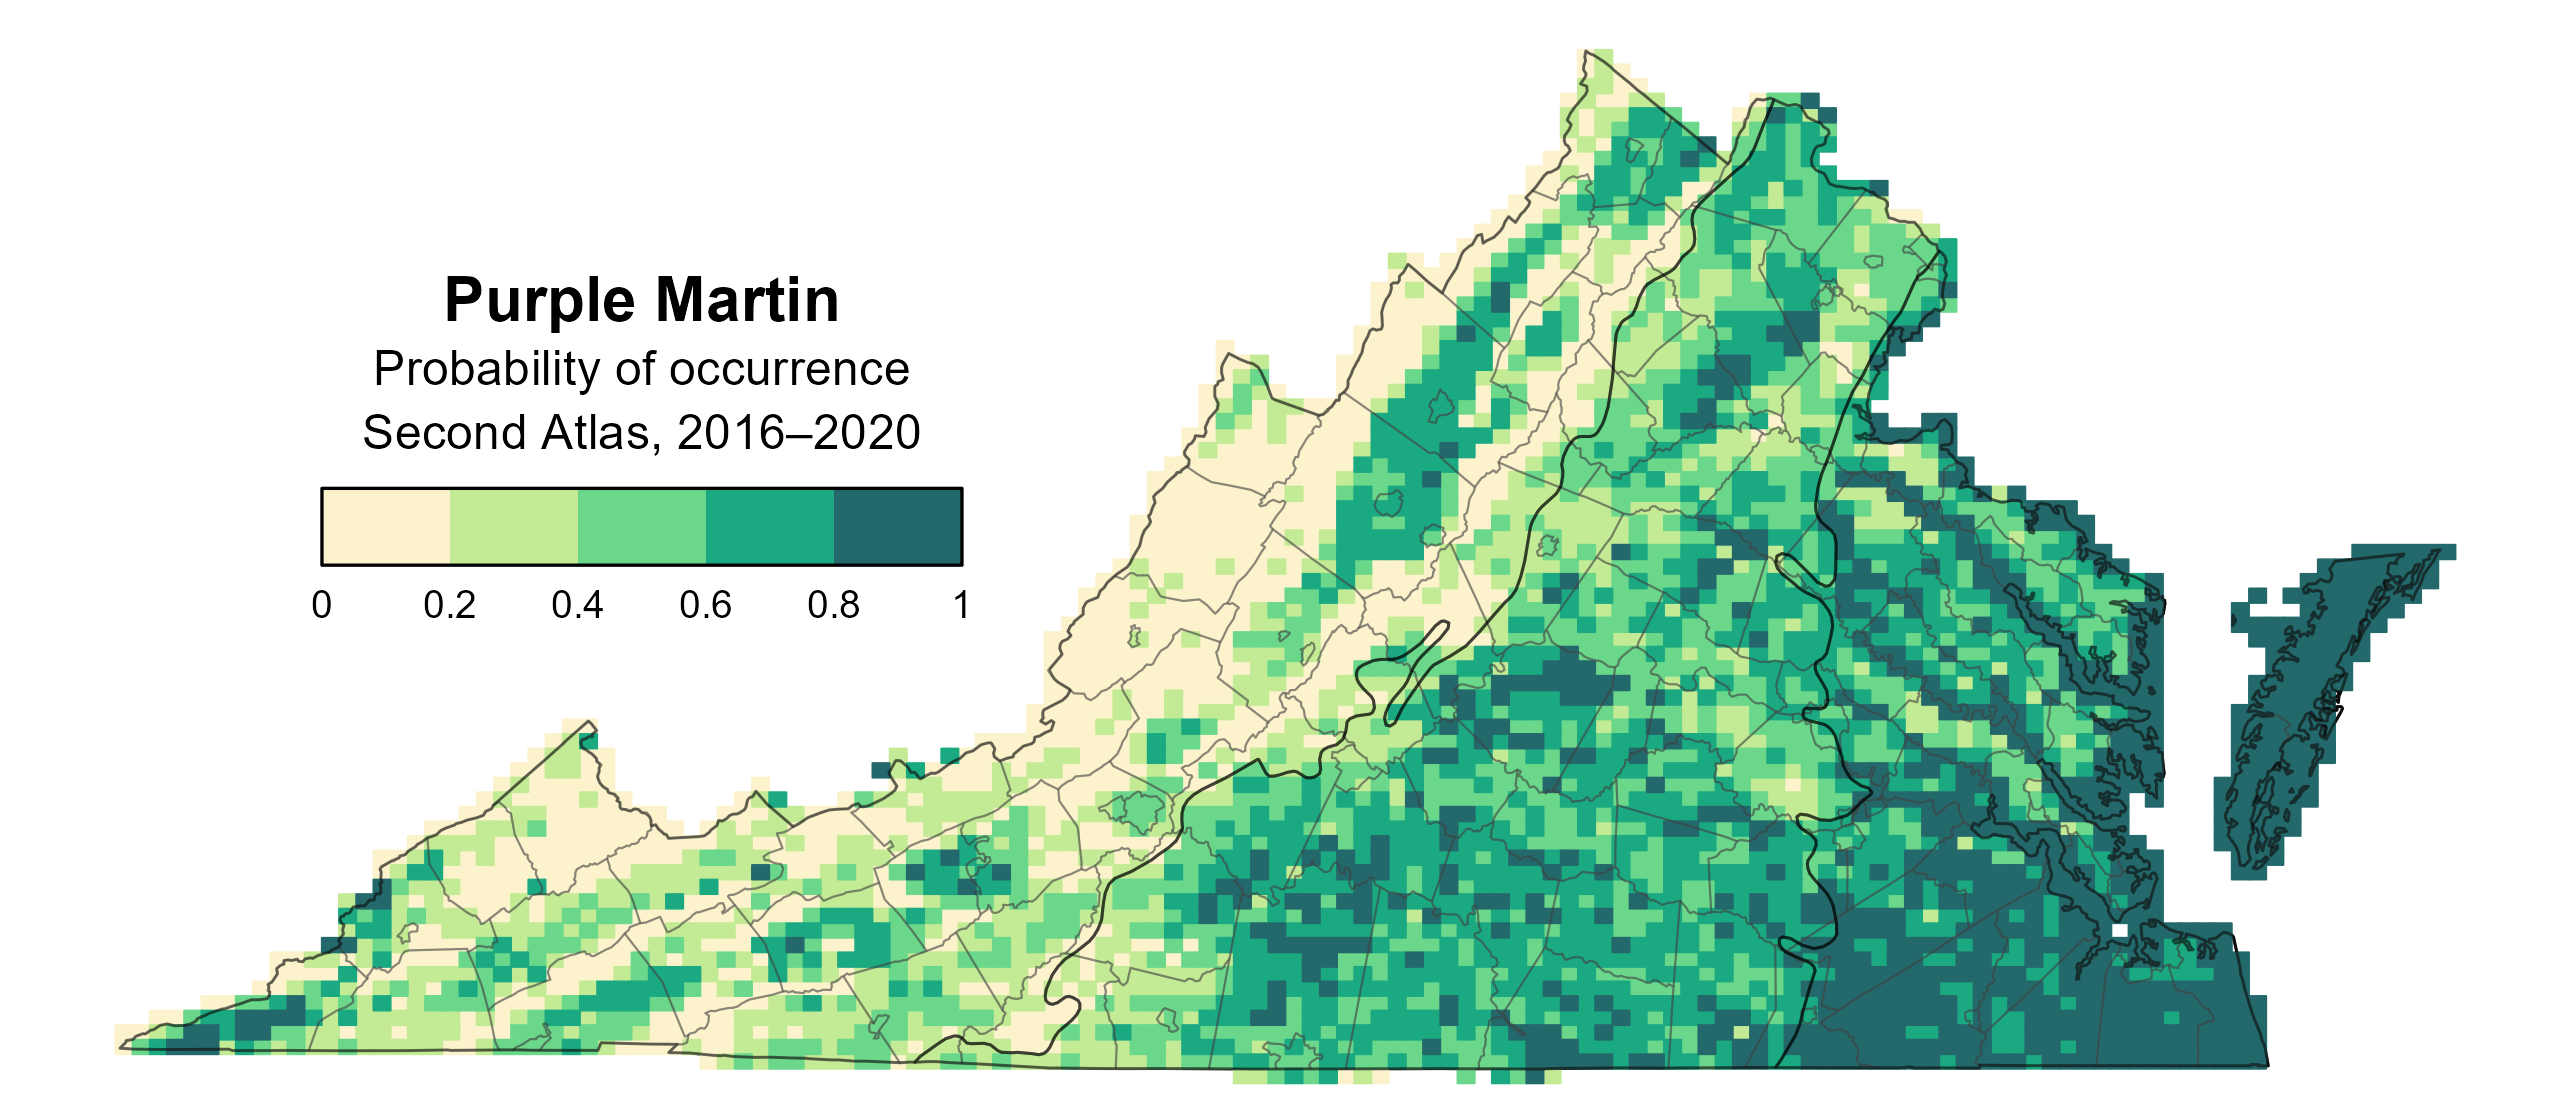
Figure 1: Purple Martin breeding distribution based on probability of occurrence (Second Atlas, 2016–2020). This map indicates the probability that this species will occur in an Atlas block (an approximately 10 mi2 [26 km2] survey unit) based on environmental (including habitat) factors and after adjusting for the probability of detection (variation in survey effort among blocks).
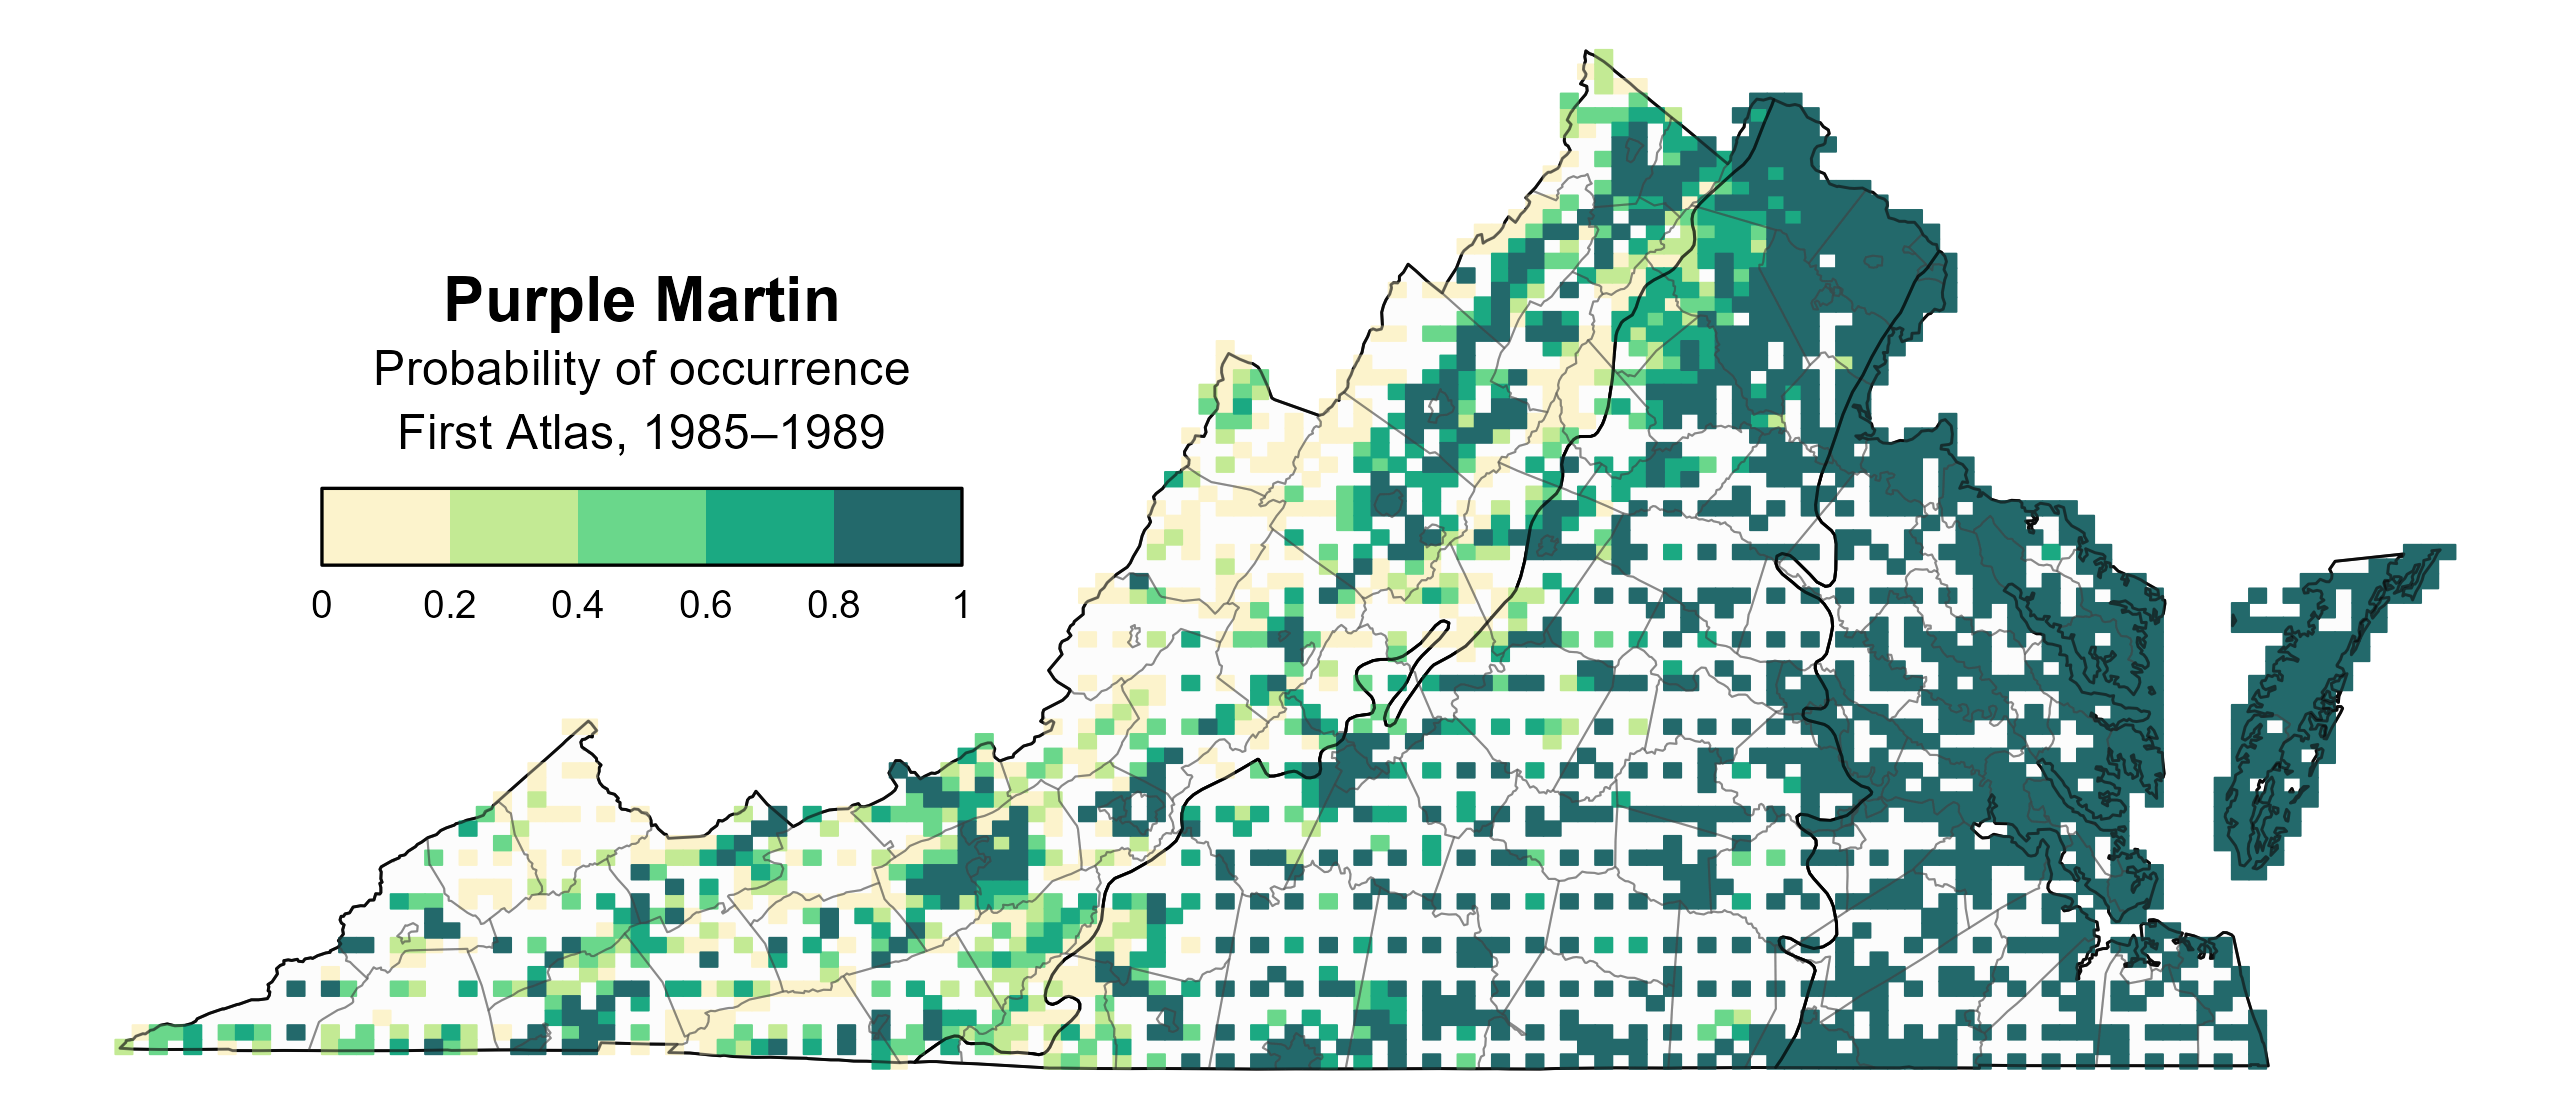
Figure 2: Purple Martin breeding distribution based on probability of occurrence (First Atlas, 1985–1989). This map indicates the probability that this species will occur in an Atlas block (an approximately 10 mi2 [26 km2] survey unit) based on environmental (including habitat) factors and after adjusting for the probability of detection (variation in survey effort among blocks). Blocks in white were not surveyed during the First Atlas and were not modeled.
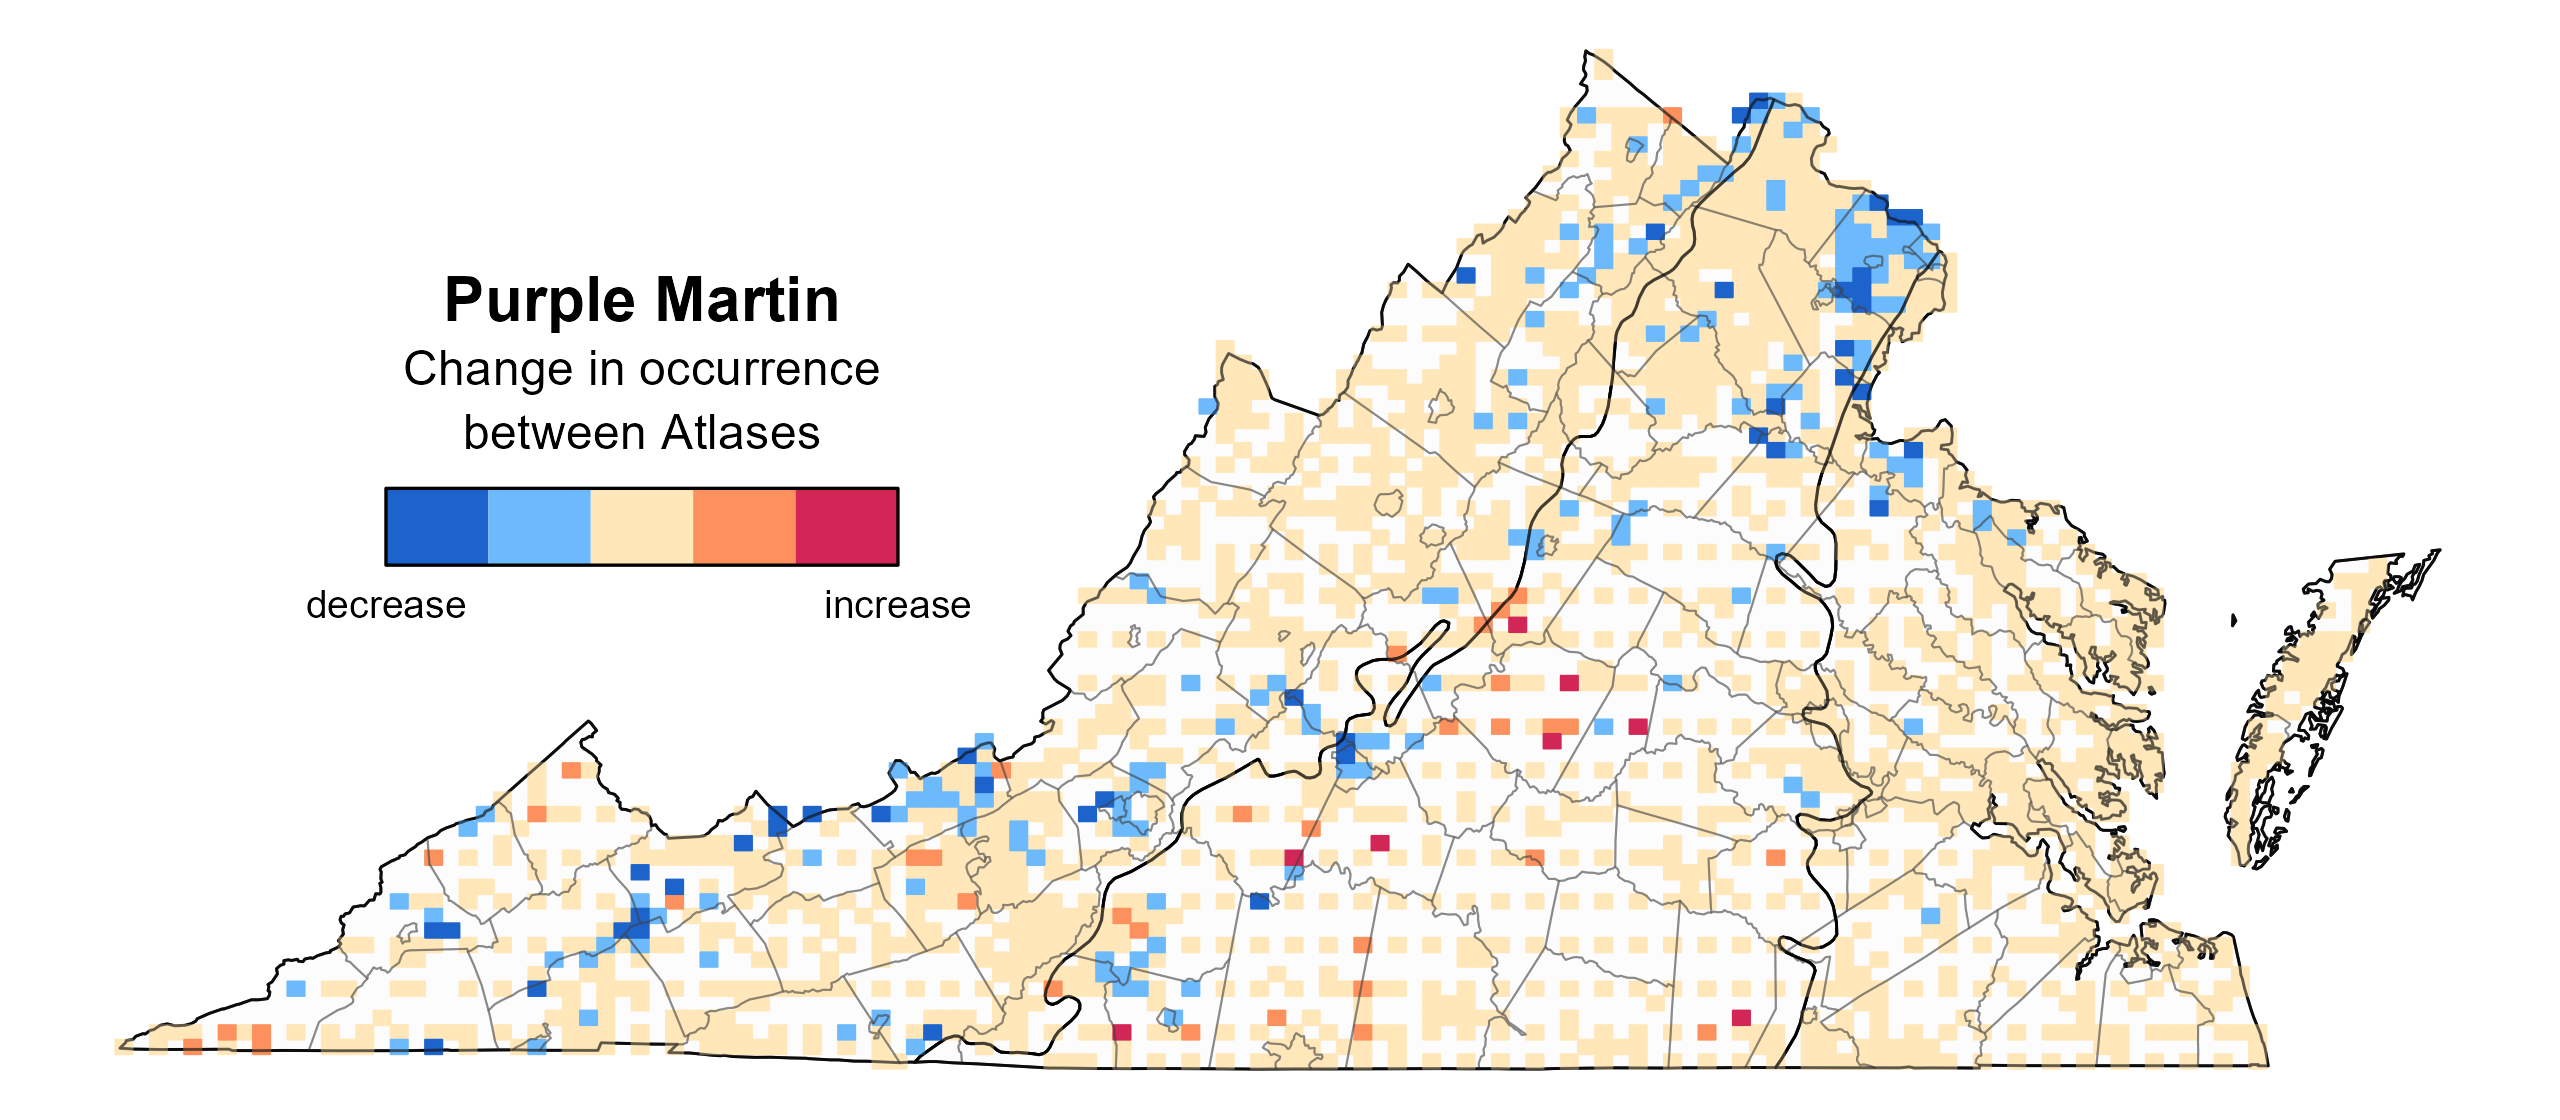
Figure 3: Purple Martin change in breeding distribution between Atlases (1985–1989 and 2016–2020) based on probability of occurrence. This map indicates the change in the probability that this species will occur in a block between Atlas periods. Blocks with no change (tan) may have constant presence or constant absence. Blocks in white were not surveyed during the First Atlas and were not modeled.
Breeding Evidence
Purple Martins were confirmed breeders in 482 blocks and 96 counties and probable breeders in an additional nine counties (Figure 4). During both Atlas periods, most breeding observations were recorded in the Coastal Plain and Piedmont regions (Figures 4 and 5).
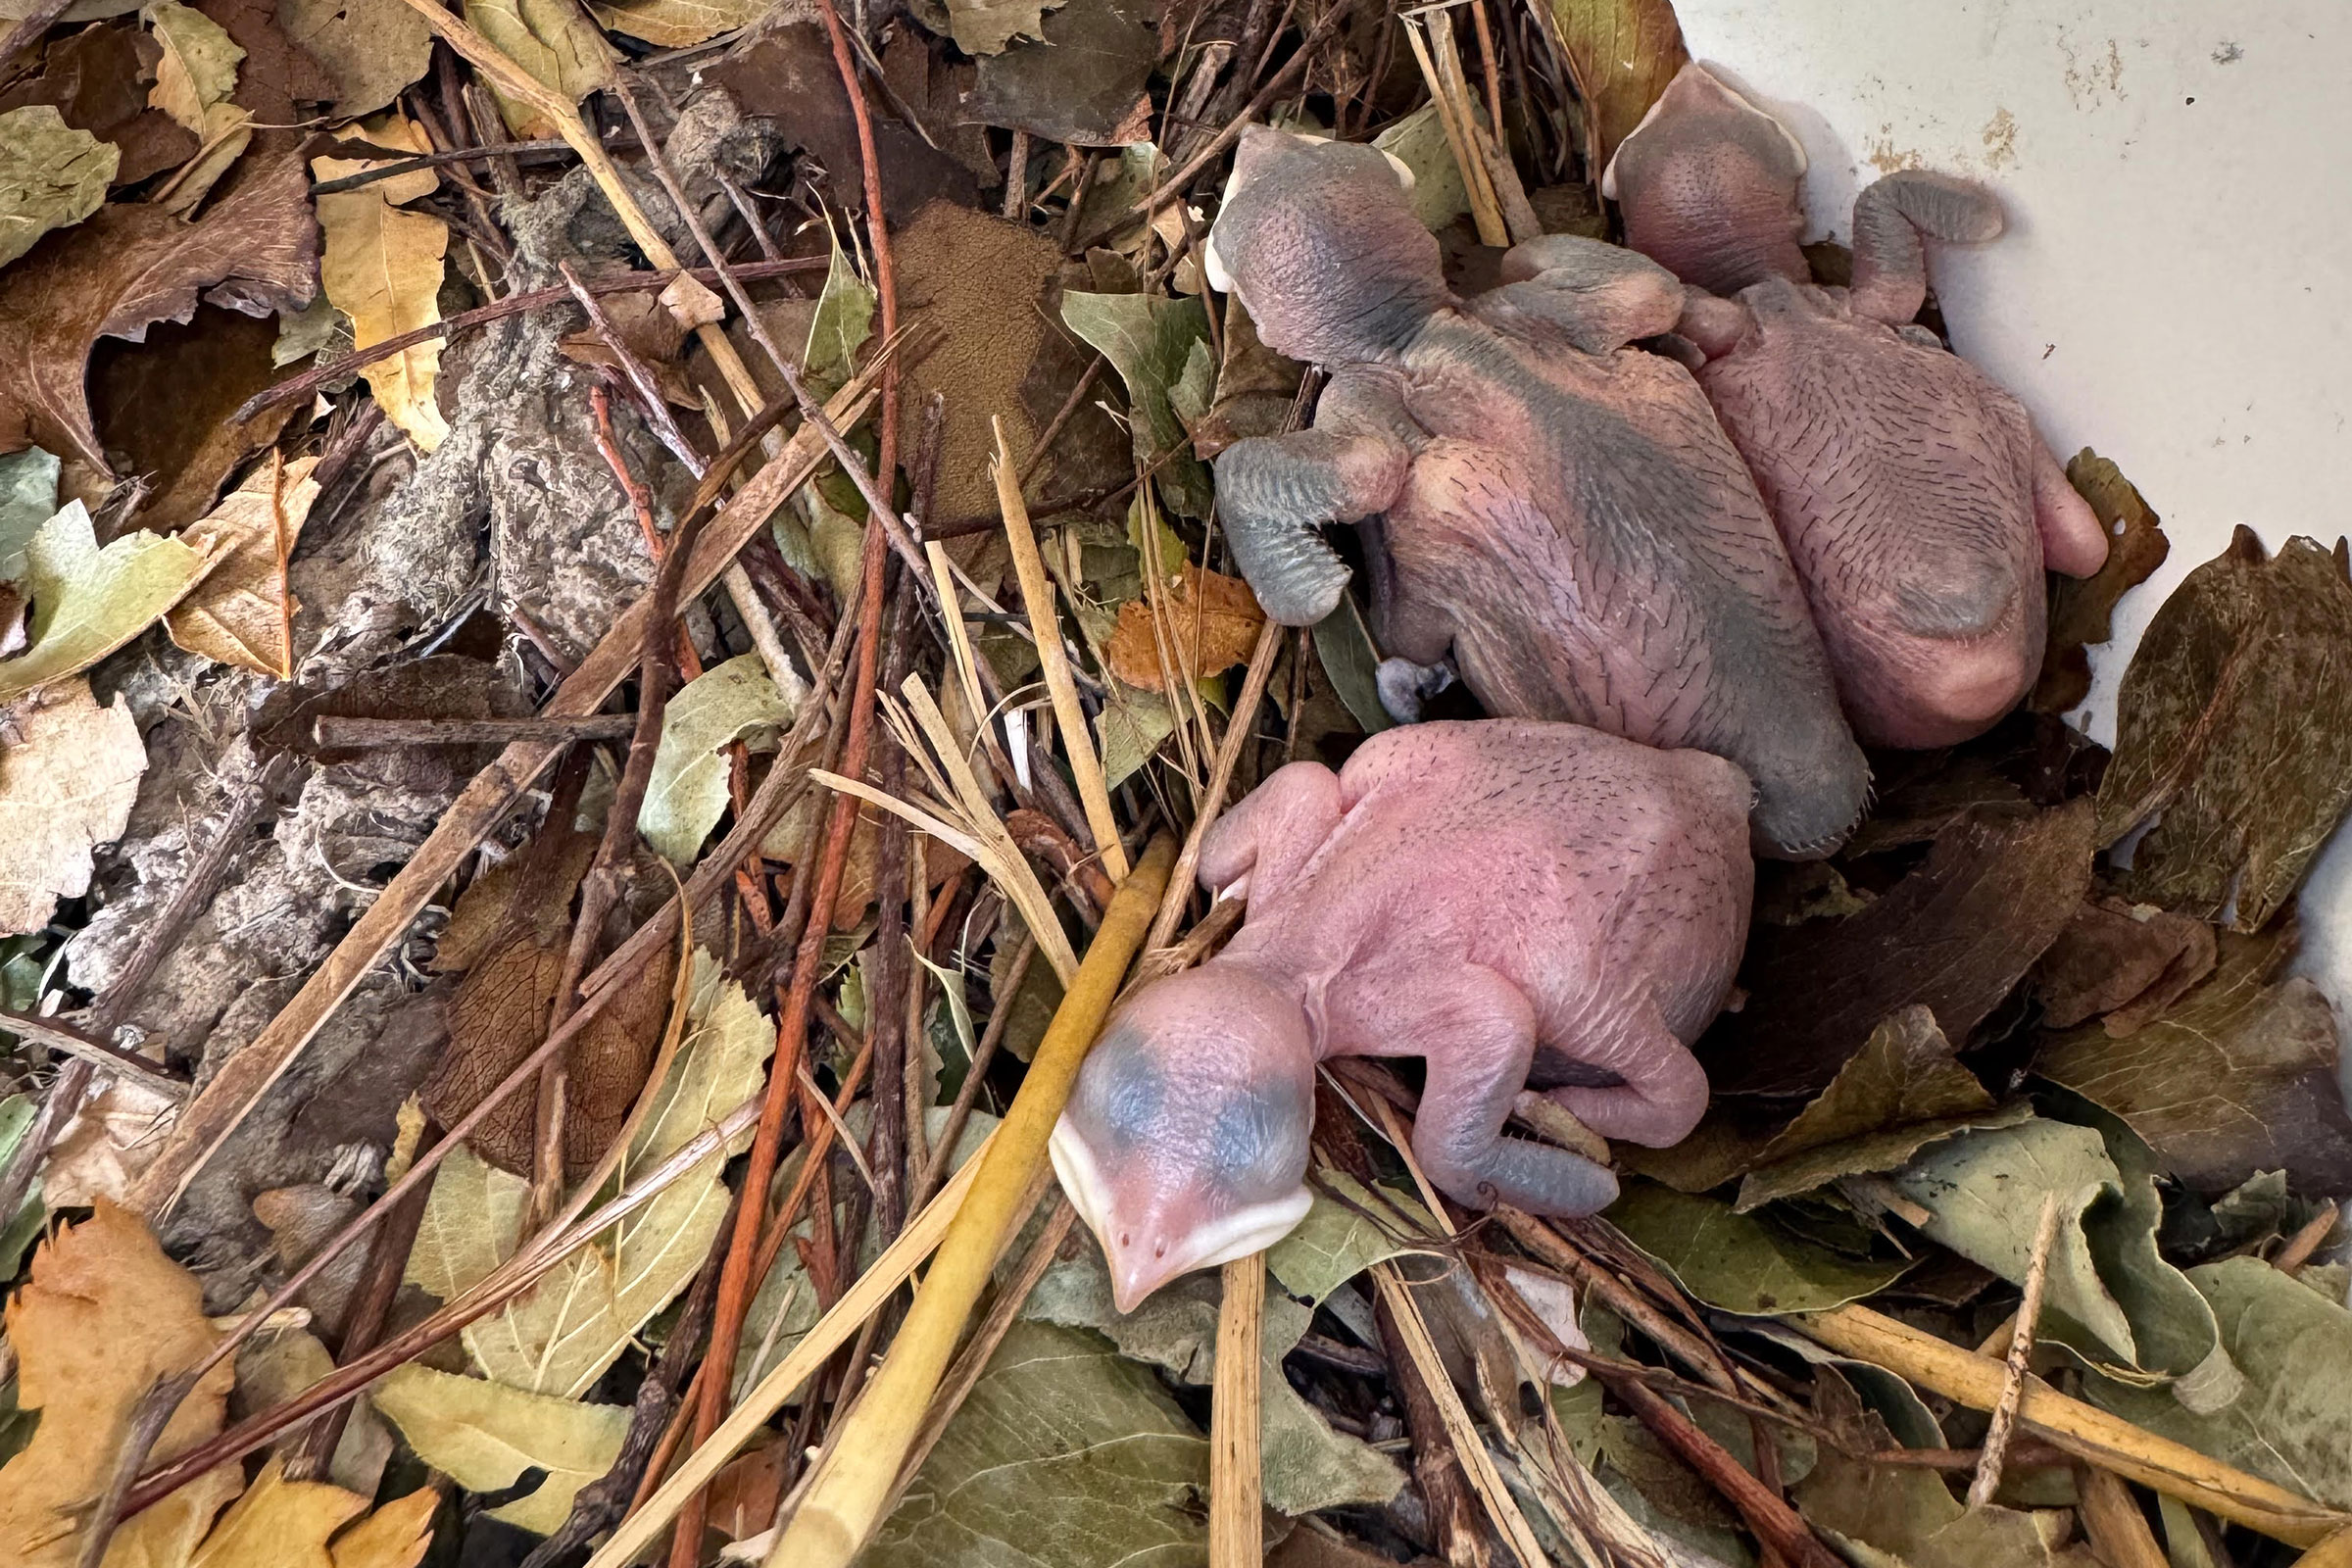
For Purple Martins, occupied nests were the earliest breeding behavior observed by volunteers, occurring on March 19 (Figure 6). This was also the most often observed breeding behavior. Other breeding behaviors recorded included recently fledged young (May 13 – August 16) and nests with young (May 15 – August 2).
For more general information on the breeding habits of this species, please refer to All About Birds.
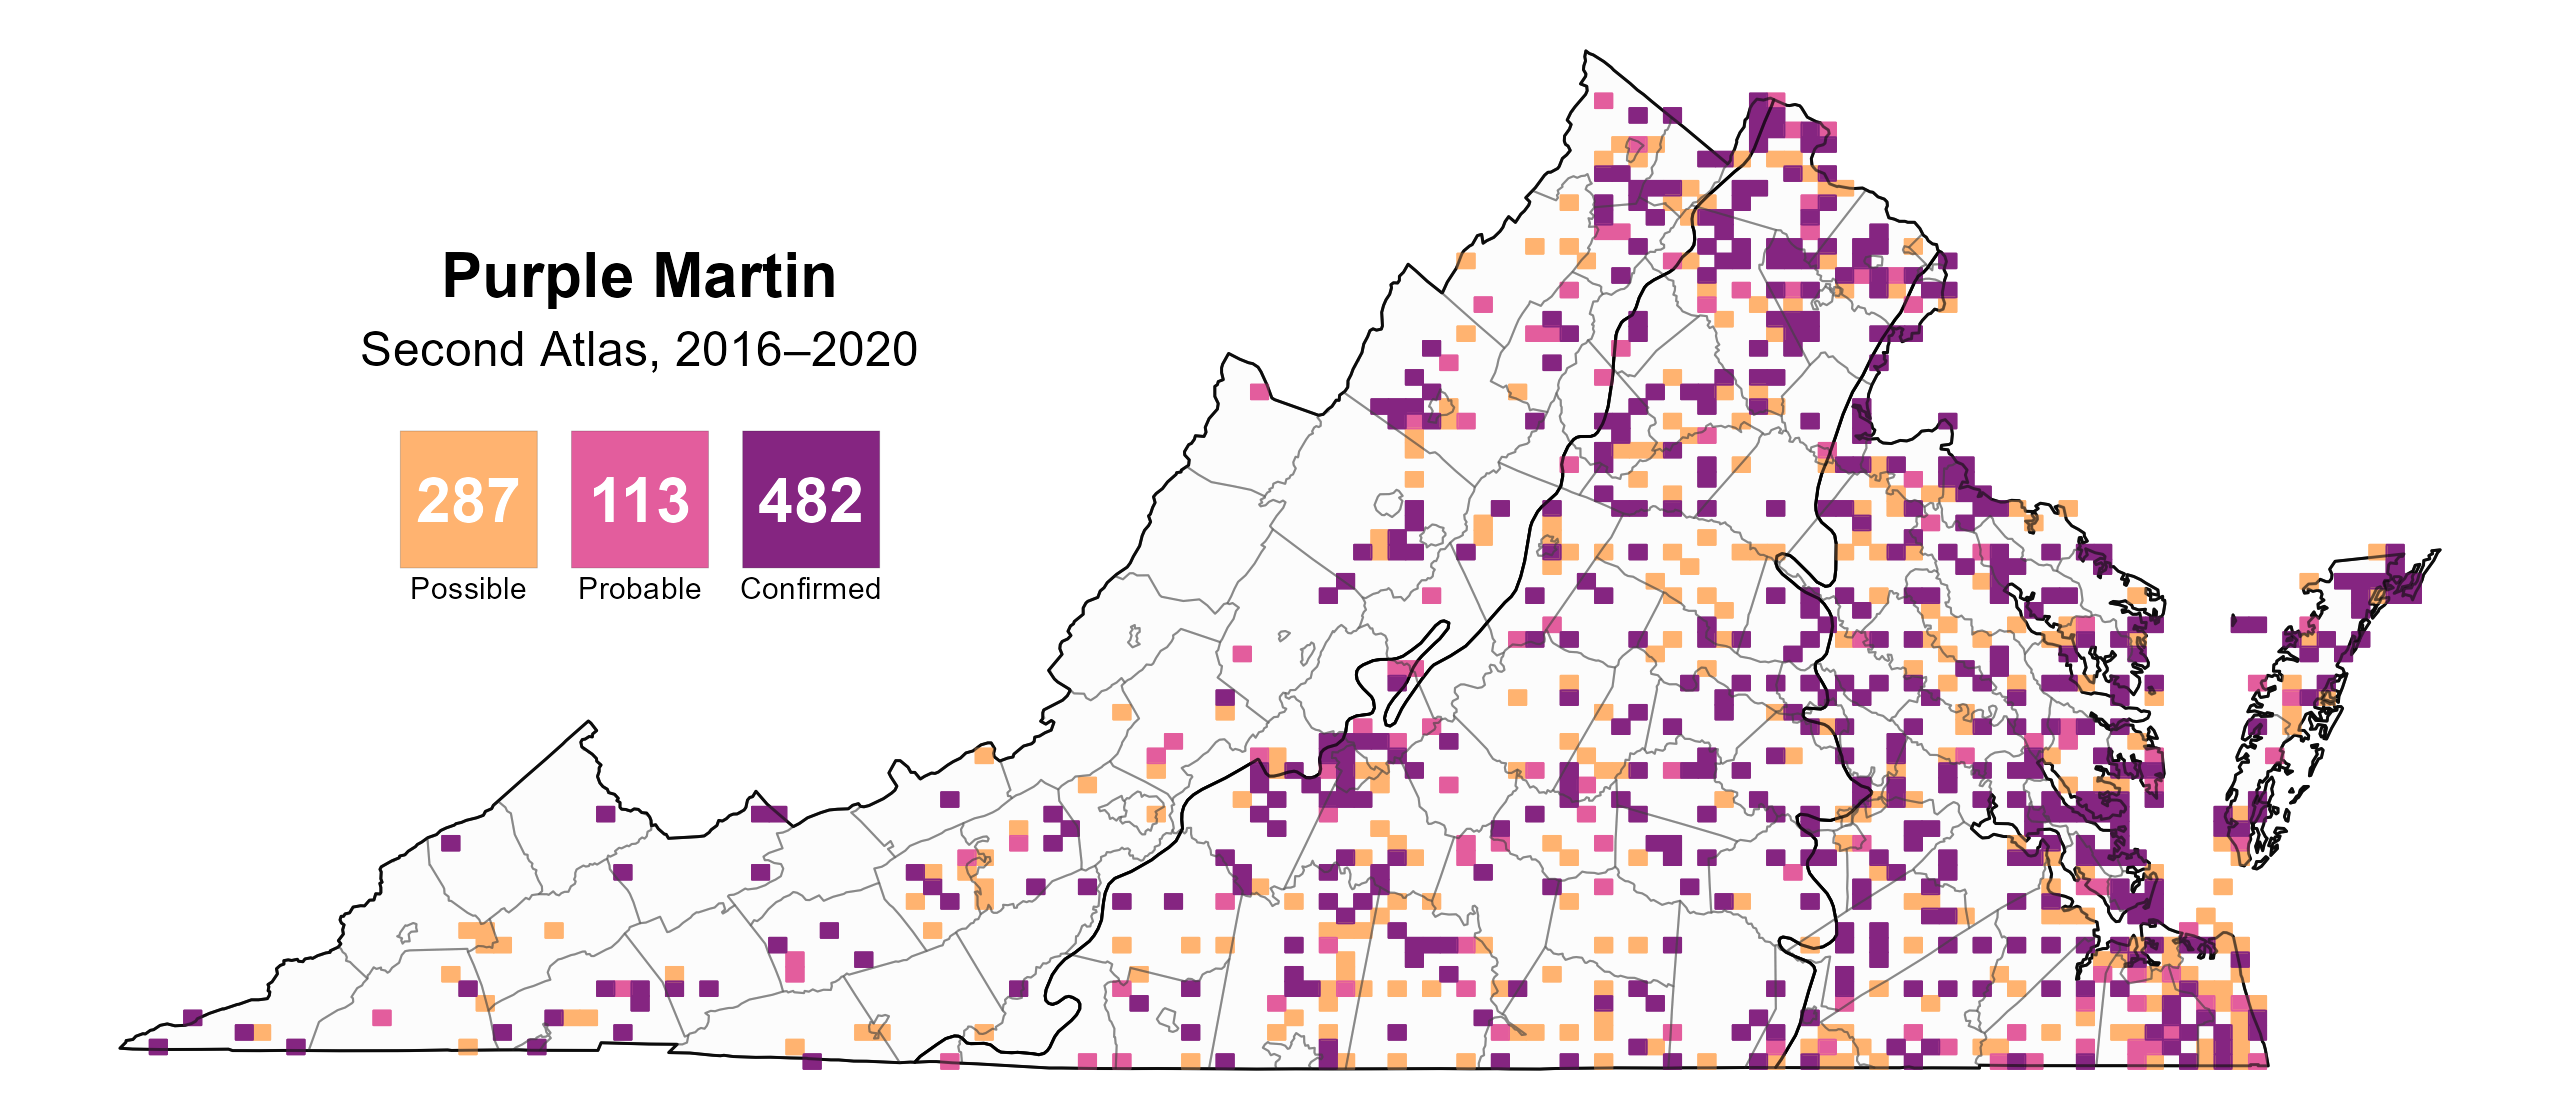
Figure 4: Purple Martin breeding observations from the Second Atlas (2016–2020). The colored boxes illustrate Atlas blocks (approximately 10 mi2 [26 km2] survey units) where the species was detected. The colors show the highest breeding category recorded in a block. The numbers within the colors in the legend correspond to the number of blocks with that breeding evidence category.
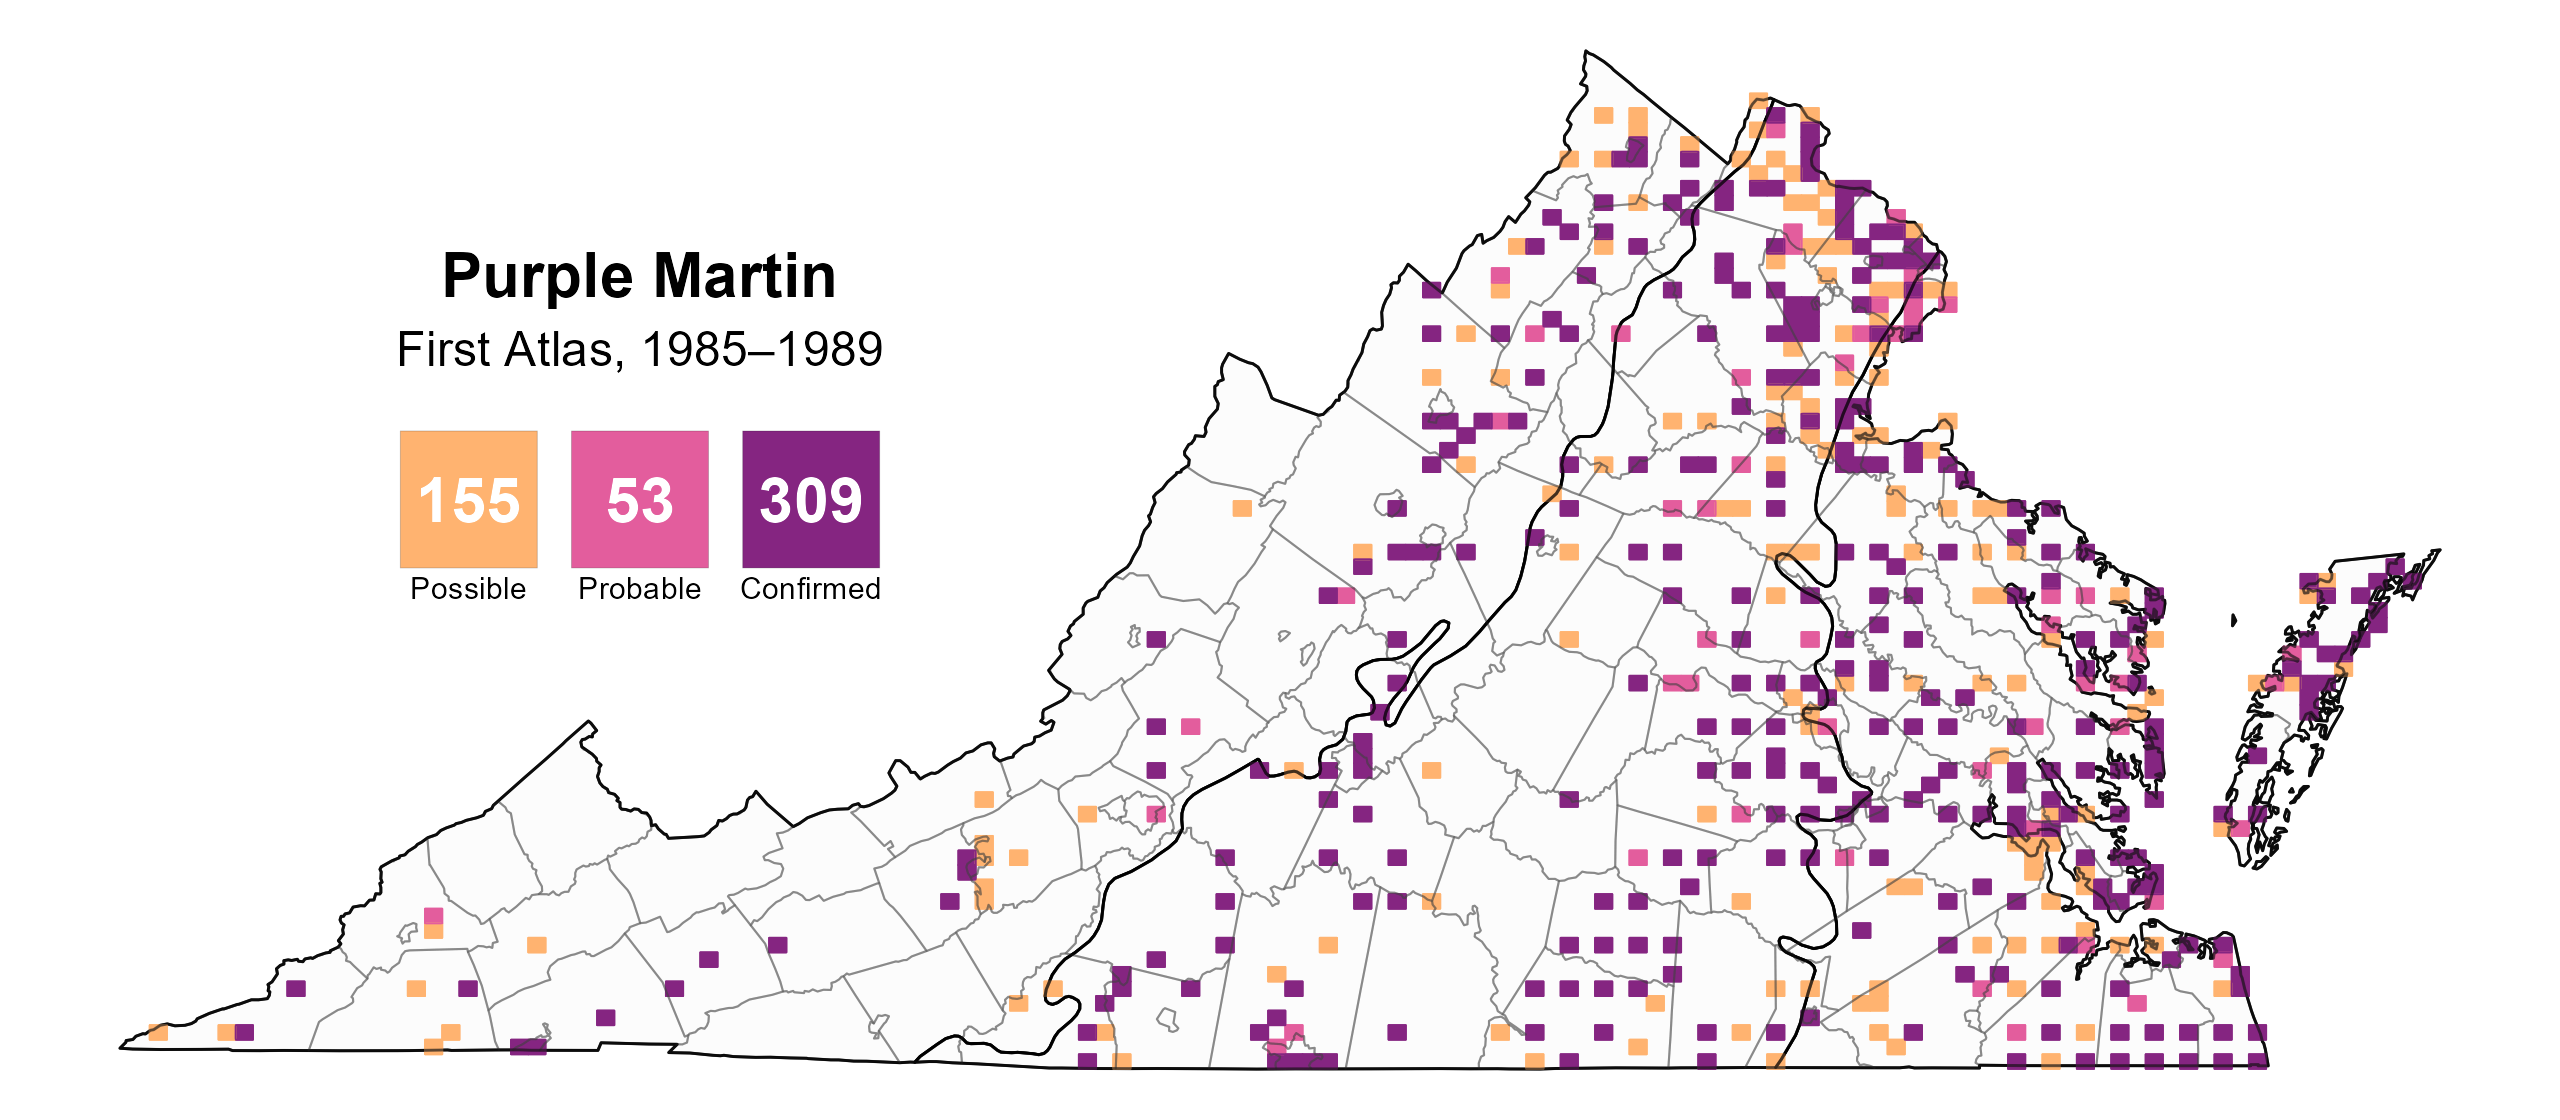
Figure 5: Purple Martin breeding observations from the First Atlas (1985–1989). The colored boxes illustrate Atlas blocks (approximately 10 mi2 [26 km2] survey units) where the species was detected. The colors show the highest breeding category recorded in a block. The numbers within the colors in the legend correspond to the number of blocks with that breeding evidence category.

Figure 6: Purple Martin phenology: confirmed breeding codes. This graph shows a timeline of confirmed breeding behaviors. Tick marks represent individual observations of the behavior.
Population Status
Purple Martin relative abundance was estimated to be highest in the Coastal Plain region, especially the Hampton Roads area (Figure 7). Abundance was moderate to low throughout the Piedmont and Mountains and Valleys regions.
The total estimated Purple Martin population in the state is approximately 64,000 individuals (with a range between 38,000 and 110,000). Based on the North American Breeding Bird Survey (BBS), the Purple Martin population increased by a nonsignificant 0.71% annually from 1966–2022 in Virginia. Between Atlases, Purple Martins decreased by a nonsignificant 0.51% per year from 1987–2018 (Hostetler et al. 2023; Figure 8).

Figure 7: Purple Martin relative abundance (Second Atlas, 2016–2020). This map indicates the predicted abundance of this species at a 0.4 mi2 (1 km2) scale based on environmental (including habitat) factors. Abundance values are presented on a relative scale of low to high.
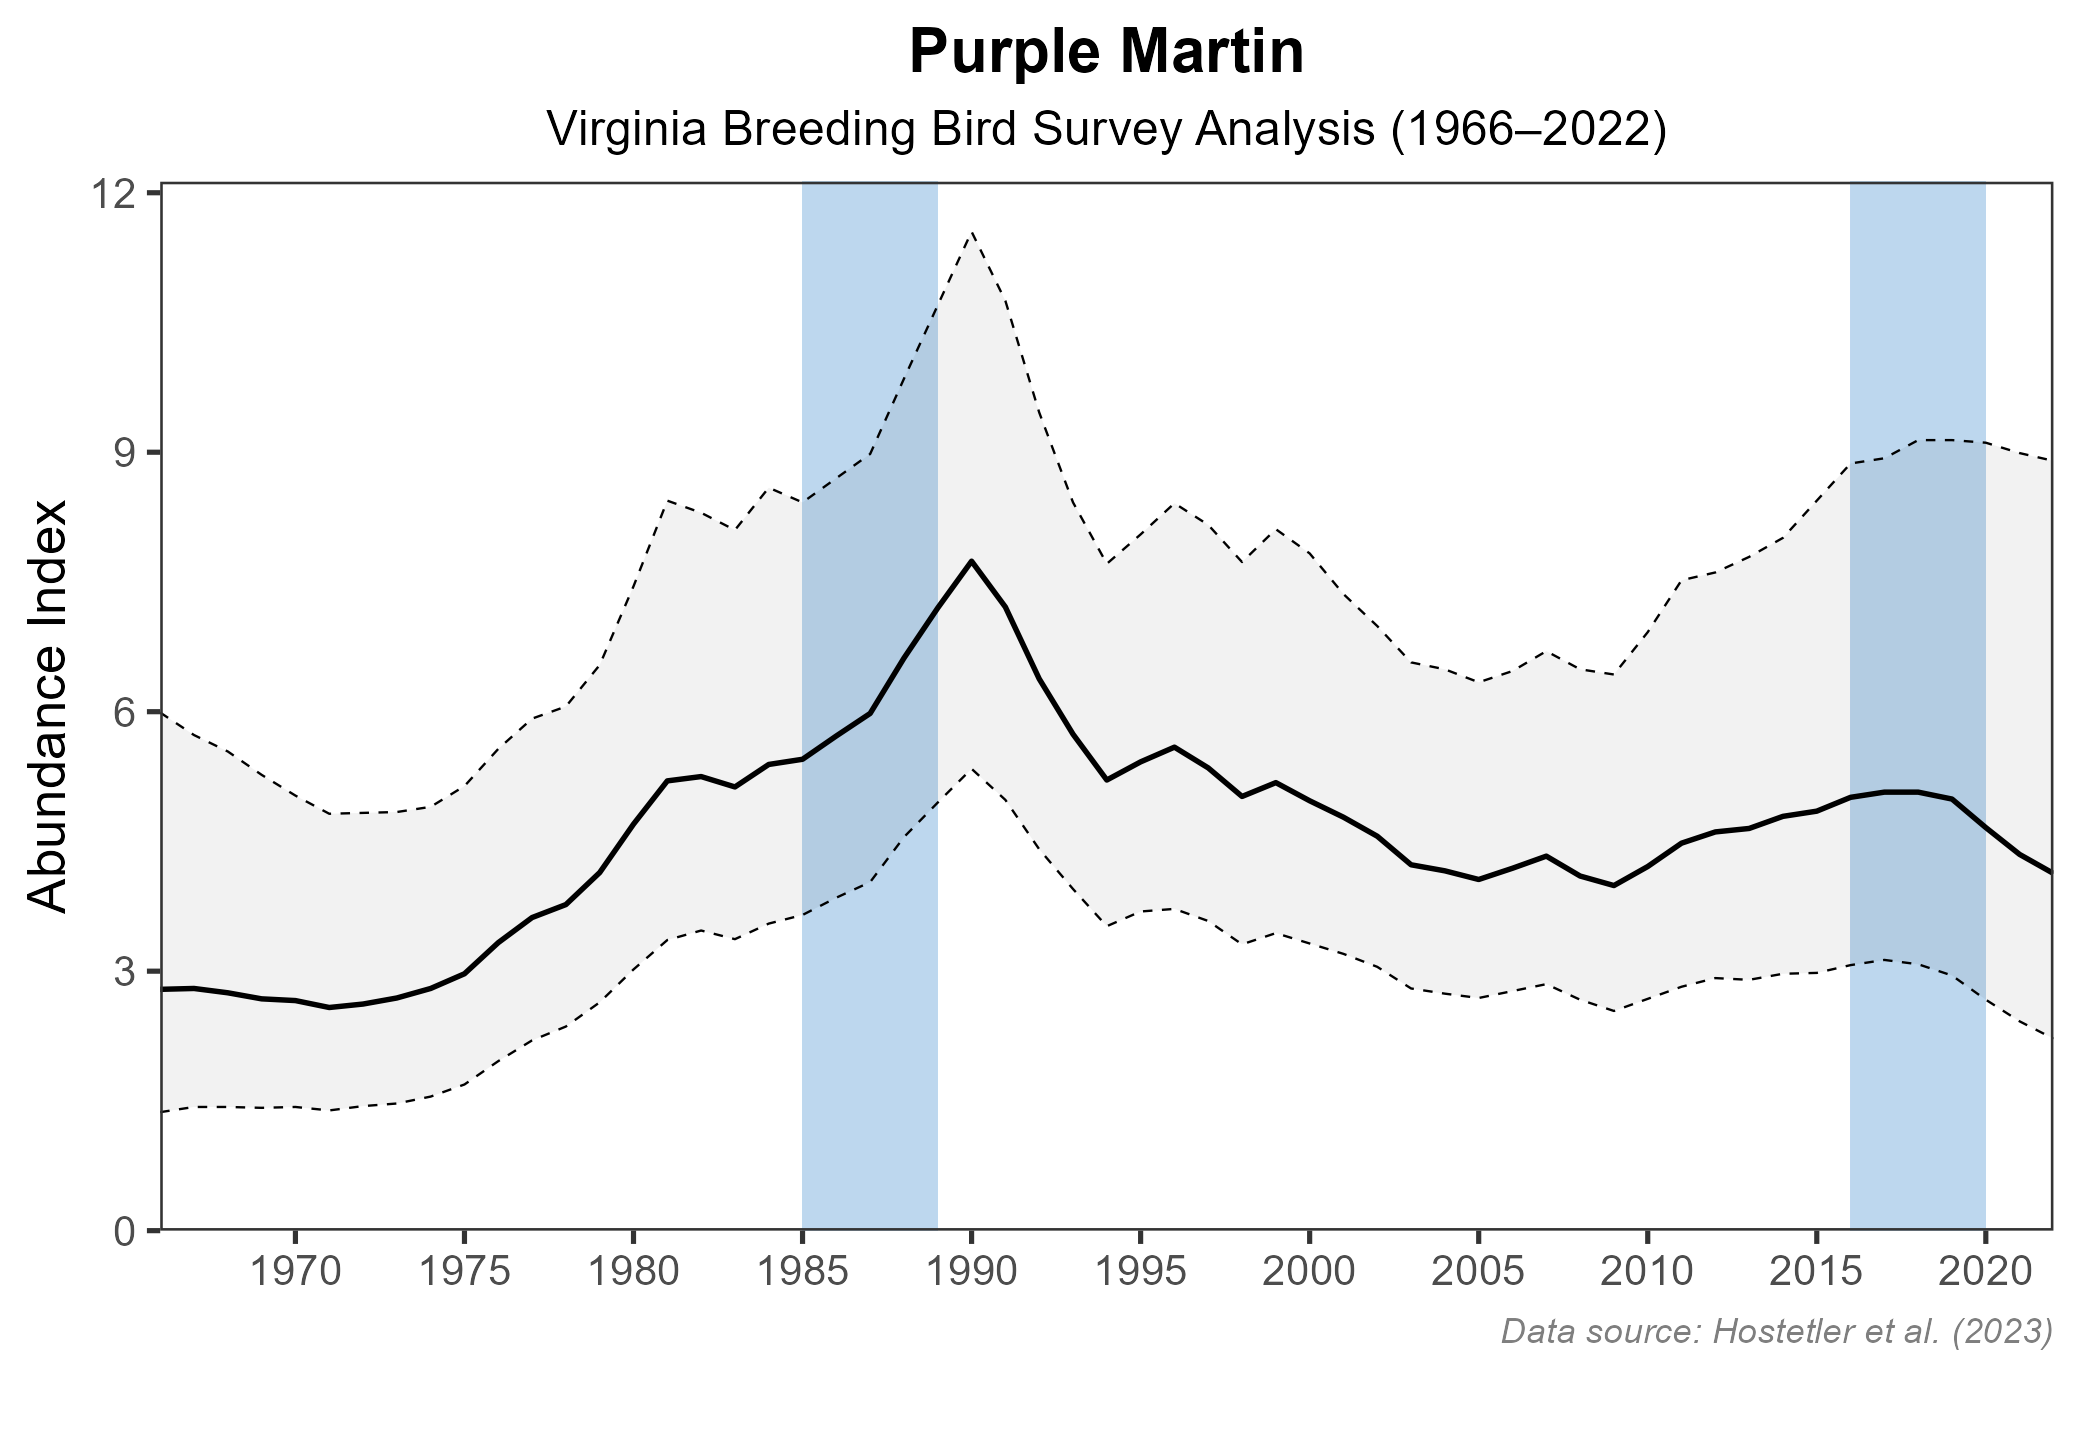
Figure 8: Purple Martin population trend for Virginia as estimated by the North American Breeding Bird Survey. The vertical axis shows species abundance; the horizontal axis shows the year. The solid line indicates the estimated population trend; there is a 97.5% probability that the true population trend falls between the dashed lines. The shaded bars indicate the First and Second Atlas periods.
Conservation
Purple Martins are common and generally stable in Virginia. They are not considered a species of conservation concern. While there are no conservation projects dedicated to Purple Martins underway in Virginia, many people enjoy becoming Purple Martin “landlords,” the name given to those who put up houses and gourds. To learn more about becoming a landlord, visit the the Purple Martin Conservation Association website. Additionally, discouraging or removing House Sparrows (Passer domesticus) and European Starlings (Sturnus vulgaris) from nest boxes is another helpful conservation measure (Brown et al. 2021).
Interactive Map
The interactive map contains up to six Atlas layers (probability of occurrence for the First and Second Atlases, change in probability of occurrence between Atlases, breeding evidence for the First and Second Atlases, and abundance for the Second Atlas) that can be viewed one at a time. To view an Atlas map layer, mouse over the layer box in the upper left. County lines and physiographic regional boundaries (Mountains and Valleys, Piedmont, and Coastal Plain) can be turned on and off by checking or unchecking the box below the layer box. Within the map window, users can hover on a block to see its value for each layer and pan and zoom to see roads, towns, and other features of interest that are visible beneath a selected layer.
View Interactive Map in Full Screen
References
Brown, C. R., D. A. Airola, and S. Tarof (2021). Purple Martin (Progne subis), version 2.0. In Birds of the World (P. G. Rodewald, Editor). Cornell Lab of Ornithology, Ithaca, NY, USA. https://doi.org/10.2173/bow.purmar.02.
Hostetler, J. A., J. R. Sauer, J. E. Hines, D. Ziolkowski, and M. Lutmerding (2023). The North American breeding bird survey, analysis results 1966–2022. U.S. Geological Survey, Laurel, MD, USA. https://doi.org/10.5066/P9SC7T11.