Introduction
Though regal looking and revered by many casual birdwatchers, the Mute Swan is a non-native, invasive species in the state. Mute Swans were introduced to the eastern U. S. in the late 1800s and into Virginia in the late 1900s as decorative waterfowl for private estates and parks (VDWR 2012). A feral population was established by the mid-1960s to early 1970s due to releases by private individuals (Wood et al. 2024; VDWR 2012). This species has substantial negative impacts on wetlands due to their extensive grazing of submerged aquatic vegetation, affecting the breeding habitat of various other waterfowl, wading birds, shore birds, and other aquatic wildlife.
Breeding Distribution
During the Second Breeding Bird Atlas, there were too few breeding observations to develop distribution models for the Mute Swan. Please see the Breeding Evidence section for more information on its breeding distribution.
Breeding Evidence
Mute Swans were confirmed breeders in 15 blocks and 13 counties and found to be probable breeders in two additional counties (Mathews and Accomack) (Figure 1). Breeding was confirmed in isolated locations, such as Lake Lanier, the city of Martinsville, and somewhat more consistently along the waterways of the Coastal Plain. During the First Atlas, there was only one documented breeding confirmation in Accomack County (Figure 2).
Breeding was first confirmed when nest building was observed on March 22 (Figure 3). Occupied nests were observed from late March though late May, and recently fledged young were documented from mid-May through early August.
For more general information on the breeding habits of this species, please refer to All About Birds.
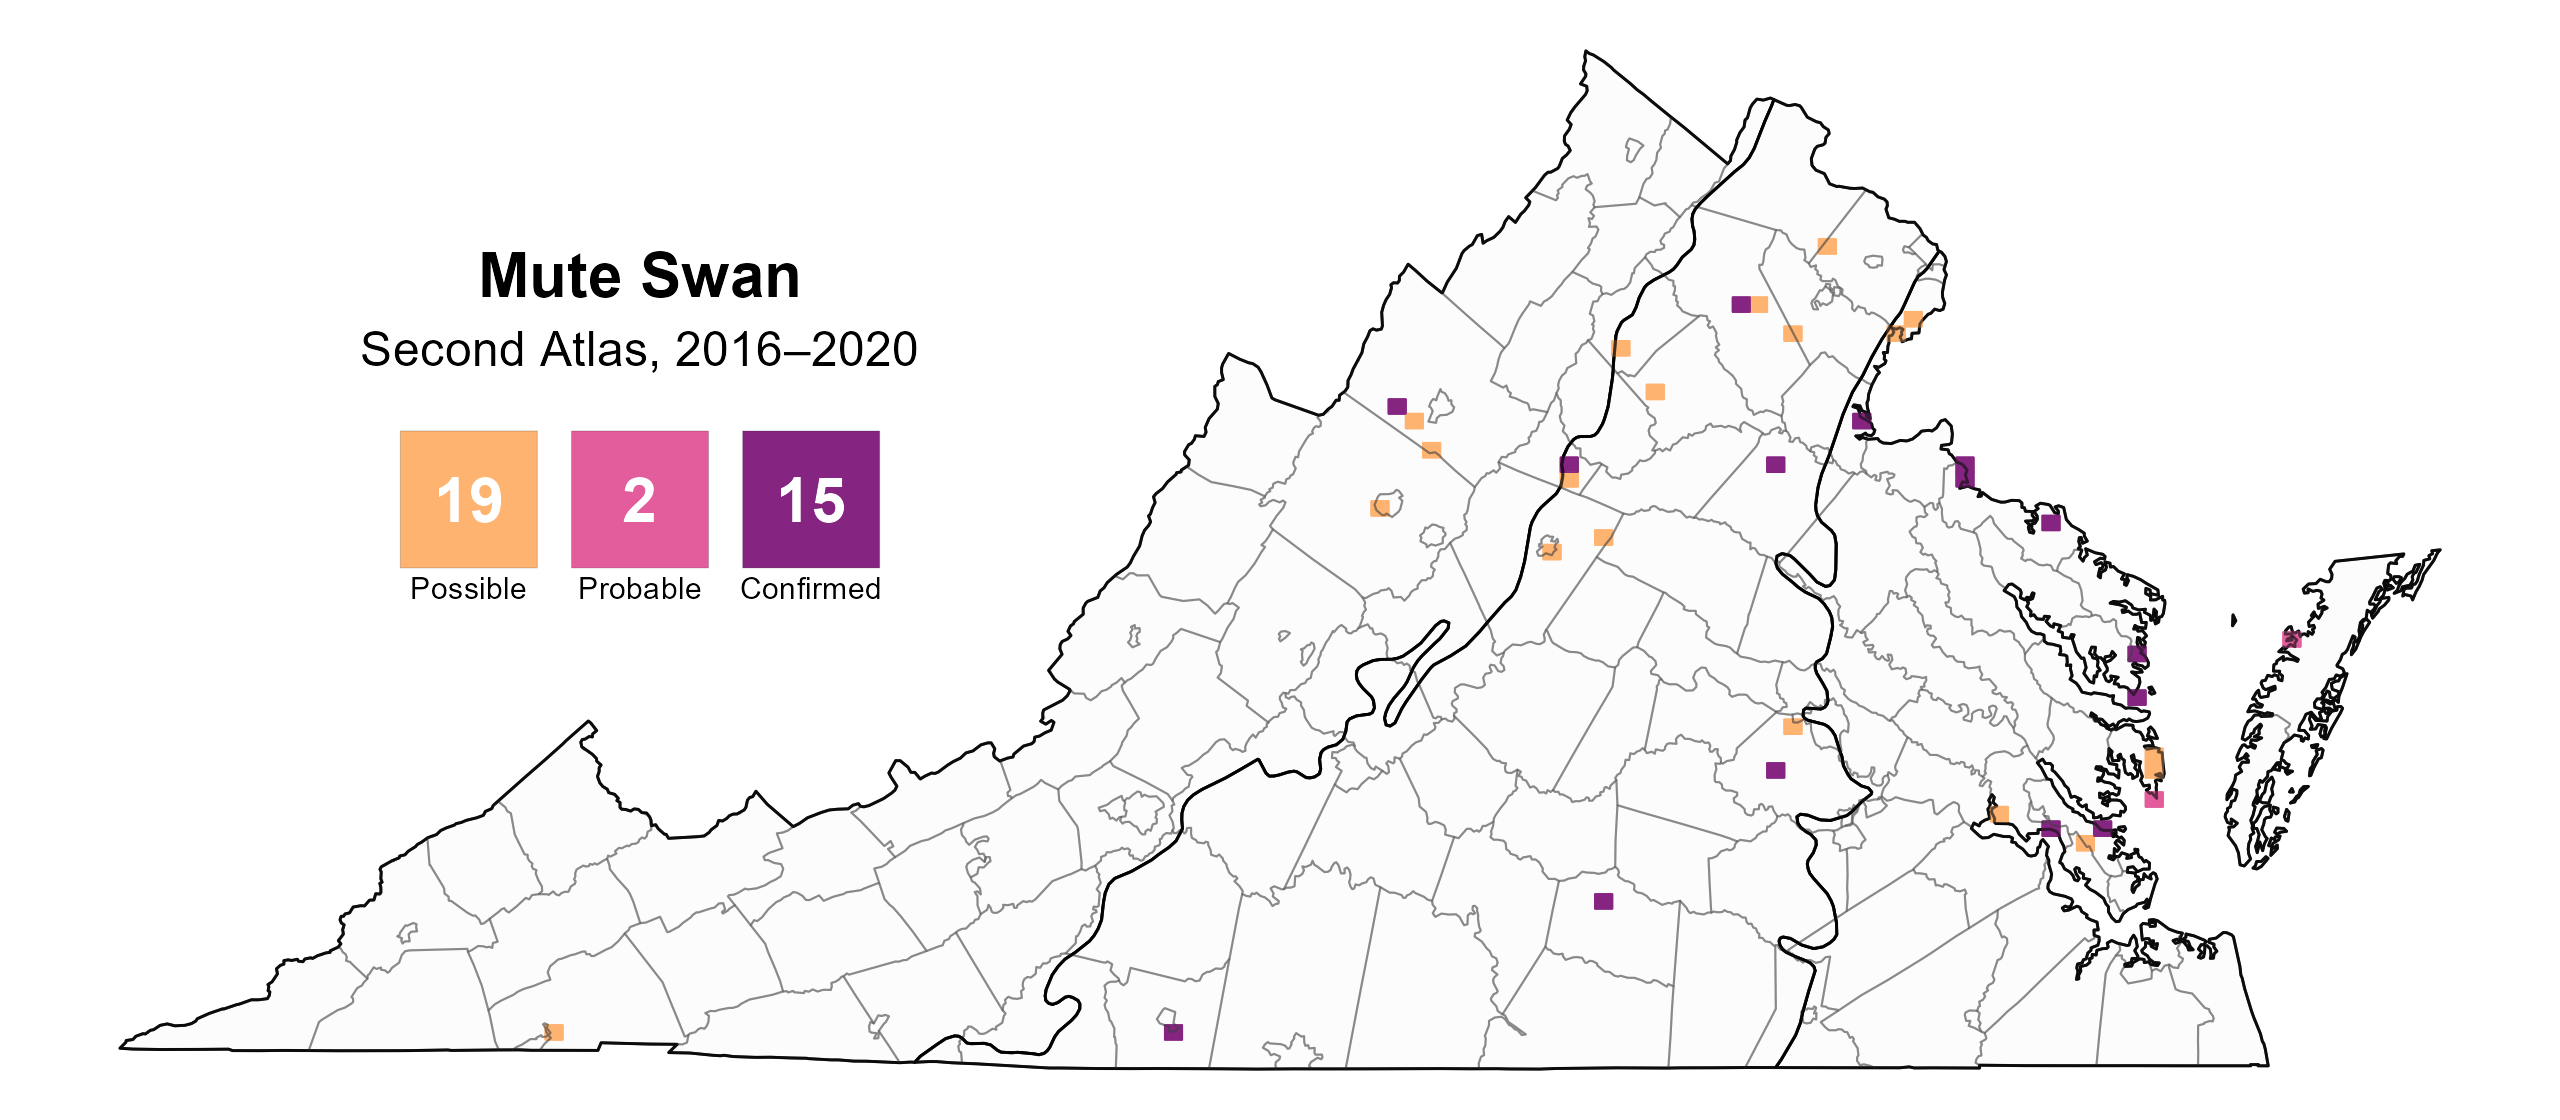
Figure 1: Mute Swan breeding observations from the Second Atlas (2016–2020). The colored boxes illustrate Atlas blocks (approximately 10 mi2 [26 km2] survey units) where the species was detected. The colors show the highest breeding category recorded in a block. The numbers within the colors in the legend correspond to the number of blocks with that breeding evidence category.
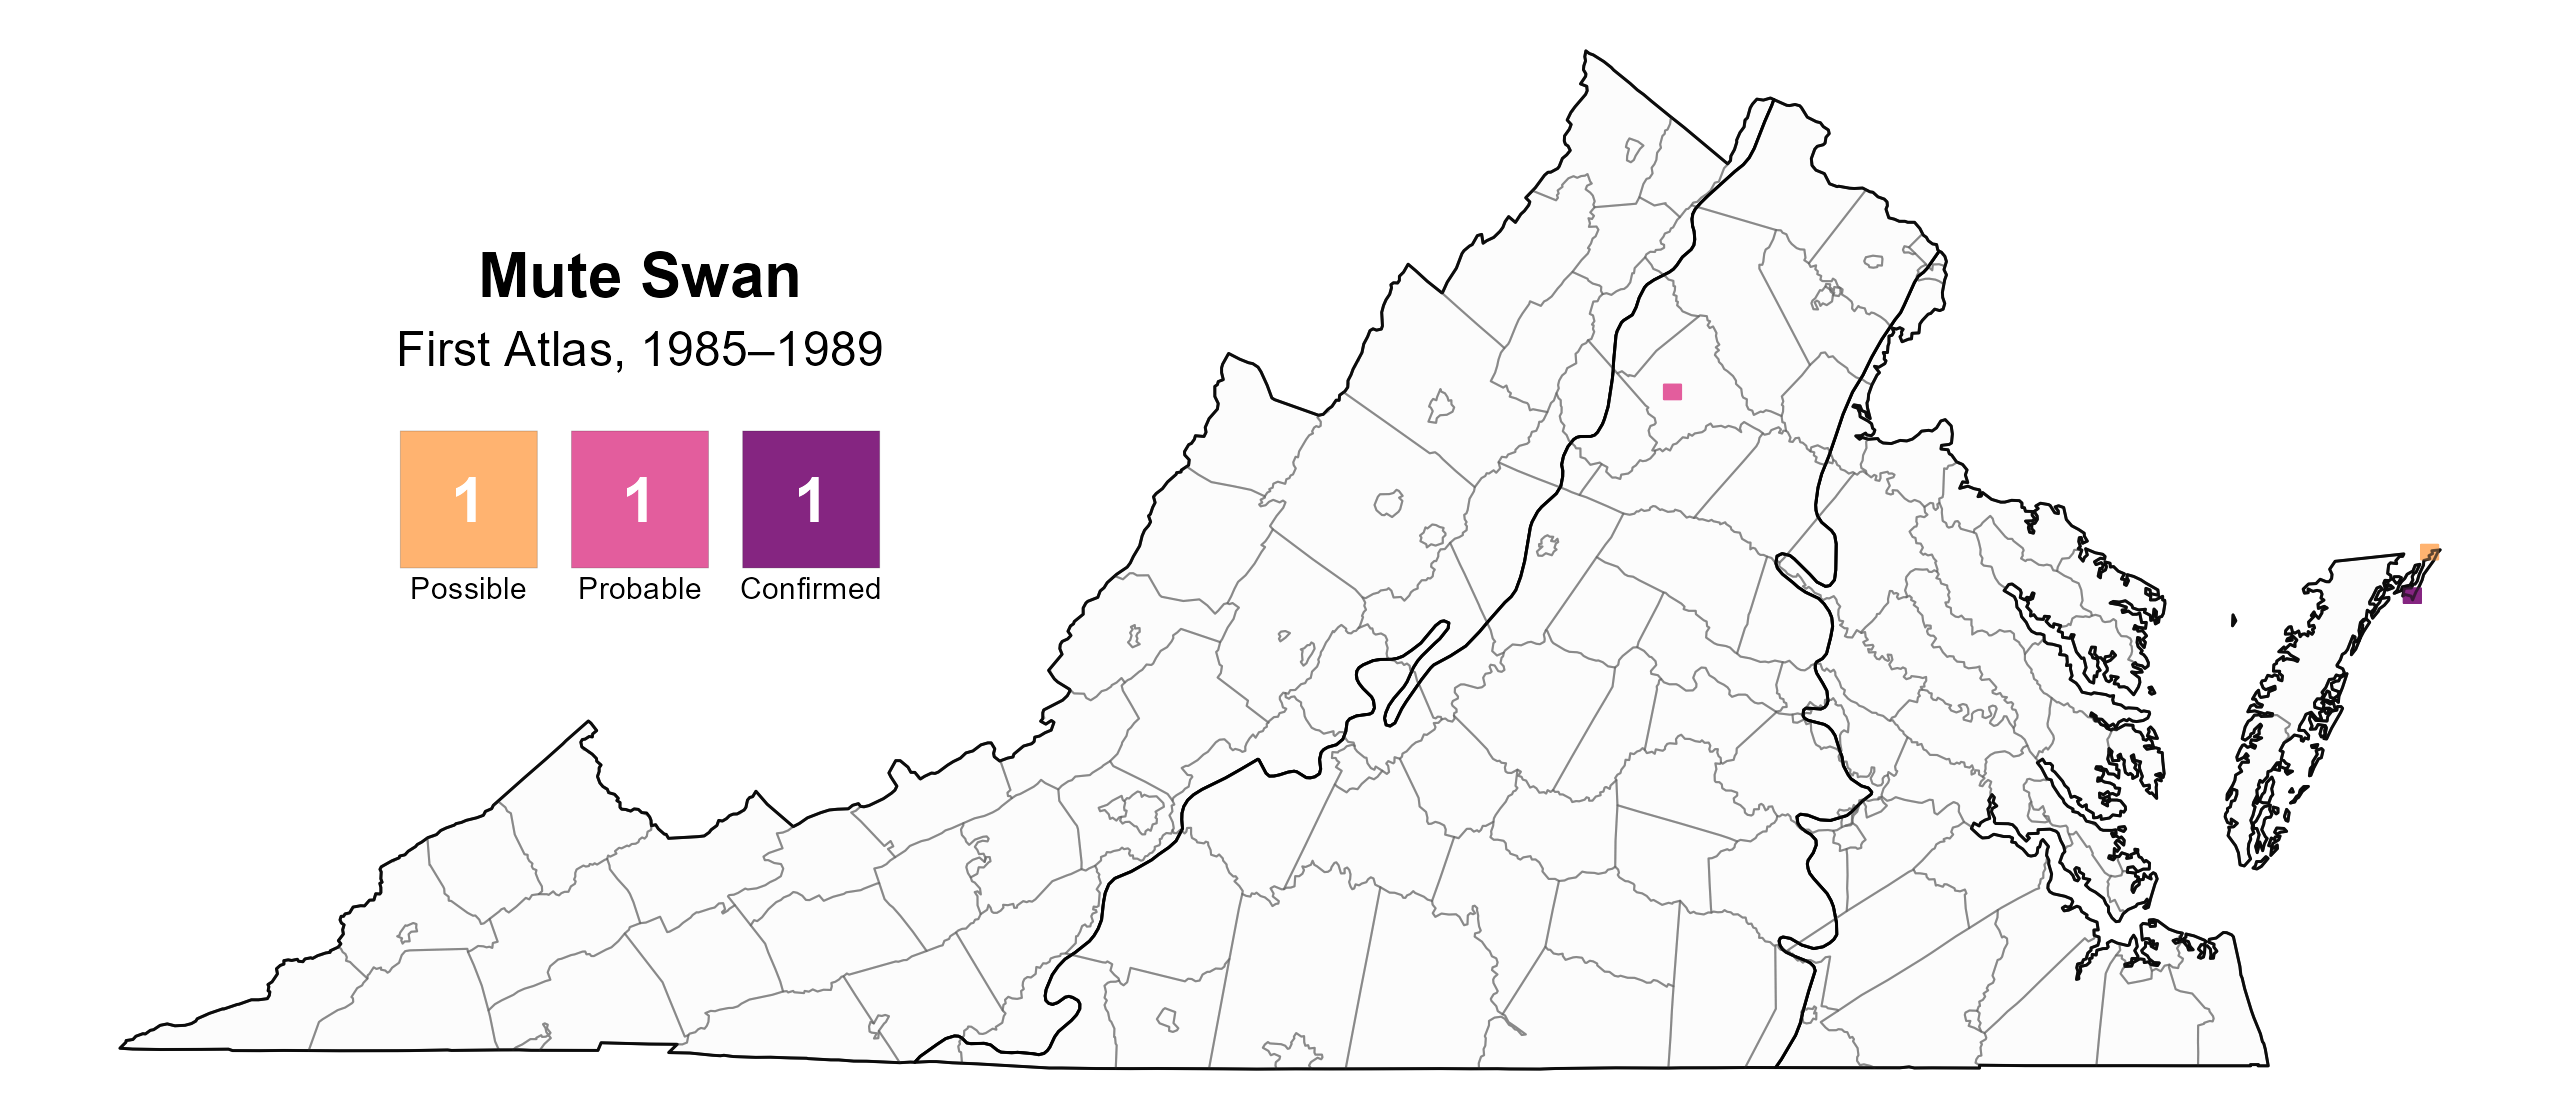
Figure 2: Mute Swan breeding observations from the First Atlas (1985–1989). The colored boxes illustrate Atlas blocks (approximately 10 mi2 [26 km2] survey units) where the species was detected. The colors show the highest breeding category recorded in a block. The numbers within the colors in the legend correspond to the number of blocks with that breeding evidence category.
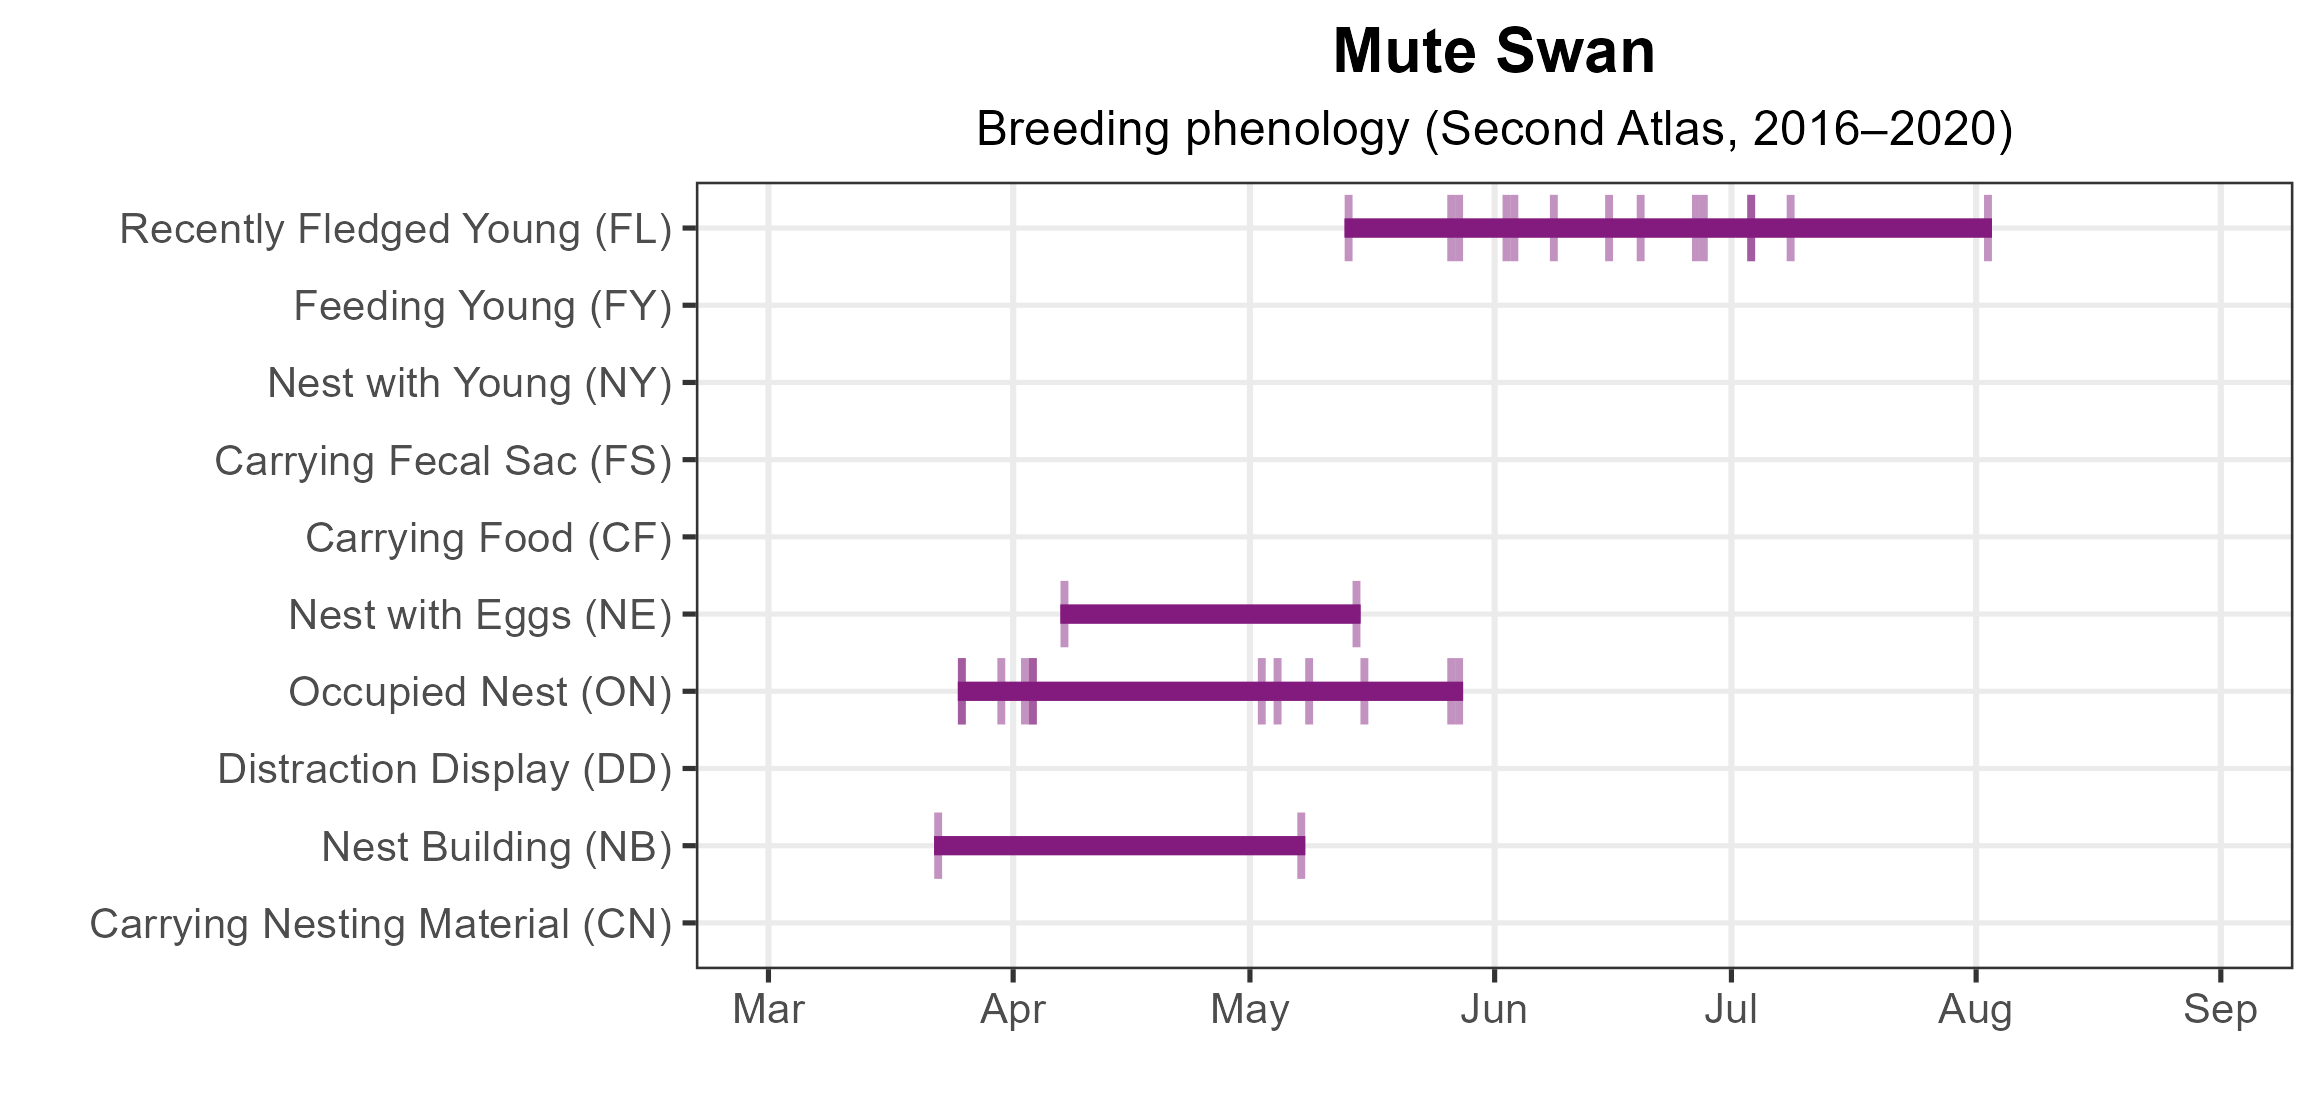
Figure 3: Mute Swan phenology: confirmed breeding codes. This graph shows a timeline of confirmed breeding behaviors. Tick marks represent individual observations of the behavior.
Population Status
No abundance models were produced for Mute Swan as they were not detected during the point count surveys. Similarly, this species is not readily detected by the North American Breeding Bird Survey, which relies on roadside counts, so no estimates of population trends are available.
Conservation
As a non-native, invasive species that displaces other wildlife and causes widespread environmental damage, the Mute Swan is intensely managed by numerous state agencies. In Maryland, a population of more than 4,000 birds has been reduced to a few hundred in recent decades (Allen and Strain 2013). In 2012, the Virginia Department of Wildlife Resources established a Mute Swan management plan designed, in part, to 1) minimize Mute Swan impacts to Virginia’s native wildlife, important habitats, and local economies and 2) reduce conflicts with humans (VDWR 2012). Mute swan control efforts such as removal of nests and adult birds are conducted in areas where mute swans are impacting habitats or causing conflicts.
Interactive Map
The interactive map contains up to six Atlas layers (probability of occurrence for the First and Second Atlases, change in probability of occurrence between Atlases, breeding evidence for the First and Second Atlases, and abundance for the Second Atlas) that can be viewed one at a time. To view an Atlas map layer, mouse over the layer box in the upper left. County lines and physiographic regional boundaries (Mountains and Valleys, Piedmont, and Coastal Plain) can be turned on and off by checking or unchecking the box below the layer box. Within the map window, users can hover on a block to see its value for each layer and pan and zoom to see roads, towns, and other features of interest that are visible beneath a selected layer.
View Interactive Map in Full Screen
References
Allen, J. and D. Strain (2013). Aquatic invasive species in the Chesapeake Bay: Mute Swans. Publication UM‐SG‐PI‐2013‐01. Maryland Sea Grant. College Park, MD, USA. https://www.mdsg.umd.edu/sites/default/files/files/Mute%20swans_AIS%20brief_PI-2013-01.pdf.
Virginia Department of Wildlife Resources (VDWR) (2012). Mute Swan management plan. Henrico, VA, USA. https://dwr.virginia.gov/wp-content/uploads/virginia-mute-swan-management-plan.pdf.
Wood, K. A., S. G. Mlodinow, M. A. Ciaranca, C. C. Allin, and G. S. Jones (2024). Mute Swan (Cygnus olor), version 2.0. In Birds of the World (G. M. Kirwan and B. K. Keeney, Editors). Cornell Lab of Ornithology, Ithaca, NY, USA. https://doi.org/10.2173/bow.mutswa.02.