Introduction
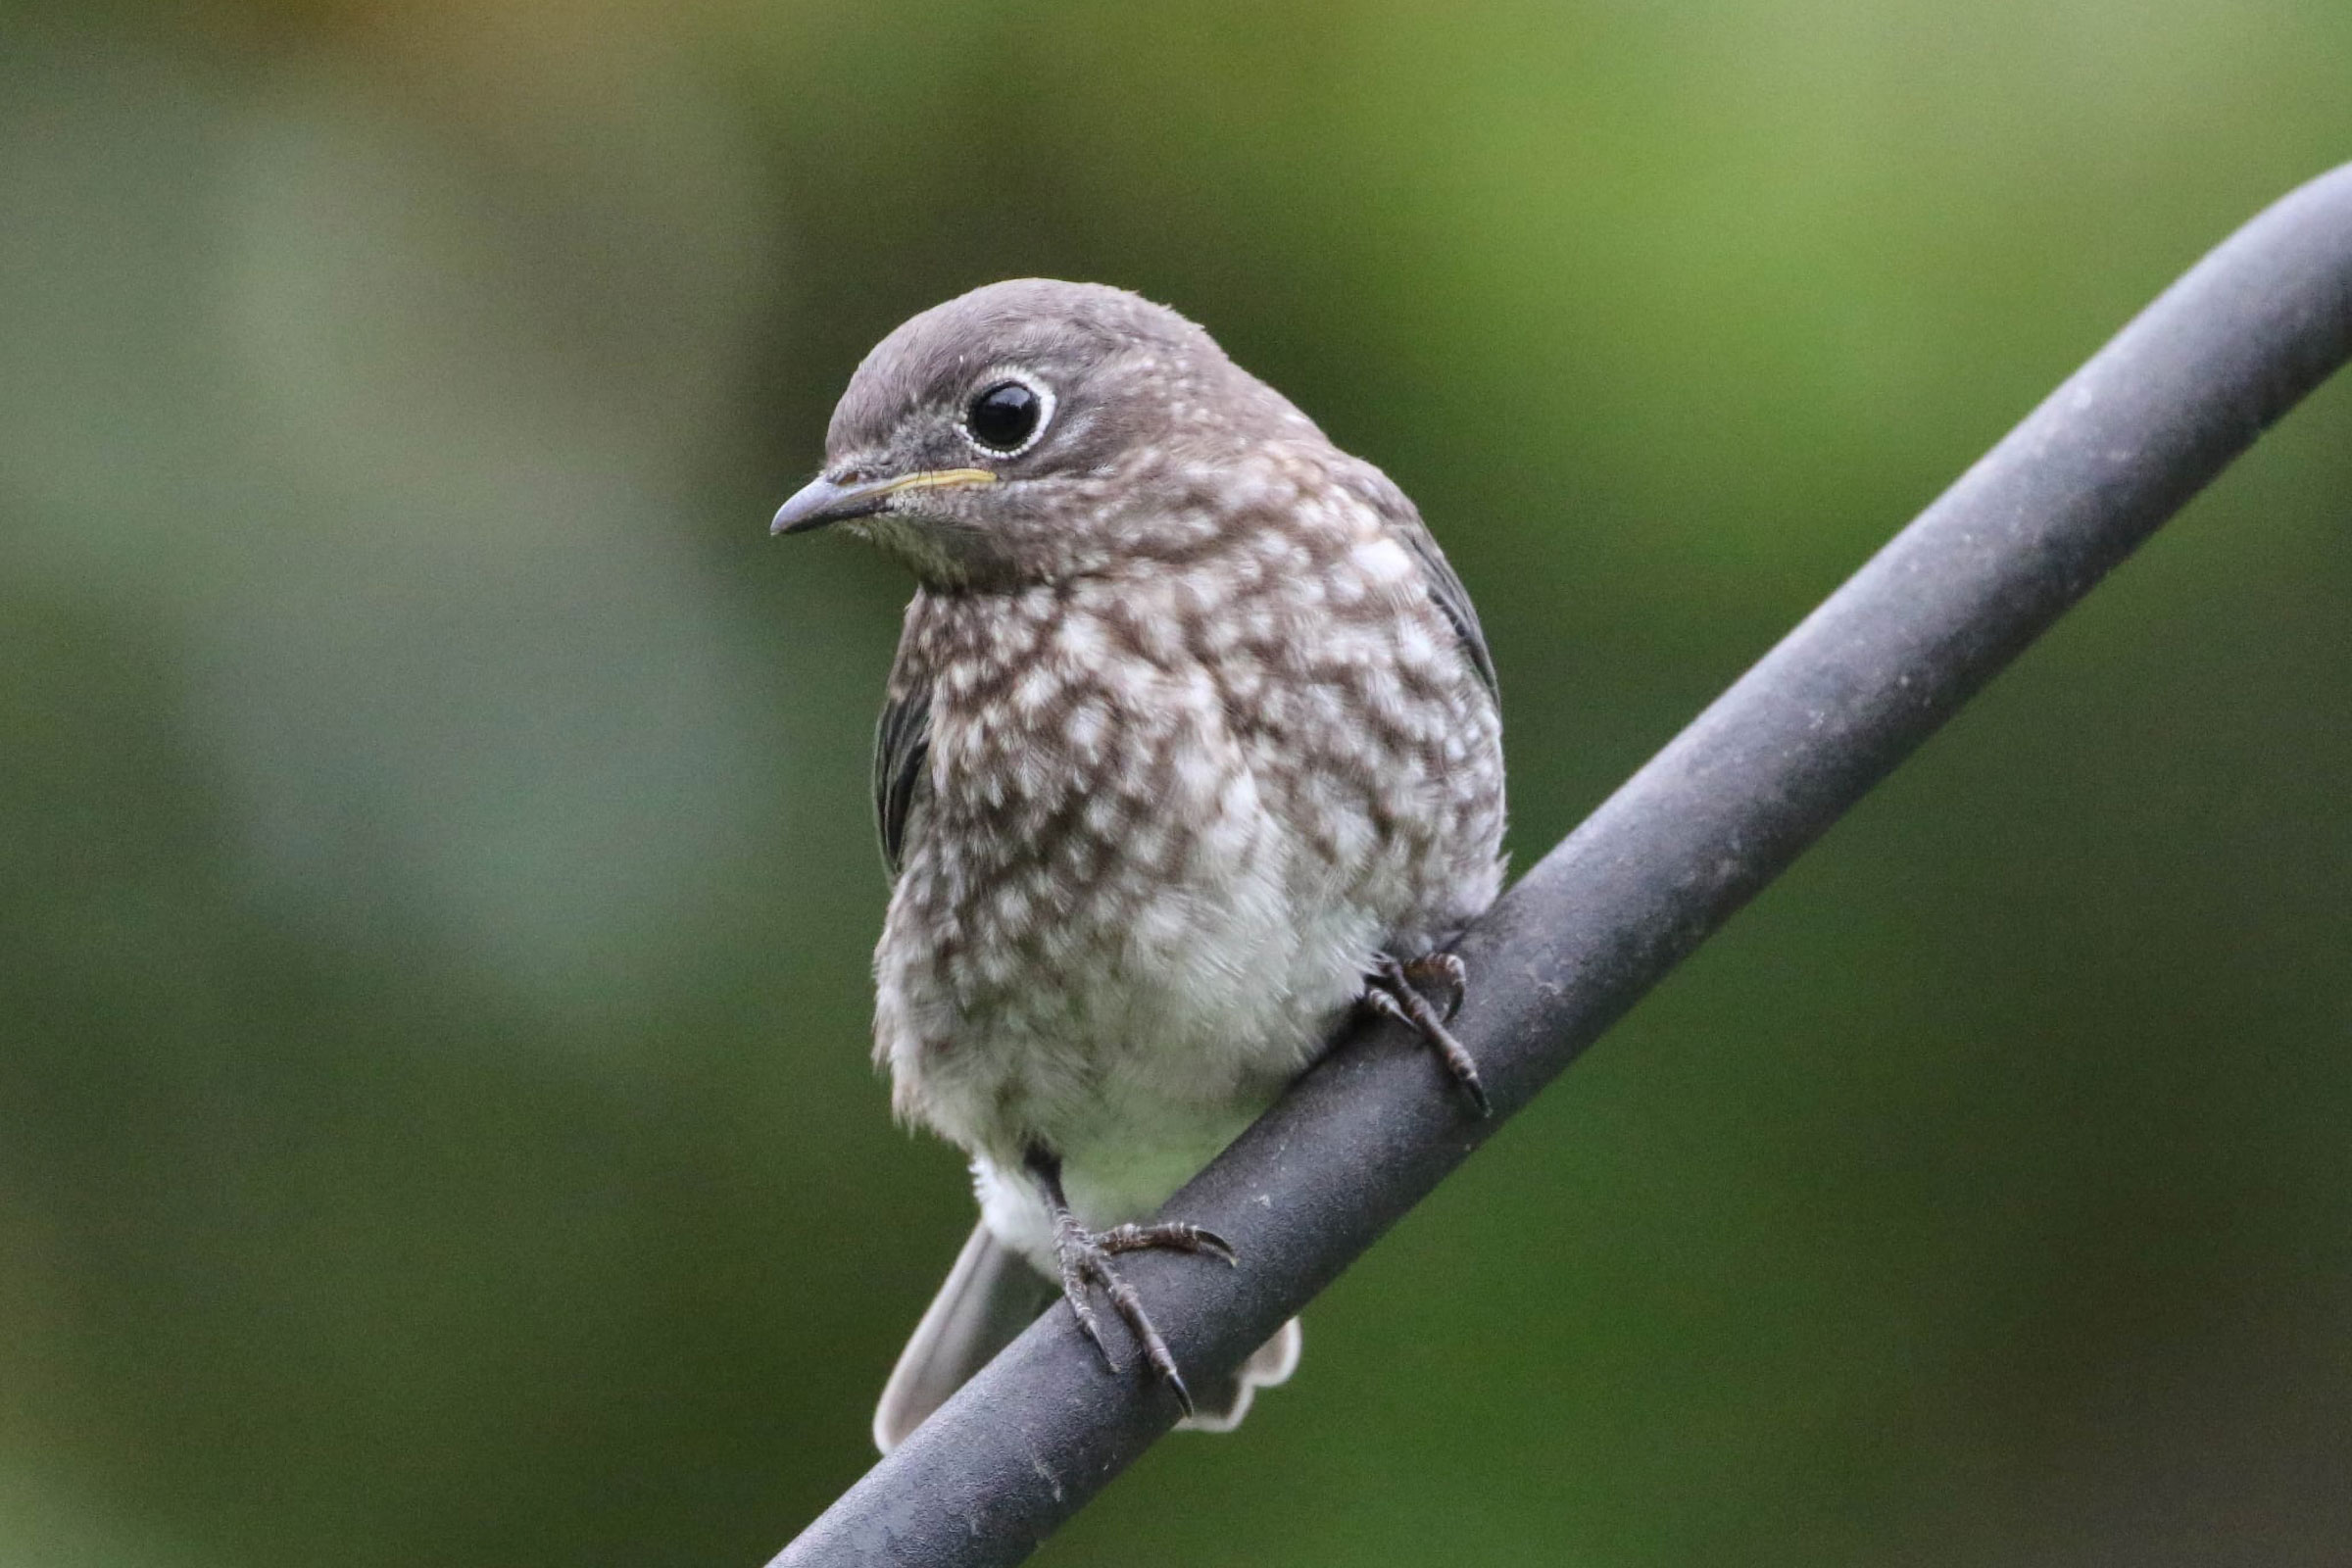
The Eastern Bluebird is a cavity nester, and in Virginia and most other eastern states, it is the most sought-after species when seeking to attract birds to nest boxes. Bluebird boxes are installed by homeowners and conservation groups in backyards, farmland, parks of all kinds, and even golf courses (Jackson et al. 2013). The enthusiasm is worth it. Male Eastern Bluebirds sport gorgeous, brilliant-blue backs and heads with red-brown underparts, and females are an elegant grey with heavy tinges of blue (Gowaty and Plissner 2020).
Breeding Distribution
Eastern Bluebirds are found throughout the state, except in areas with extensive forests in the Mountains and Valleys region and in open marshes of the outer Coastal Plain, the Eastern Shore, and the Great Dismal Swamp (Figure 1). Their likelihood of occurrence is not associated with any one environmental variable because Eastern Blue birds have high occupancy across most of the state.
Between the First and Second Atlases (Figures 1 and 2), Eastern Bluebird’s likelihood of occurrence remained consistently high over most of the state, except for a notable increase in occurrence in the Hampton Roads-Virginia Beach area (Figures 3). Additionally, there were areas of increase near the cities of Alexandria and Richmond.
View Environmental Associations
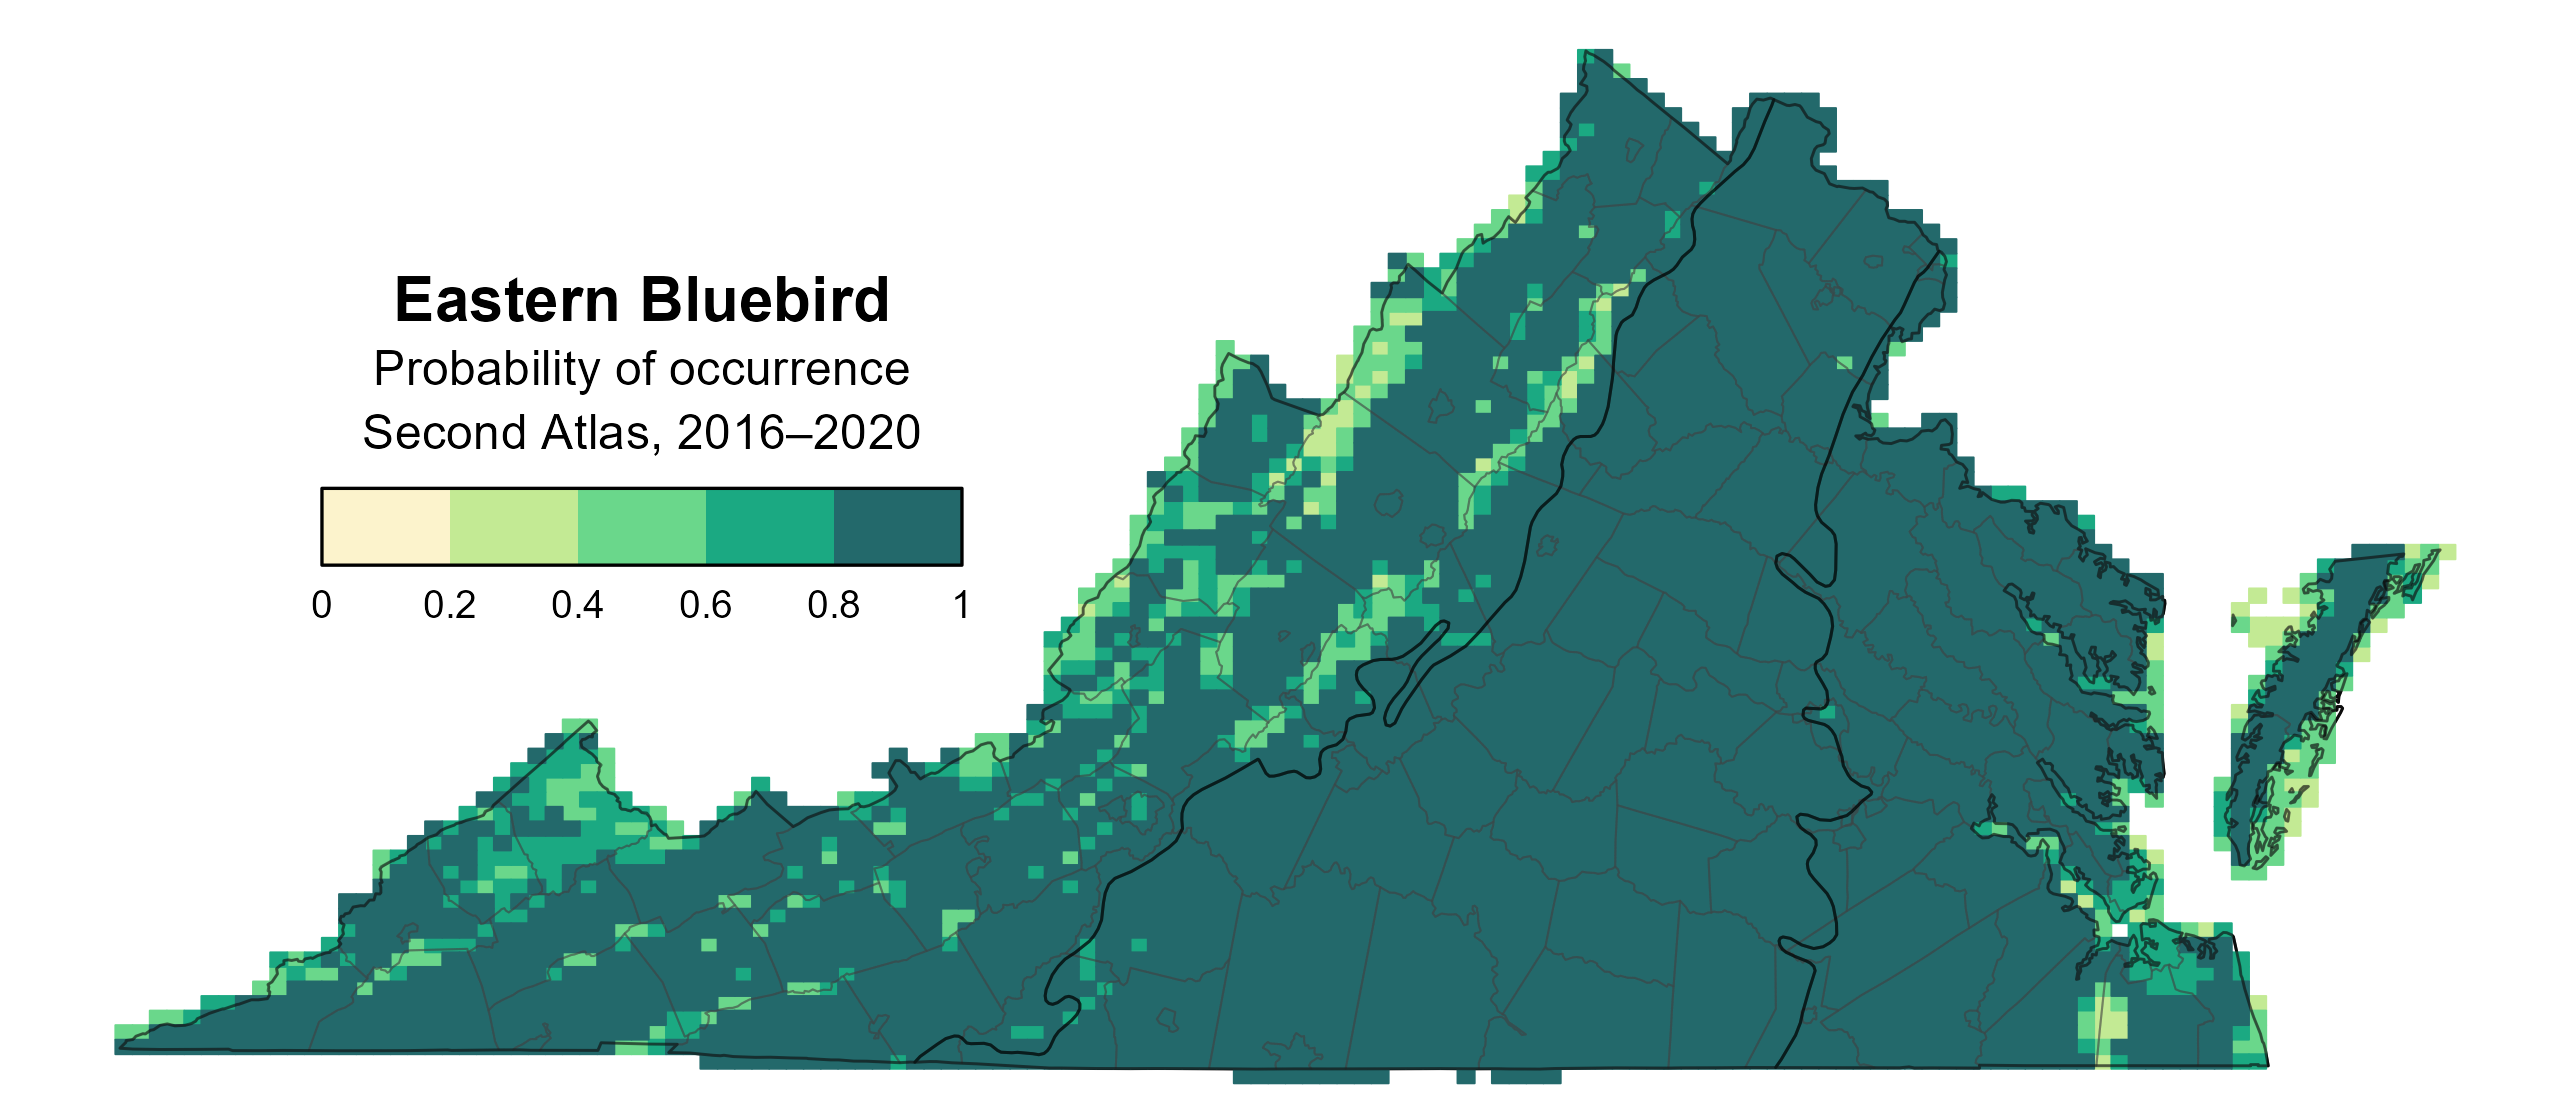
Figure 1: Eastern Bluebird breeding distribution based on probability of occurrence (Second Atlas, 2016–2020). This map indicates the probability that this species will occur in an Atlas block (an approximately 10 mi2 [26 km2] survey unit) based on environmental (including habitat) factors and after adjusting for the probability of detection (variation in survey effort among blocks).
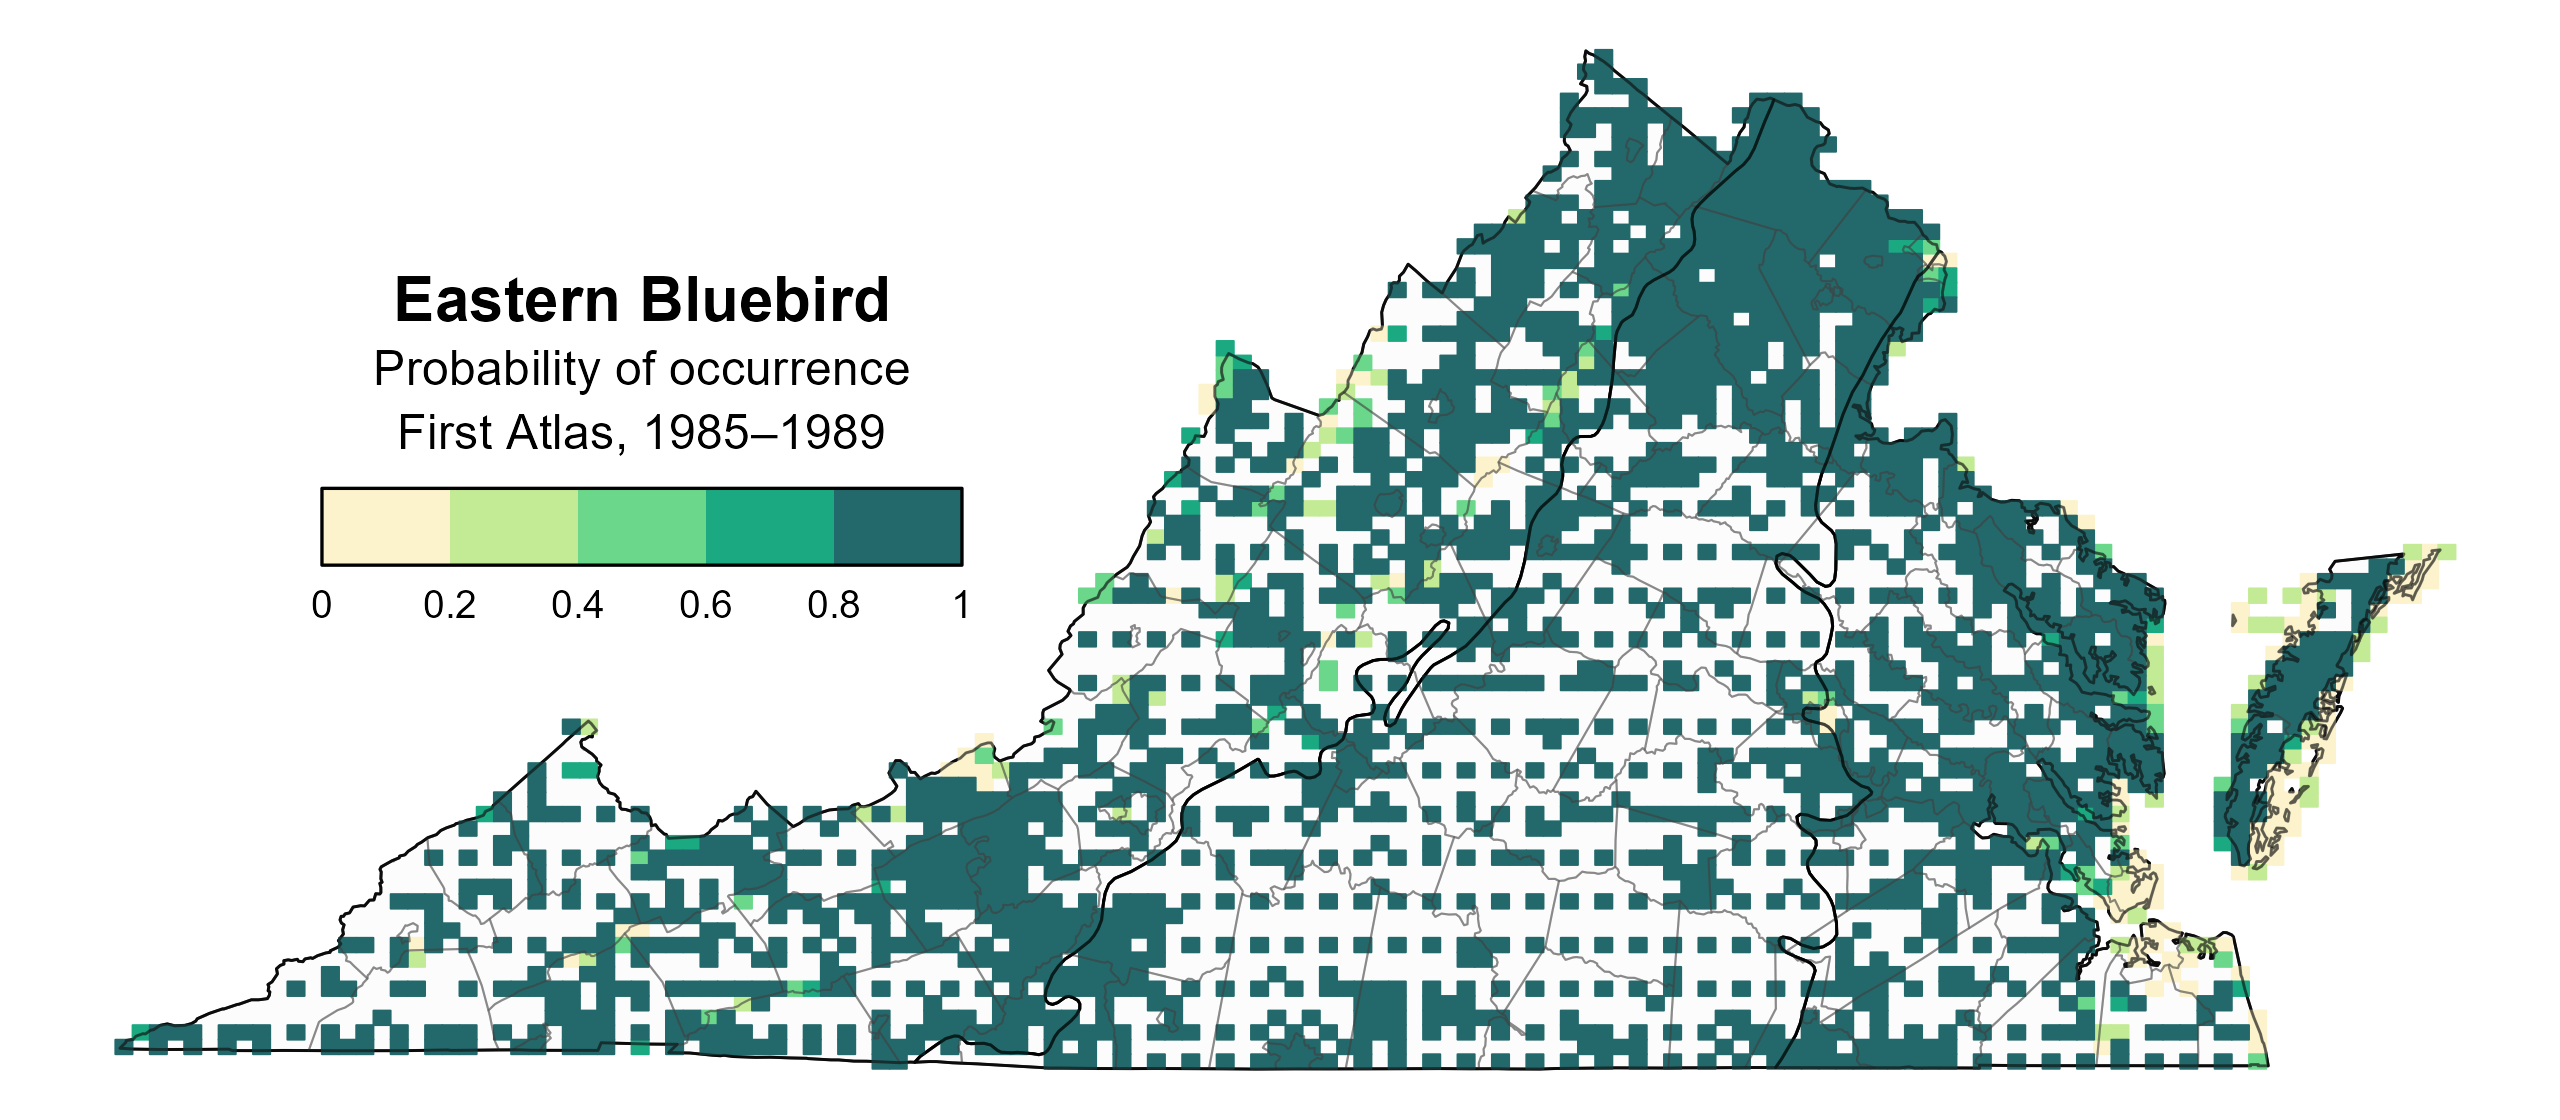
Figure 2: Eastern Bluebird breeding distribution based on probability of occurrence (First Atlas, 1985–1989). This map indicates the probability that this species will occur in an Atlas block (an approximately 10 mi2 [26 km2] survey unit) based on environmental (including habitat) factors and after adjusting for the probability of detection (variation in survey effort among blocks). Blocks in white were not surveyed during the First Atlas and were not modeled.

Figure 3: Eastern Bluebird change in breeding distribution between Atlases (1985–1989 and 2016–2020) based on probability of occurrence. This map indicates the change in the probability that this species will occur in a block (an approximately 10 mi2 [26 km2] survey unit) between Atlas periods. Blocks with no change (tan) may have constant presence or constant absence. Blocks in white were not surveyed during the First Atlas and were not modeled.
Breeding Evidence
Eastern Bluebirds were confirmed breeders in 1,602 blocks and 122 counties and probable breeders in four additional counties (Figure 4). Although breeding was confirmed generally throughout the state, some clusters of breeding confirmations occurred around urban areas, likely due to volunteers being easily able to observe this species in a variety of habitats. Breeding was confirmed across the state during the First Atlas as well (Figure 5).
The earliest confirmed breeding behavior was documented in early February when nests with eggs were observed. However, breeding was confirmed primarily through observations of occupied nests (February 27 – August 26), adults carrying food (March 30 – August 17), nests with young (March 12 – September 5), and recently fledged young (April 15 – September 12) (Figure 6).
For more general information on the breeding habits of this species, please refer to All About Birds.
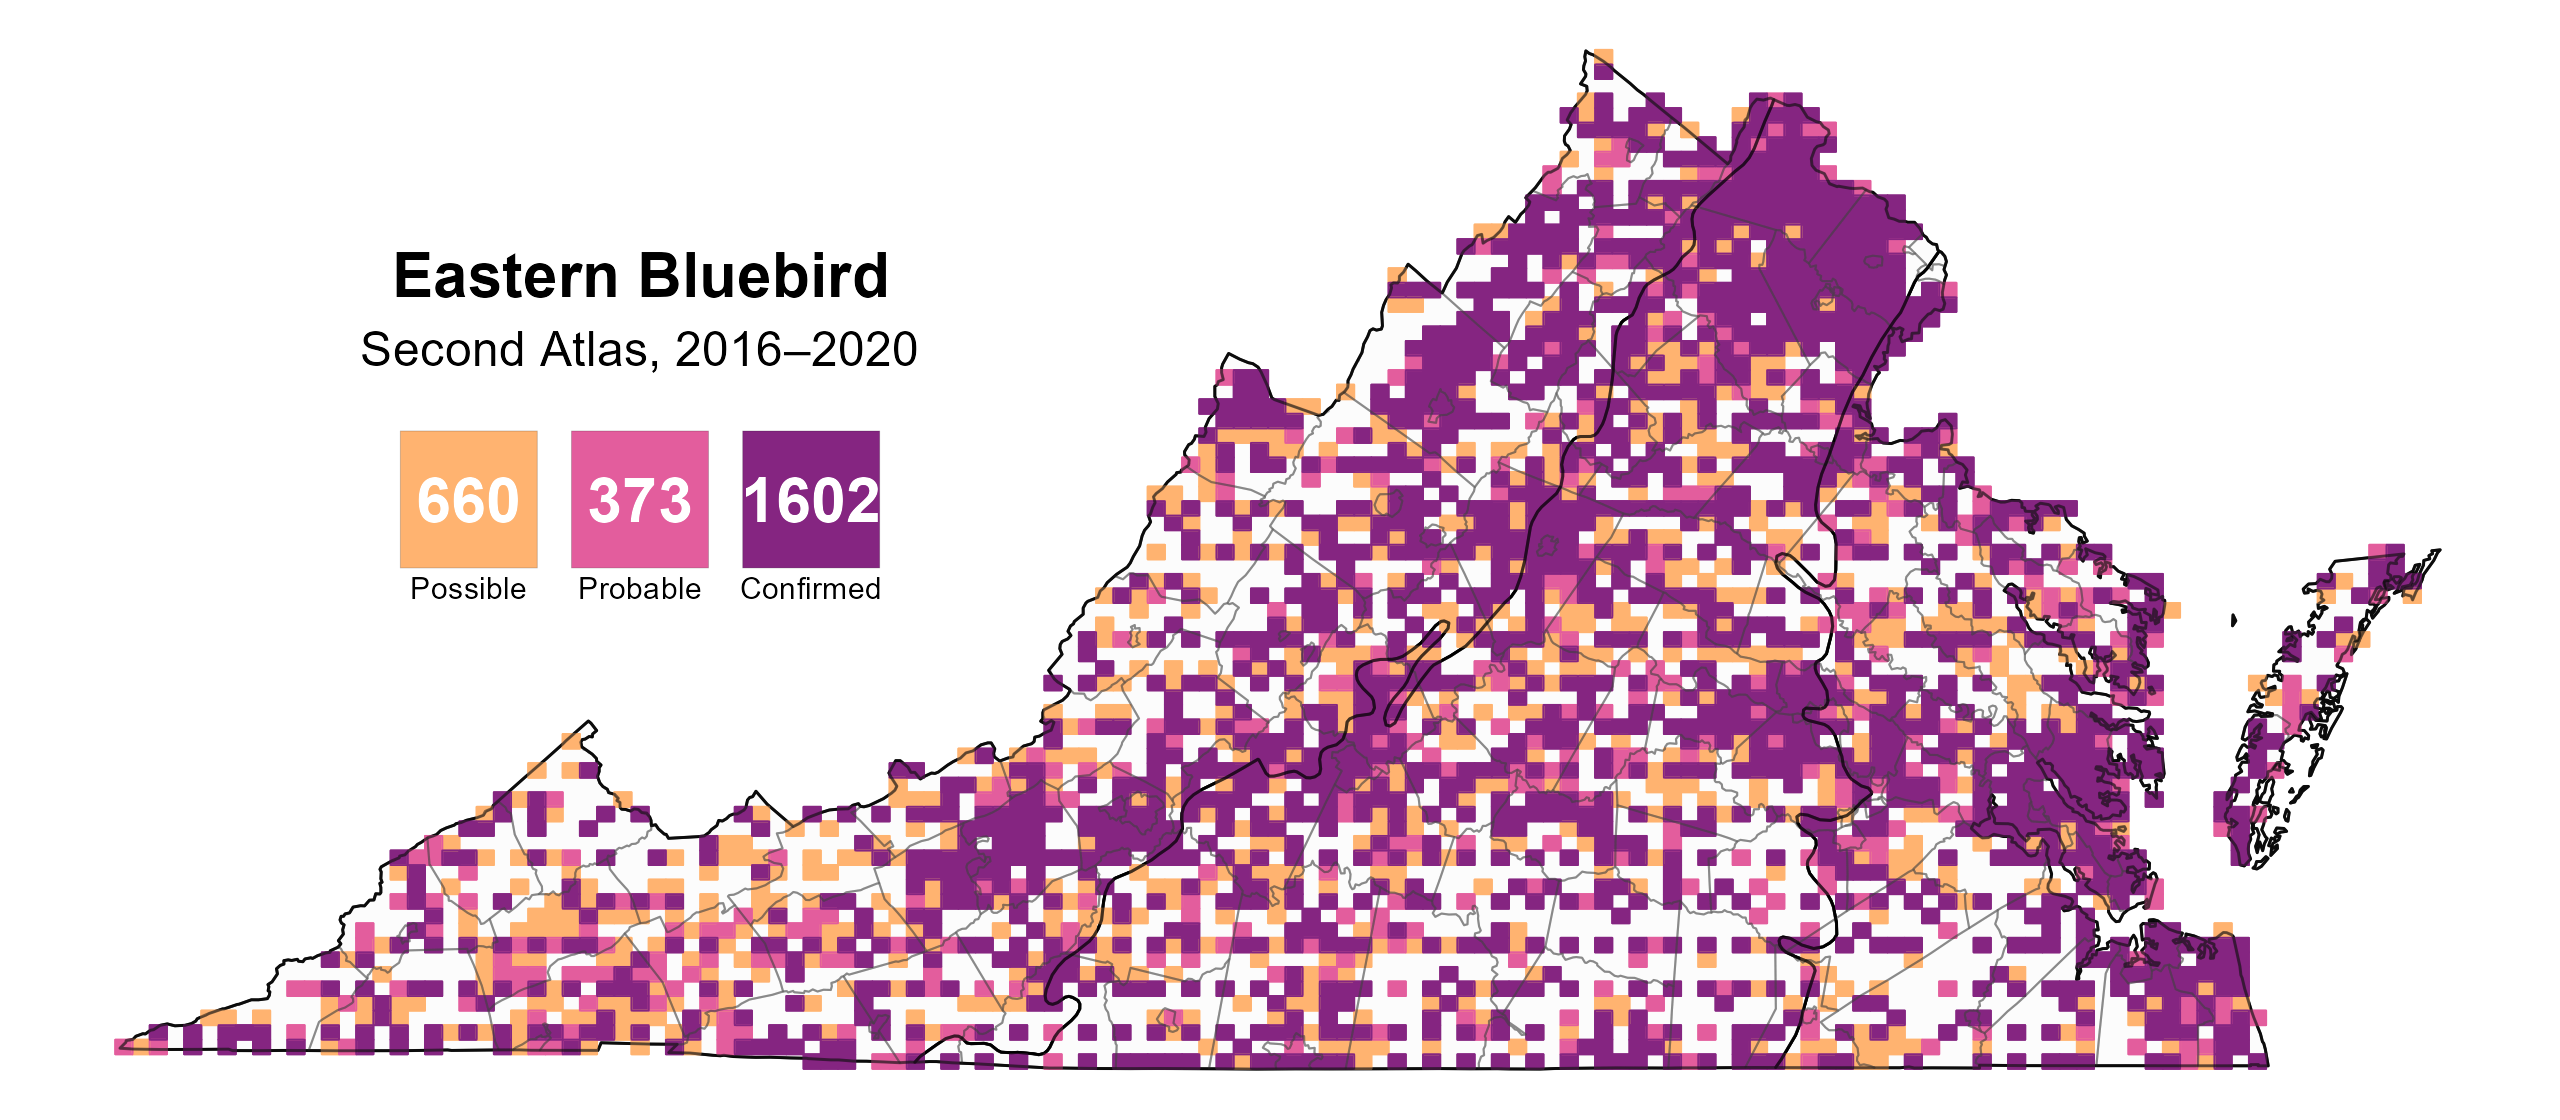
Figure 4: Eastern Bluebird breeding observations from the Second Atlas (2016–2020). The colored boxes illustrate Atlas blocks (approximately 10 mi2 [26 km2] survey units) where the species was detected. The colors show the highest breeding category recorded in a block. The numbers within the colors in the legend correspond to the number of blocks with that breeding evidence category.

Figure 5: Eastern Bluebird breeding observations from the First Atlas (1985–1989). The colored boxes illustrate Atlas blocks (approximately 10 mi2 [26 km2] survey units) where the species was detected. The colors show the highest breeding category recorded in a block. The numbers within the colors in the legend correspond to the number of blocks with that breeding evidence category.

Figure 6: Eastern Bluebird phenology: confirmed breeding codes. This graph shows a timeline of confirmed breeding behaviors. Tick marks represent individual observations of the behavior.
Population Status
The relative abundance of the Eastern Bluebird was estimated to be high in most parts of the Piedmont and Coastal Plain regions, though both regions were dotted with areas of slightly lower abundance, especially in the central portion of the Piedmont and around urban areas (Figure 7). In the Mountains and Valley region, areas with agriculture and development in the valleys had high estimated abundance, while the heavily forested areas in the western and southwestern portion of the region had the lowest predicted abundance levels.
The total estimated Eastern Bluebird population in the state is approximately 1,205,000 individuals (with a range between 936,000 and 1,553,000). Based on the North American Breeding Bird Survey (BBS), the Eastern Bluebird population showed a significant increase of 2.58% annually from 1966–2022 in Virginia, and between Atlas periods, Eastern Bluebirds showed a nonsignificant increase of 0.63% per year from 1987–2018 (Hostetler et al. 2023; Figure 8).
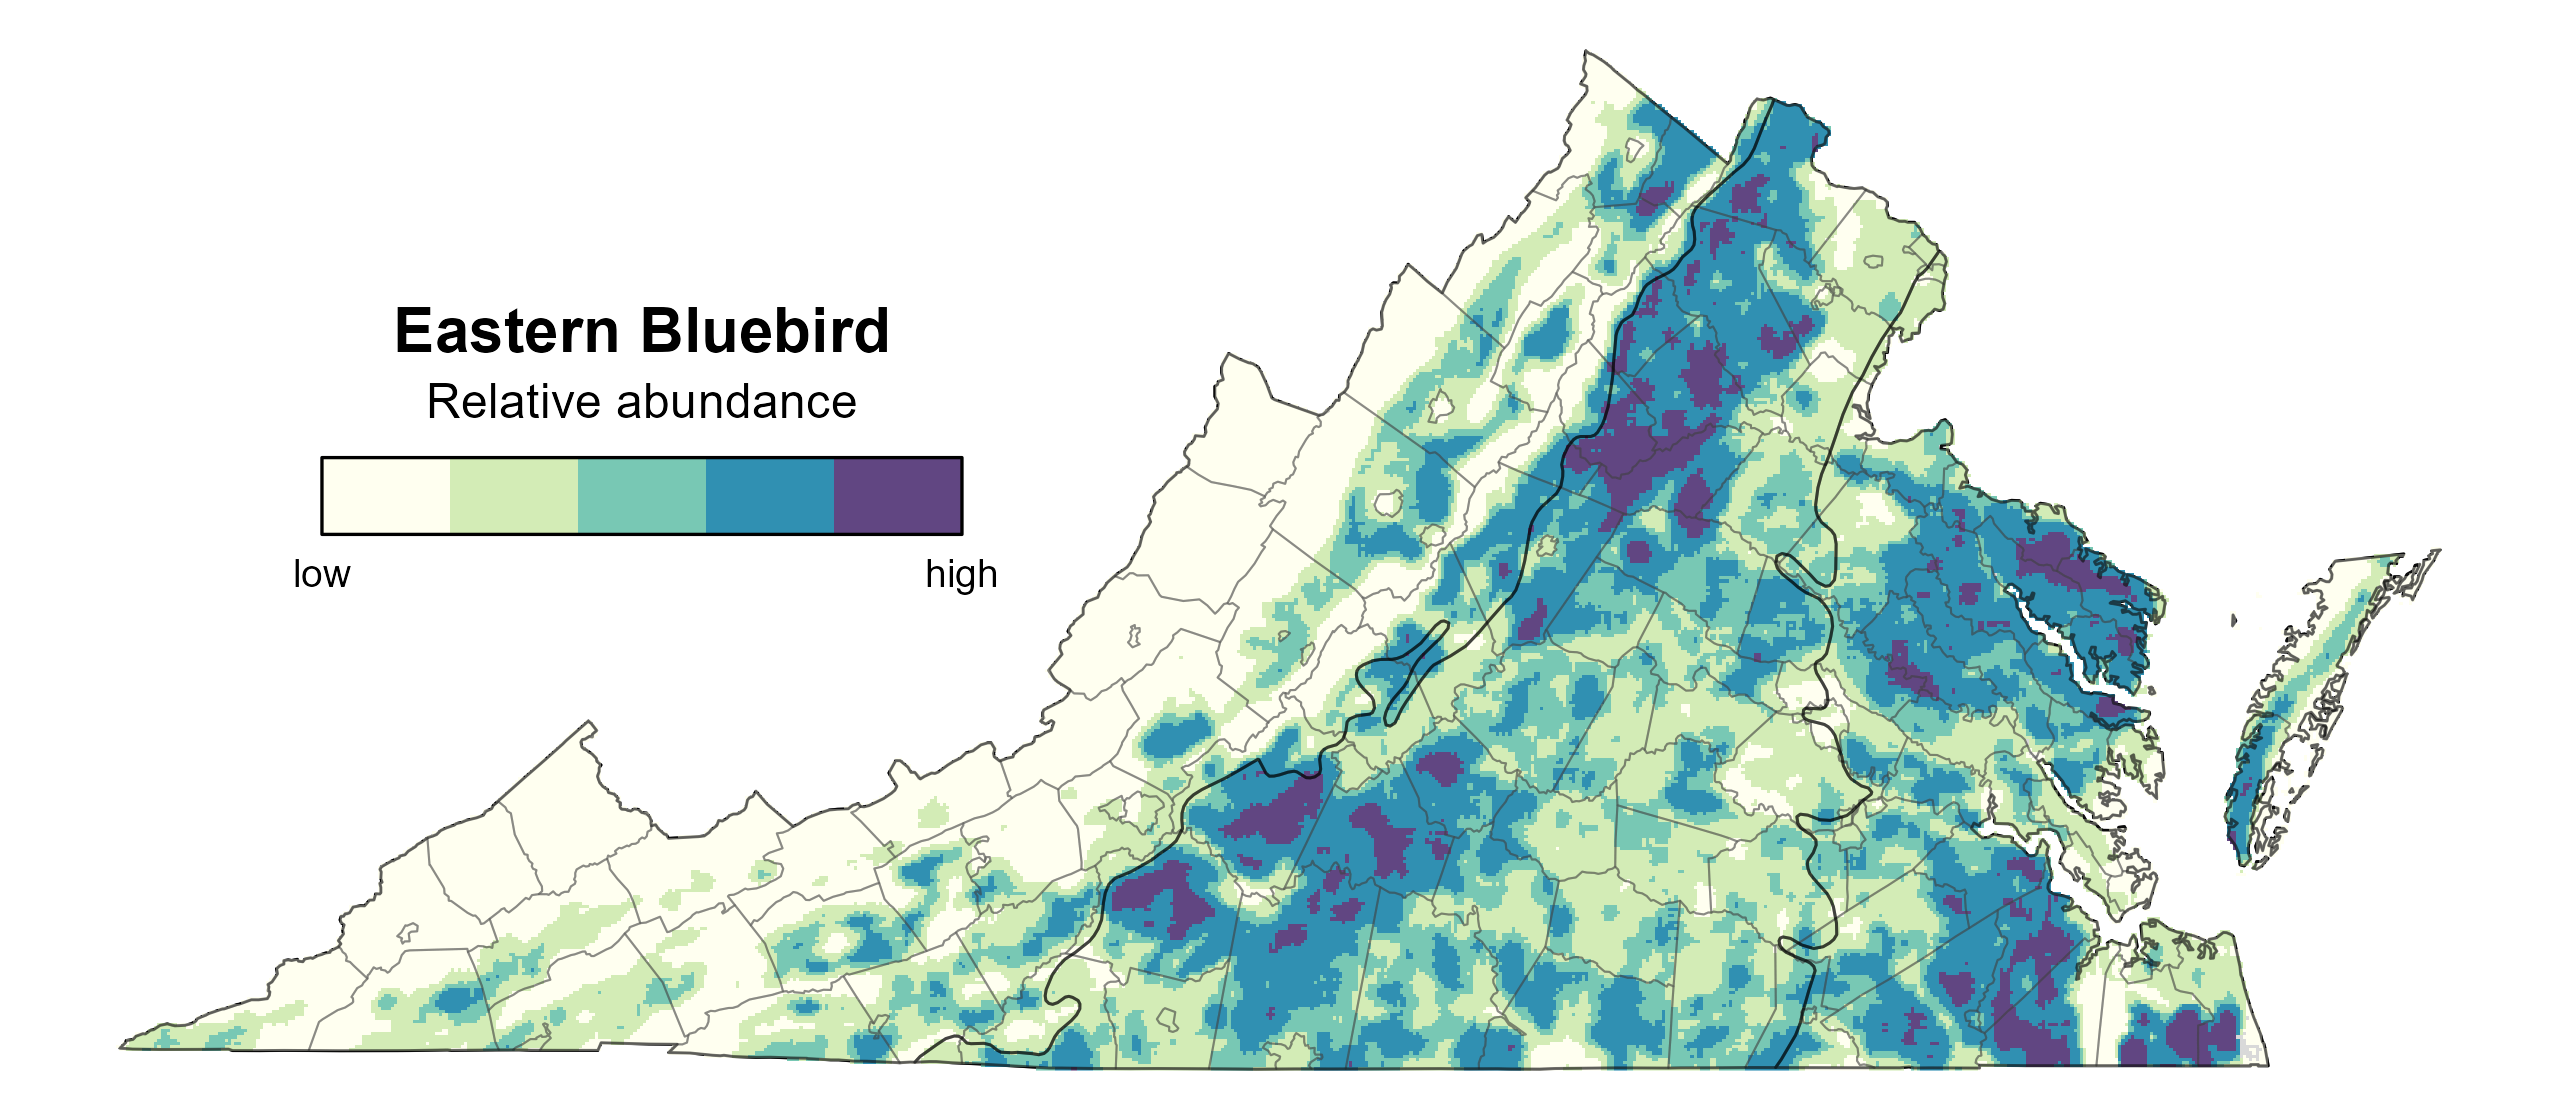
Figure 7: Eastern Bluebird relative abundance (Second Atlas, 2016–2020). This map indicates the predicted abundance of this species at a 0.4 mi2 (1 km2) scale based on environmental (including habitat) factors. Abundance values are presented on a relative scale of low to high.
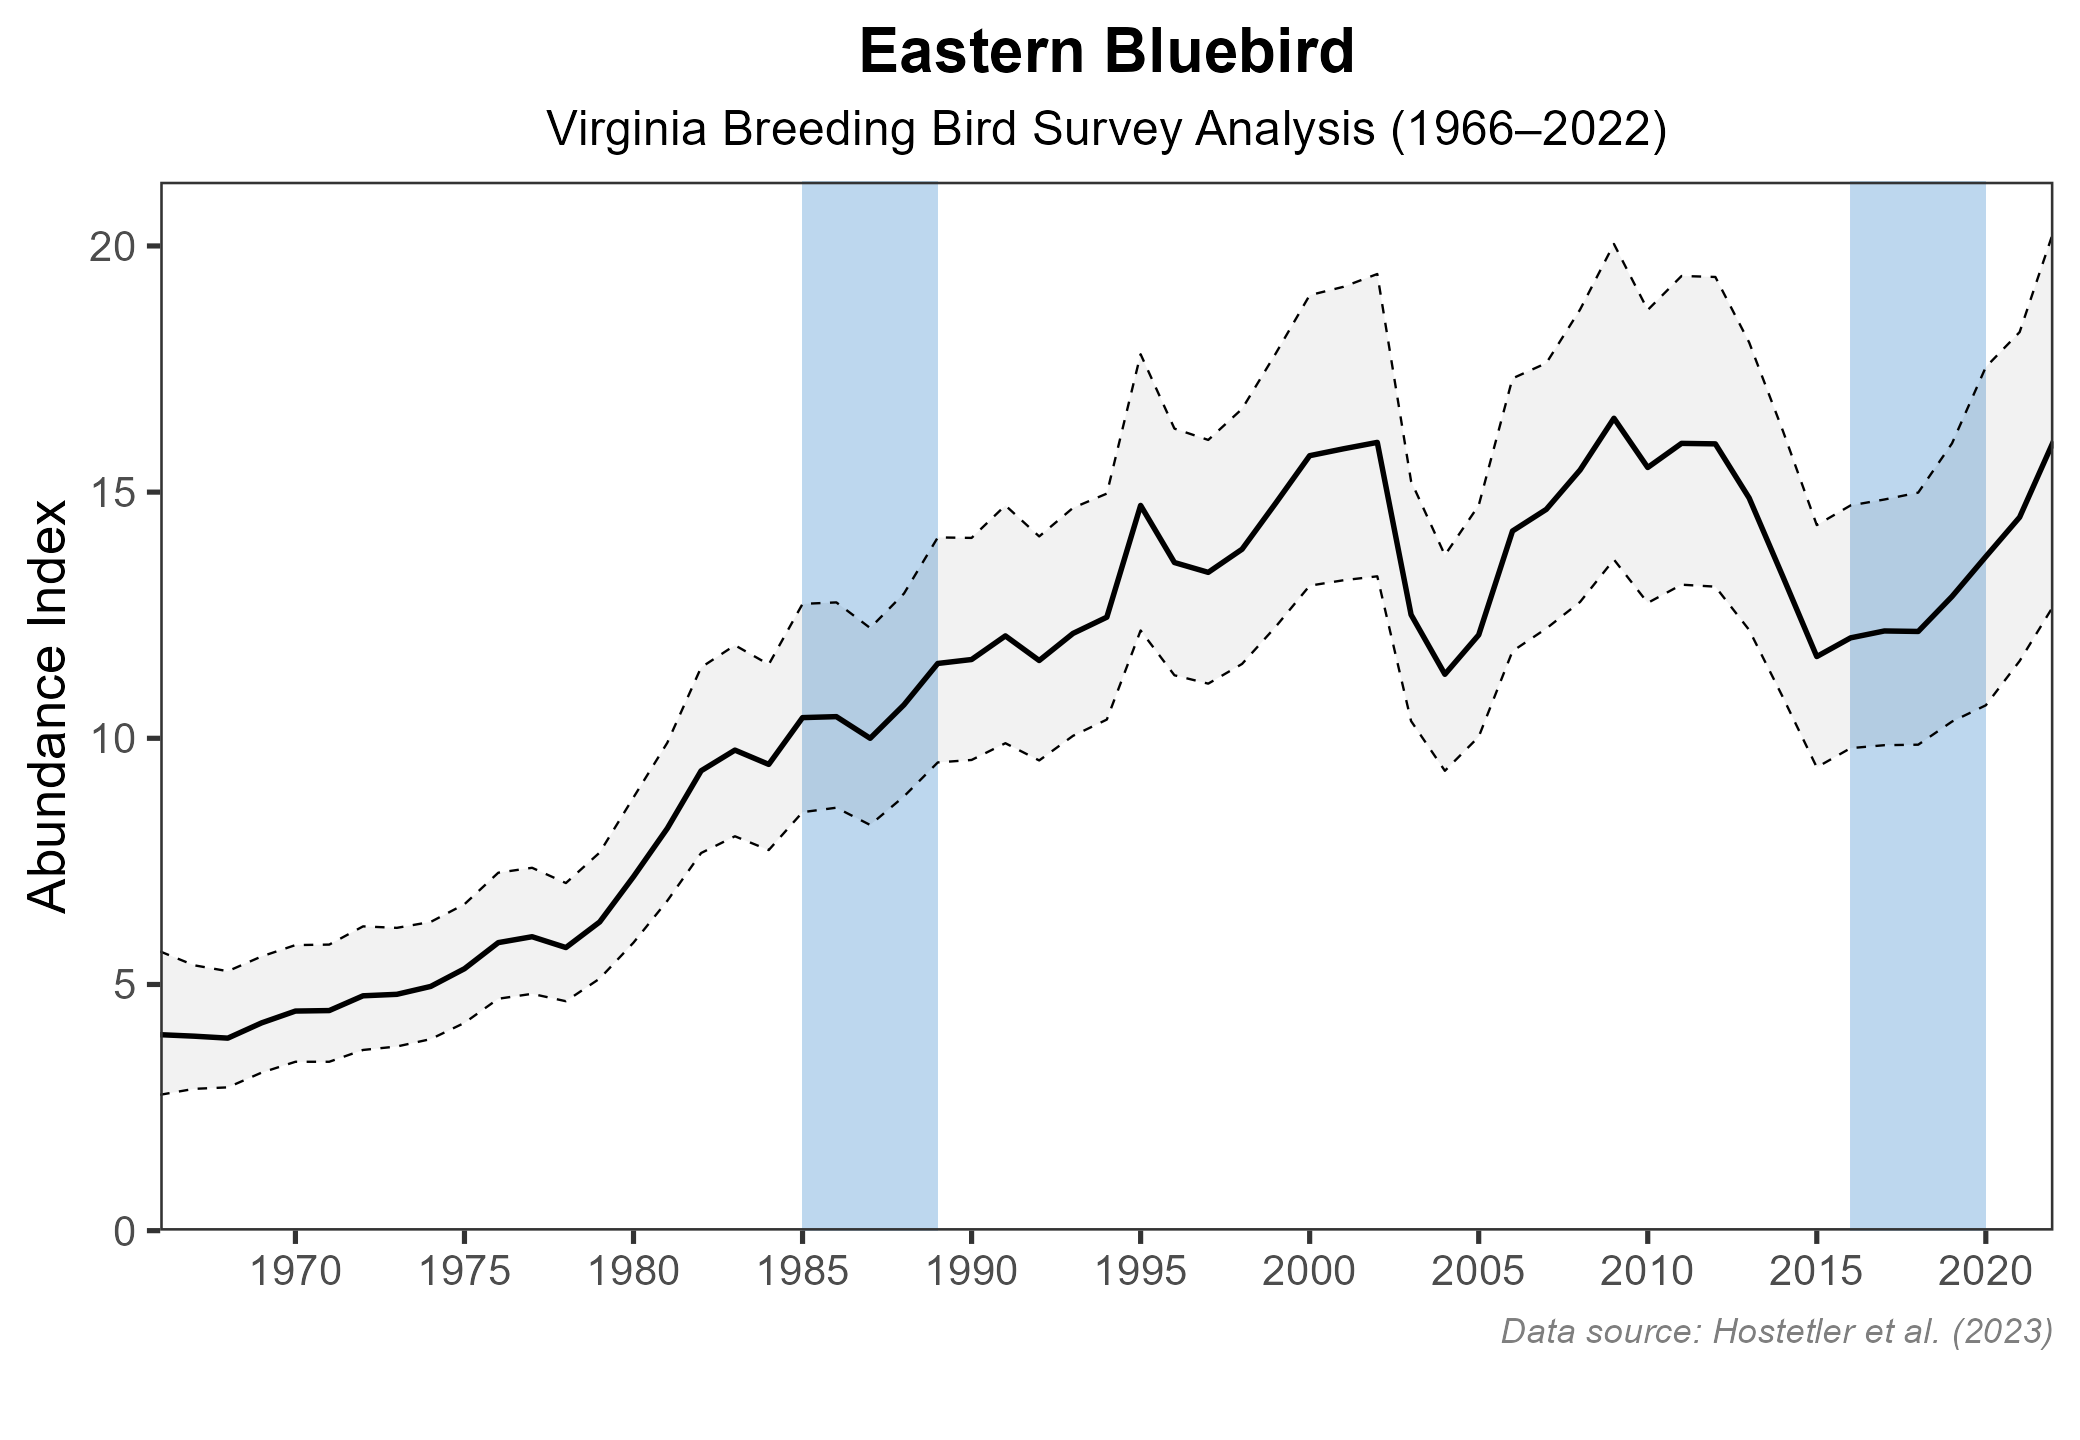
Figure 8: Eastern Bluebird population trend for Virginia as estimated by the North American Breeding Bird Survey. The vertical axis shows species abundance; the horizontal axis shows the year. The solid line indicates the estimated population trend; there is a 97.5% probability that the true population trend falls between the dashed lines. The shaded bars indicate the First and Second Atlas periods.
Conservation
In Virginia, and throughout their range, Eastern Bluebird populations declined dramatically during the first half of the 20th century. The sharp decline was a result of a combination of habitat loss, owing to development, and competition with invasive House Sparrows (Passer domesticus) and European Starlings (Sturnus vulgaris) for nesting sites. Populations have rebounded with the widespread installation of nest boxes (Jackson et al. 2012; Gowaty and Plissner 2020). To learn more about building and installing bluebird boxes, visit the Virginia Bluebird Society website and the Cornell Lab of Ornithology’s NestWatch Program.
Interactive Map
The interactive map contains up to six Atlas layers (probability of occurrence for the First and Second Atlases, change in probability of occurrence between Atlases, breeding evidence for the First and Second Atlases, and abundance for the Second Atlas) that can be viewed one at a time. To view an Atlas map layer, mouse over the layer box in the upper left. County lines and physiographic regional boundaries (Mountains and Valleys, Piedmont, and Coastal Plain) can be turned on and off by checking or unchecking the box below the layer box. Within the map window, users can hover on a block to see its value for each layer and pan and zoom to see roads, towns, and other features of interest that are visible beneath a selected layer.
View Interactive Map in Full Screen
References
Gowaty, P. A., and J. H. Plissner (2020). Eastern Bluebird (Sialia sialis), version 1.0. In Birds of the World (A. F. Poole, Editor). Cornell Lab of Ornithology, Ithaca, NY, USA. https://doi.org/10.2173/bow.easblu.01.
Hostetler, J. A., J. R. Sauer, J. E. Hines, D. Ziolkowski, and M. Lutmerding (2023). The North American breeding bird survey, analysis results 1966–2022. U.S. Geological Survey, Laurel, MD, USA. https://doi.org/10.5066/P9SC7T11.
Jackson, A. K., J. P. Froneberger, and D. A. Cristol (2013). Habitat near nest boxes correlated with fate of Eastern Bluebird fledglings in an urban landscape. Urban Ecosystems 16:367–76.