Introduction
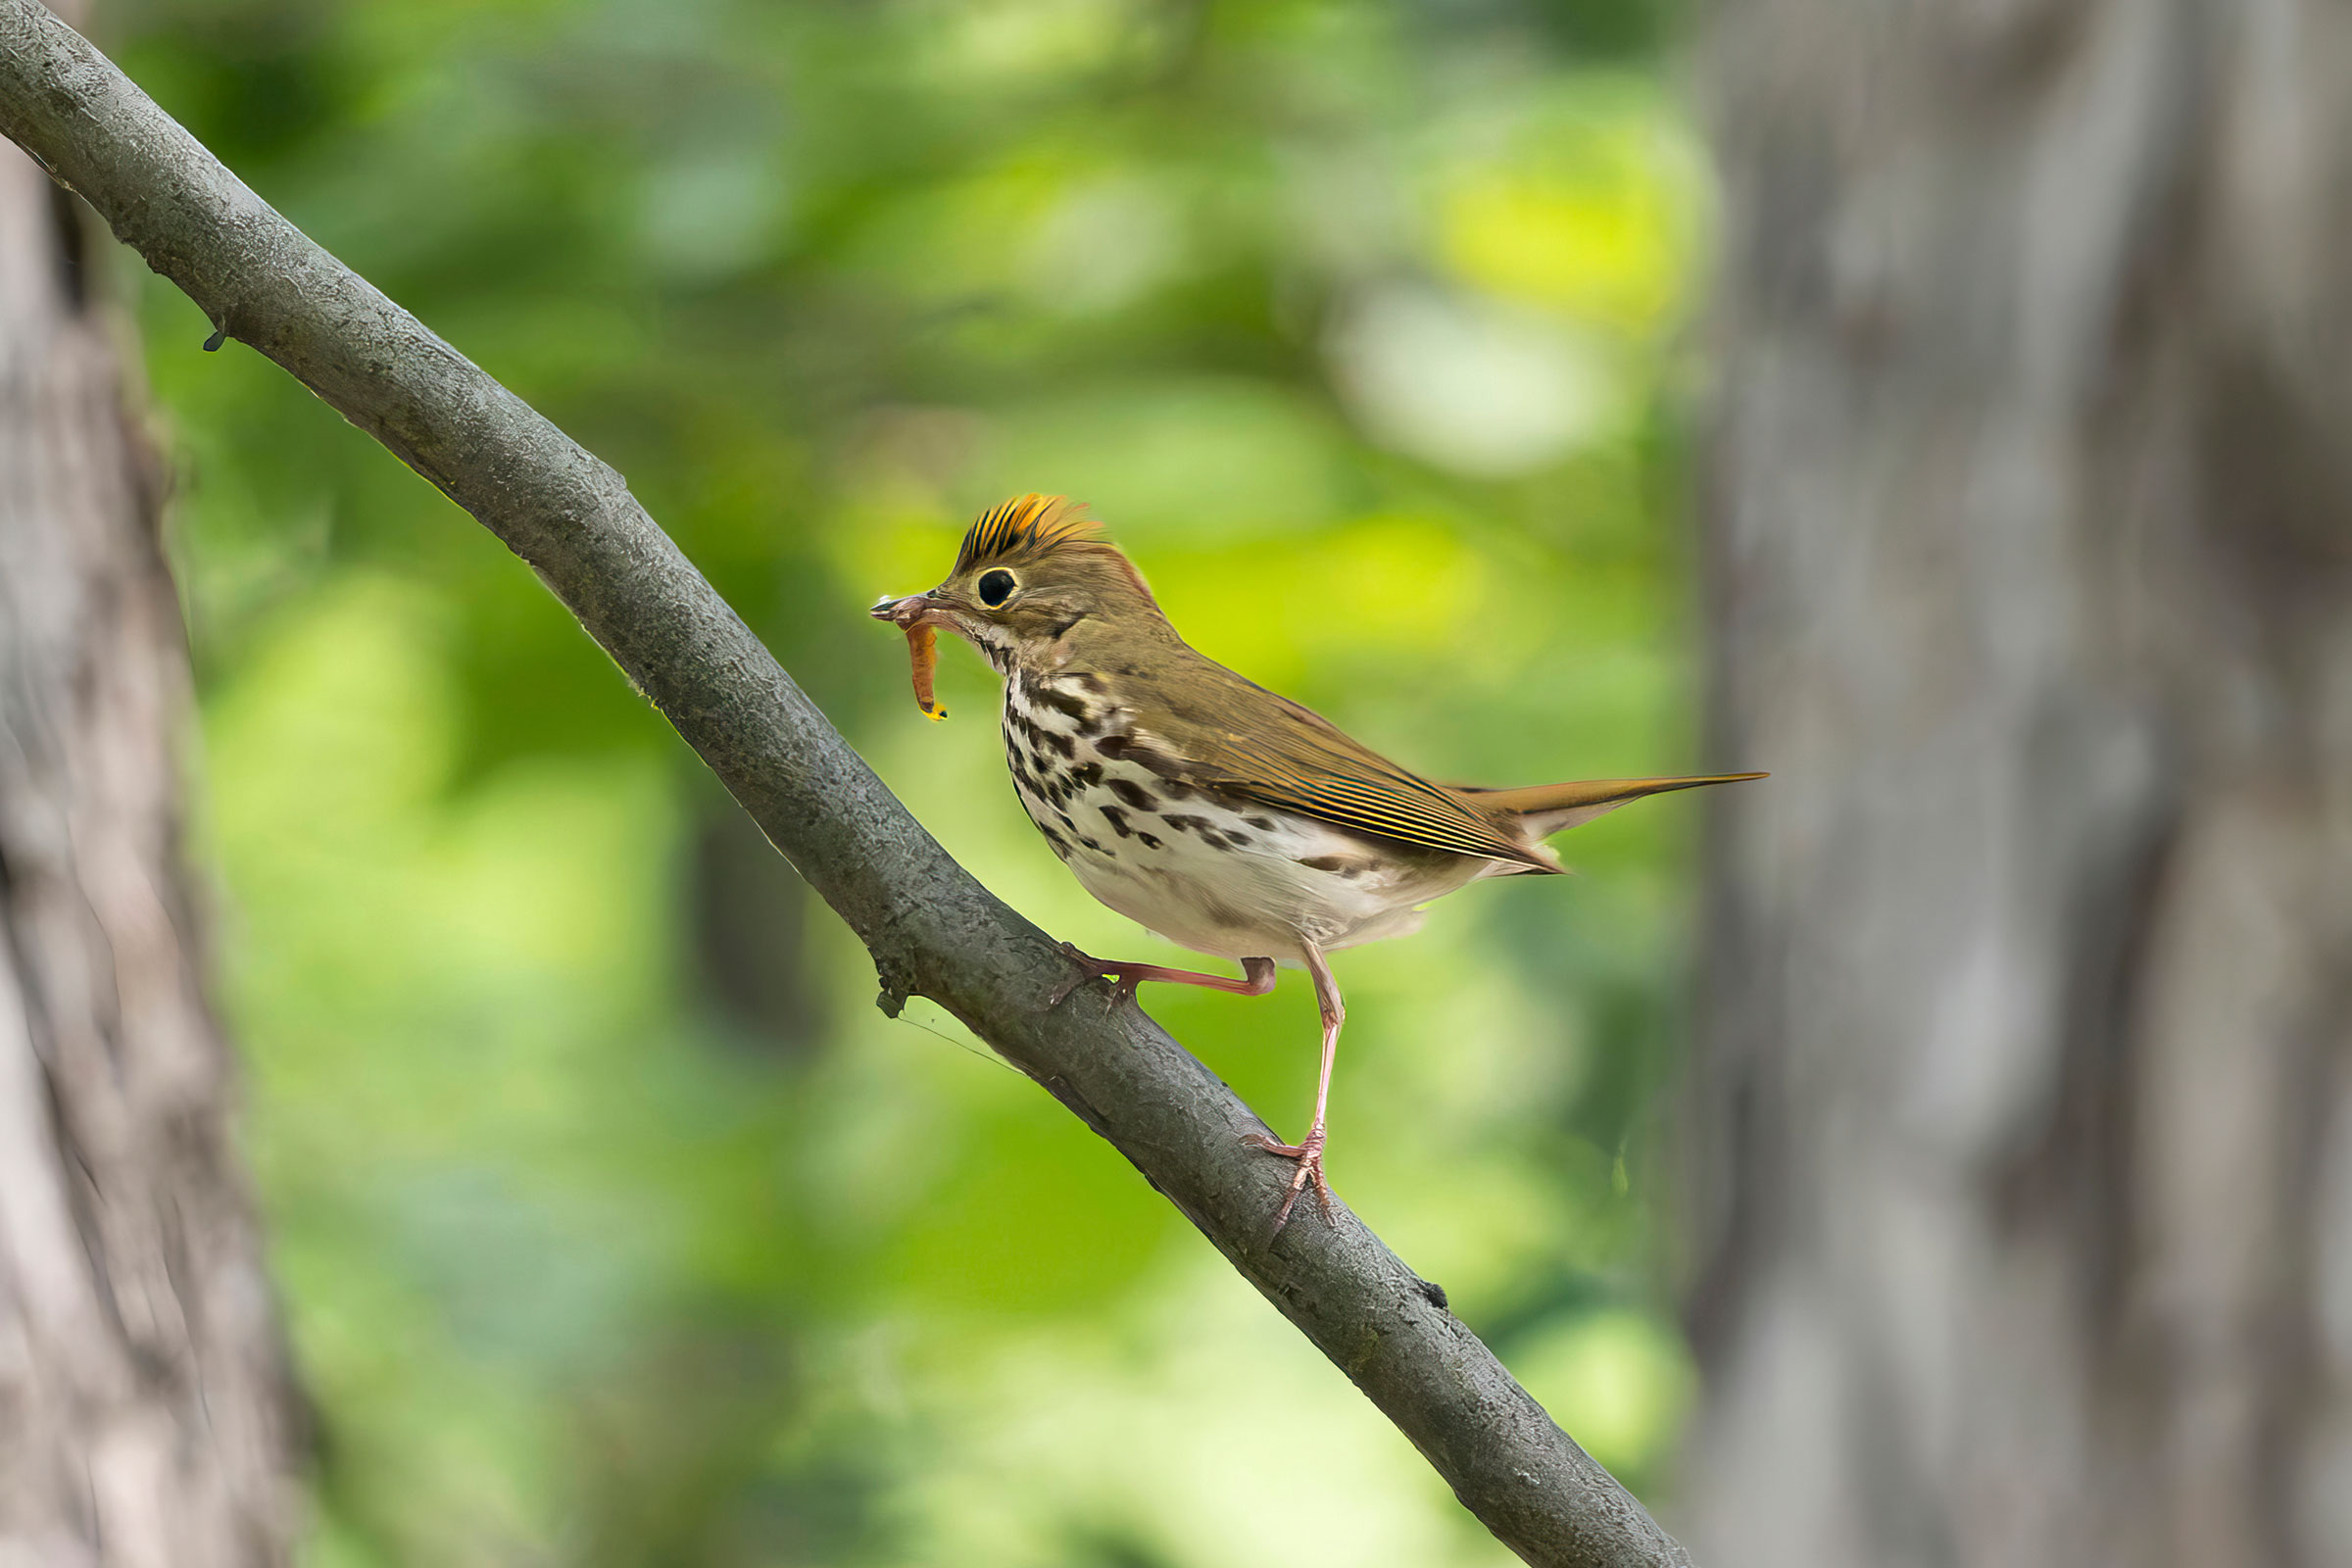
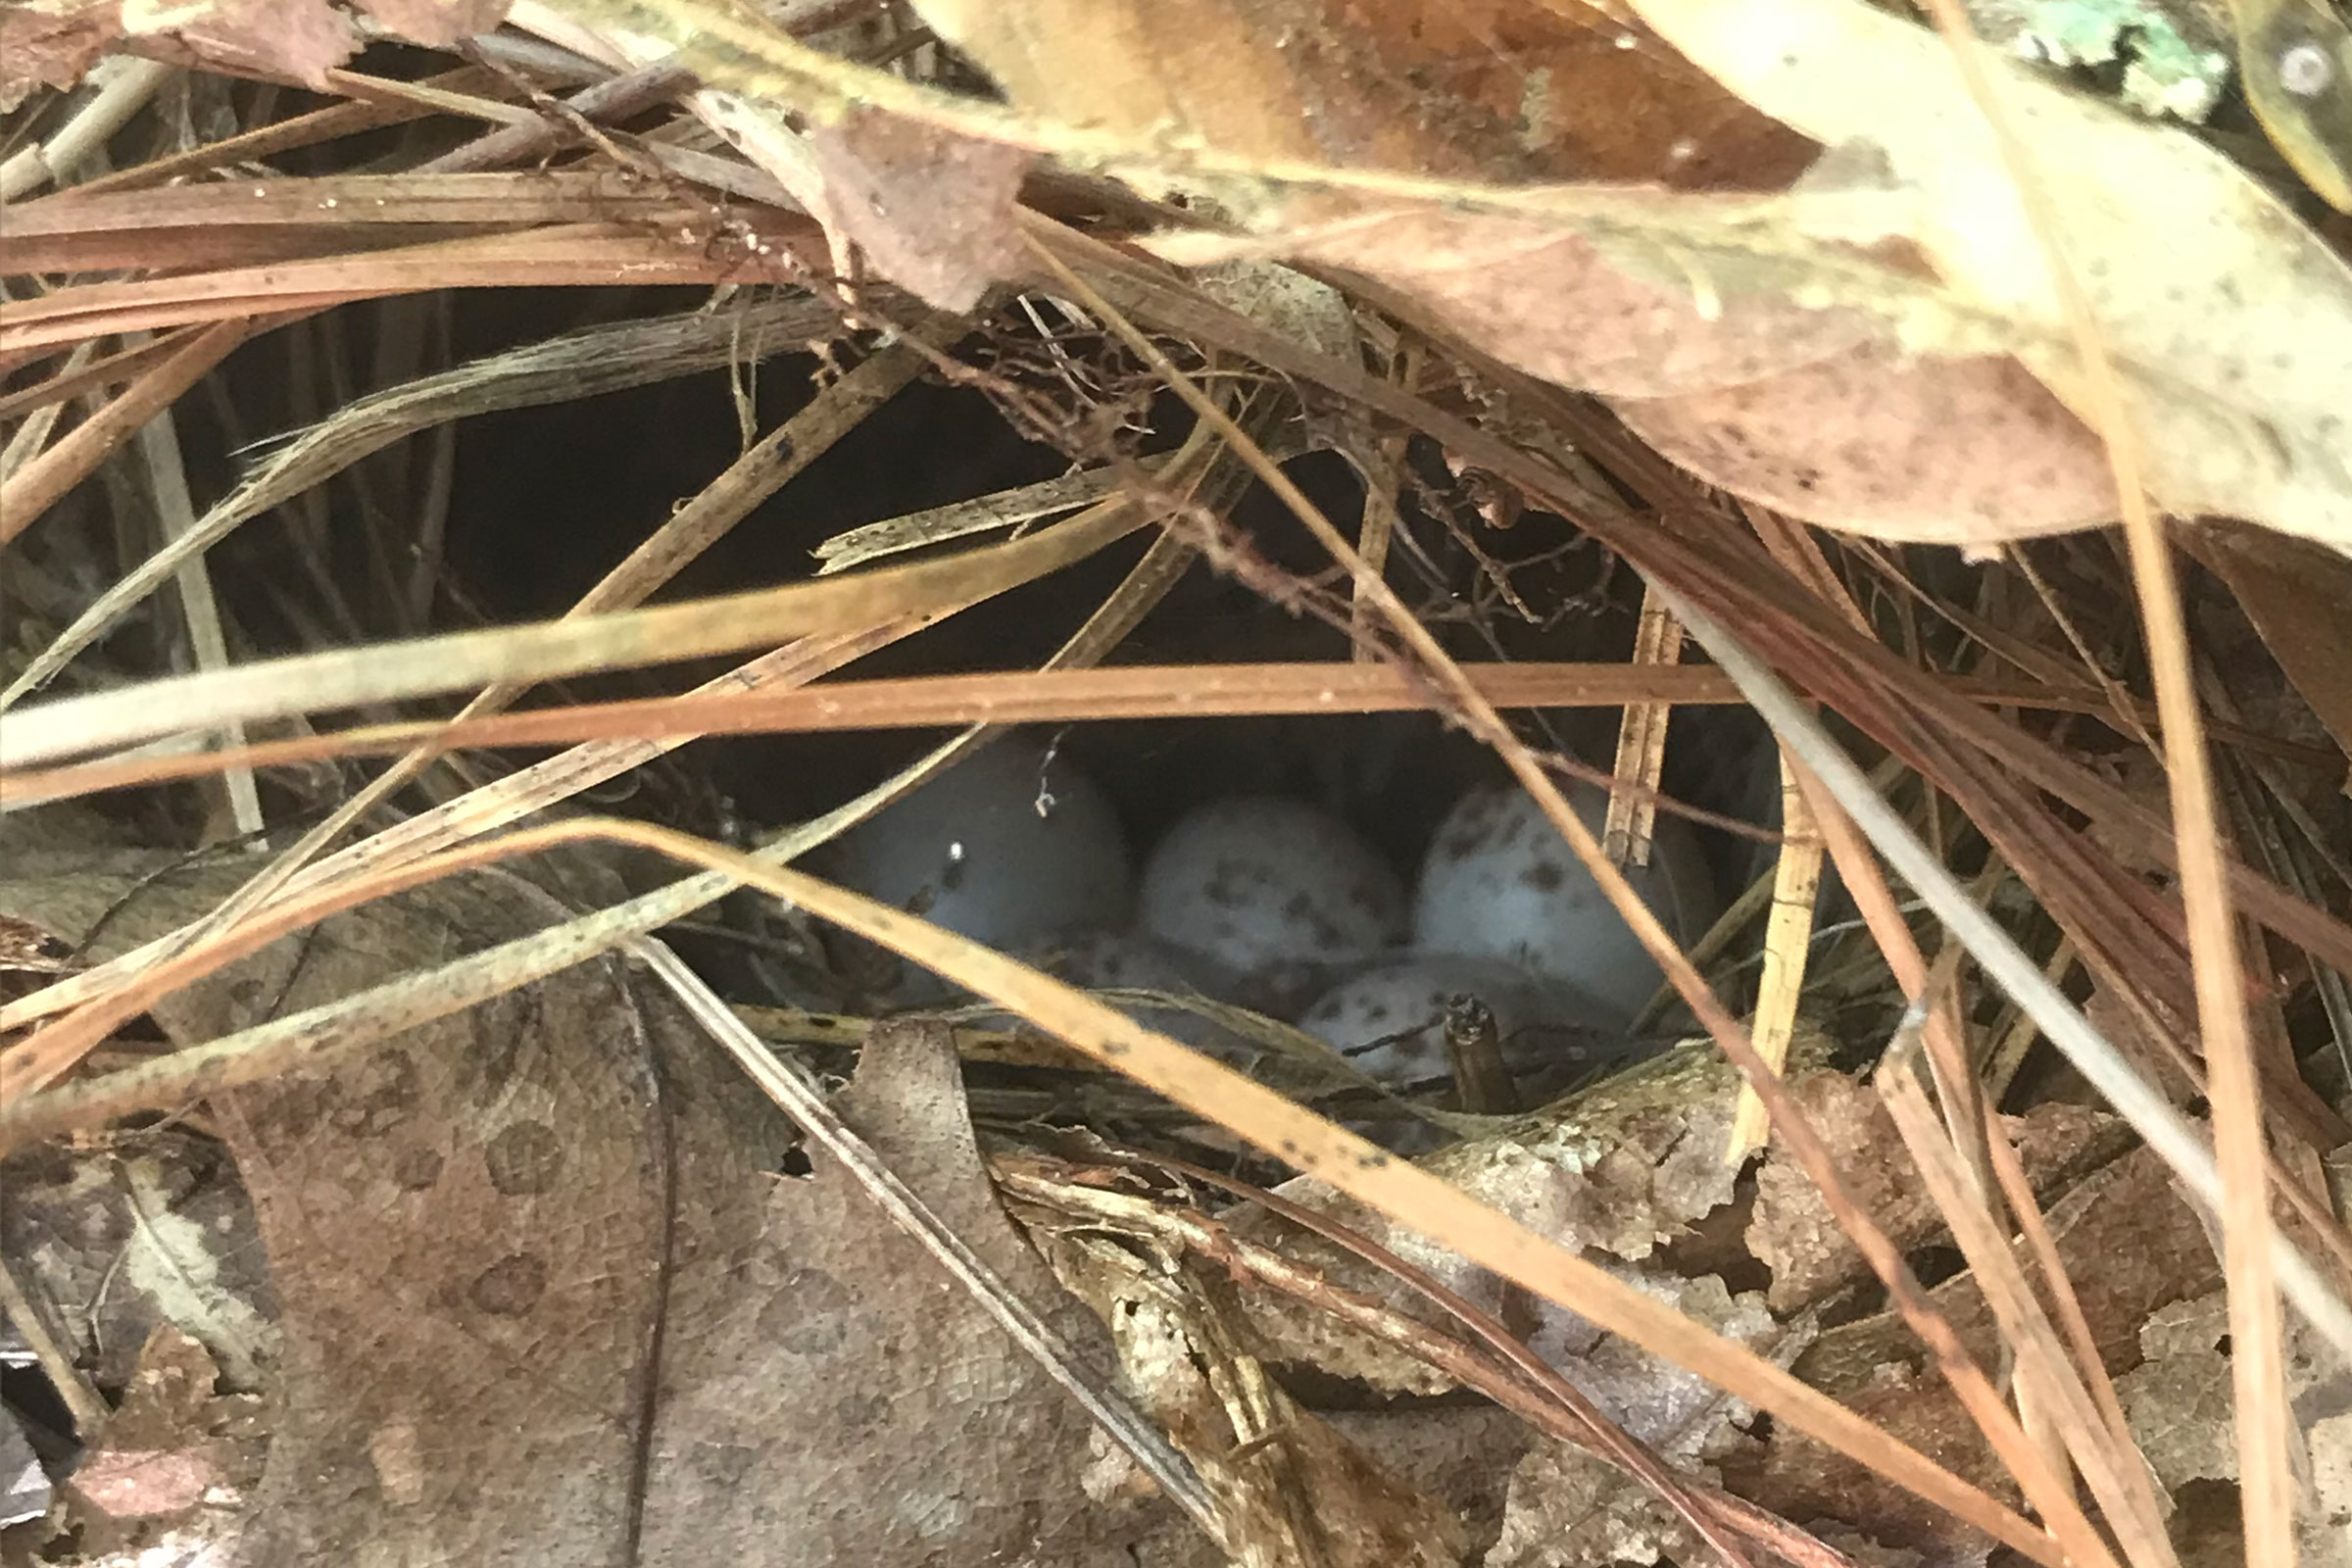
The Ovenbird is one of Virginia’s most common breeding warblers. However, its nests can be hard to find (they are placed on the ground and made of leaves), and its shape of an old, round oven gives the Ovenbird its name. During summer months, the male sings teacher-teacher-teacher from forests and large woodlots throughout the state (Porneluzi el al. 2020).
Breeding Distribution
Ovenbirds are found throughout Virginia, but they are most likely to inhabit the heavily forested portions of the Mountains and Valleys region and the central Piedmont region (Figure 1). Accordingly, Ovenbird likelihood of occurrence increases as forest cover in a block increases. Its probable occurrence is also positively associated with forest patch size, forest edge habitat, and shrubland habitat. Ovenbirds are less likely to be found in agricultural areas of the Mountains and Valleys region, highly developed portions of the northern Piedmont region, and less-forested, marsh-dominated areas of the Coastal Plain region (Figure 1).
Between the First and Second Atlases (Figures 1 and 2), the Ovenbird’s likely occurrence decreased in large urban areas such as Hampton Roads-Virginia Beach, Northern Virginia, and Richmond, as well as in smaller urbanized locations across the state (Figure 3). These decreases in probable occurrence were likely associated with forest loss resulting from development. It also was less likely to occur on the Eastern Shore during the Second Atlas than during the First Atlas.
View Environmental Associations
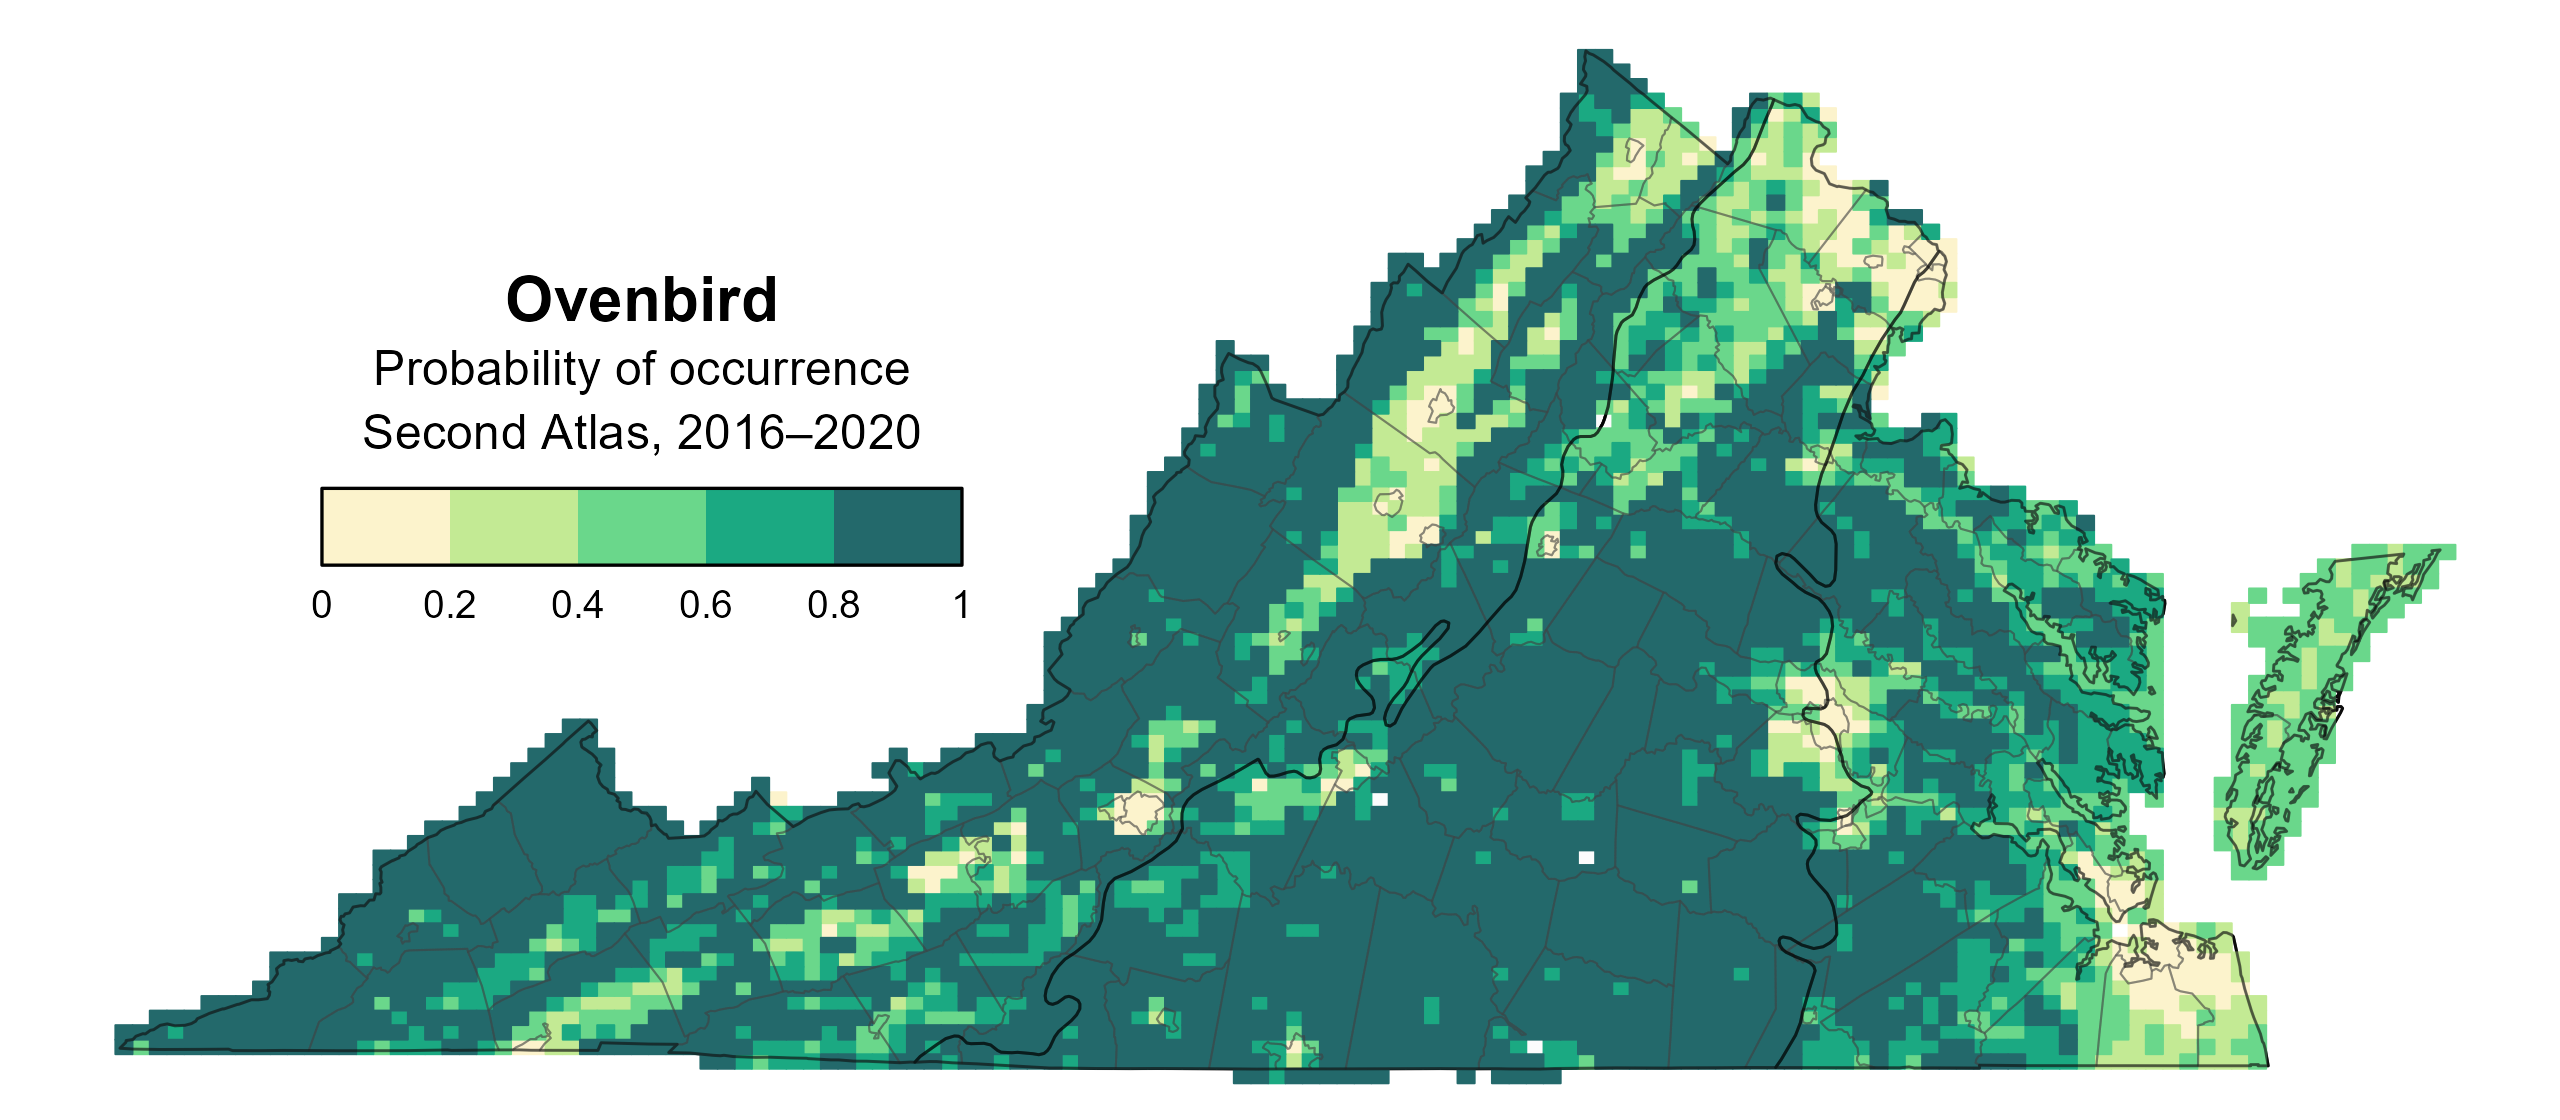
Figure 1: Ovenbird breeding distribution based on probability of occurrence (Second Atlas, 2016–2020). This map indicates the probability that this species will occur in an Atlas block (an approximately 10 mi2 [26 km2] survey unit) based on environmental (including habitat) factors and after adjusting for the probability of detection (variation in survey effort among blocks).
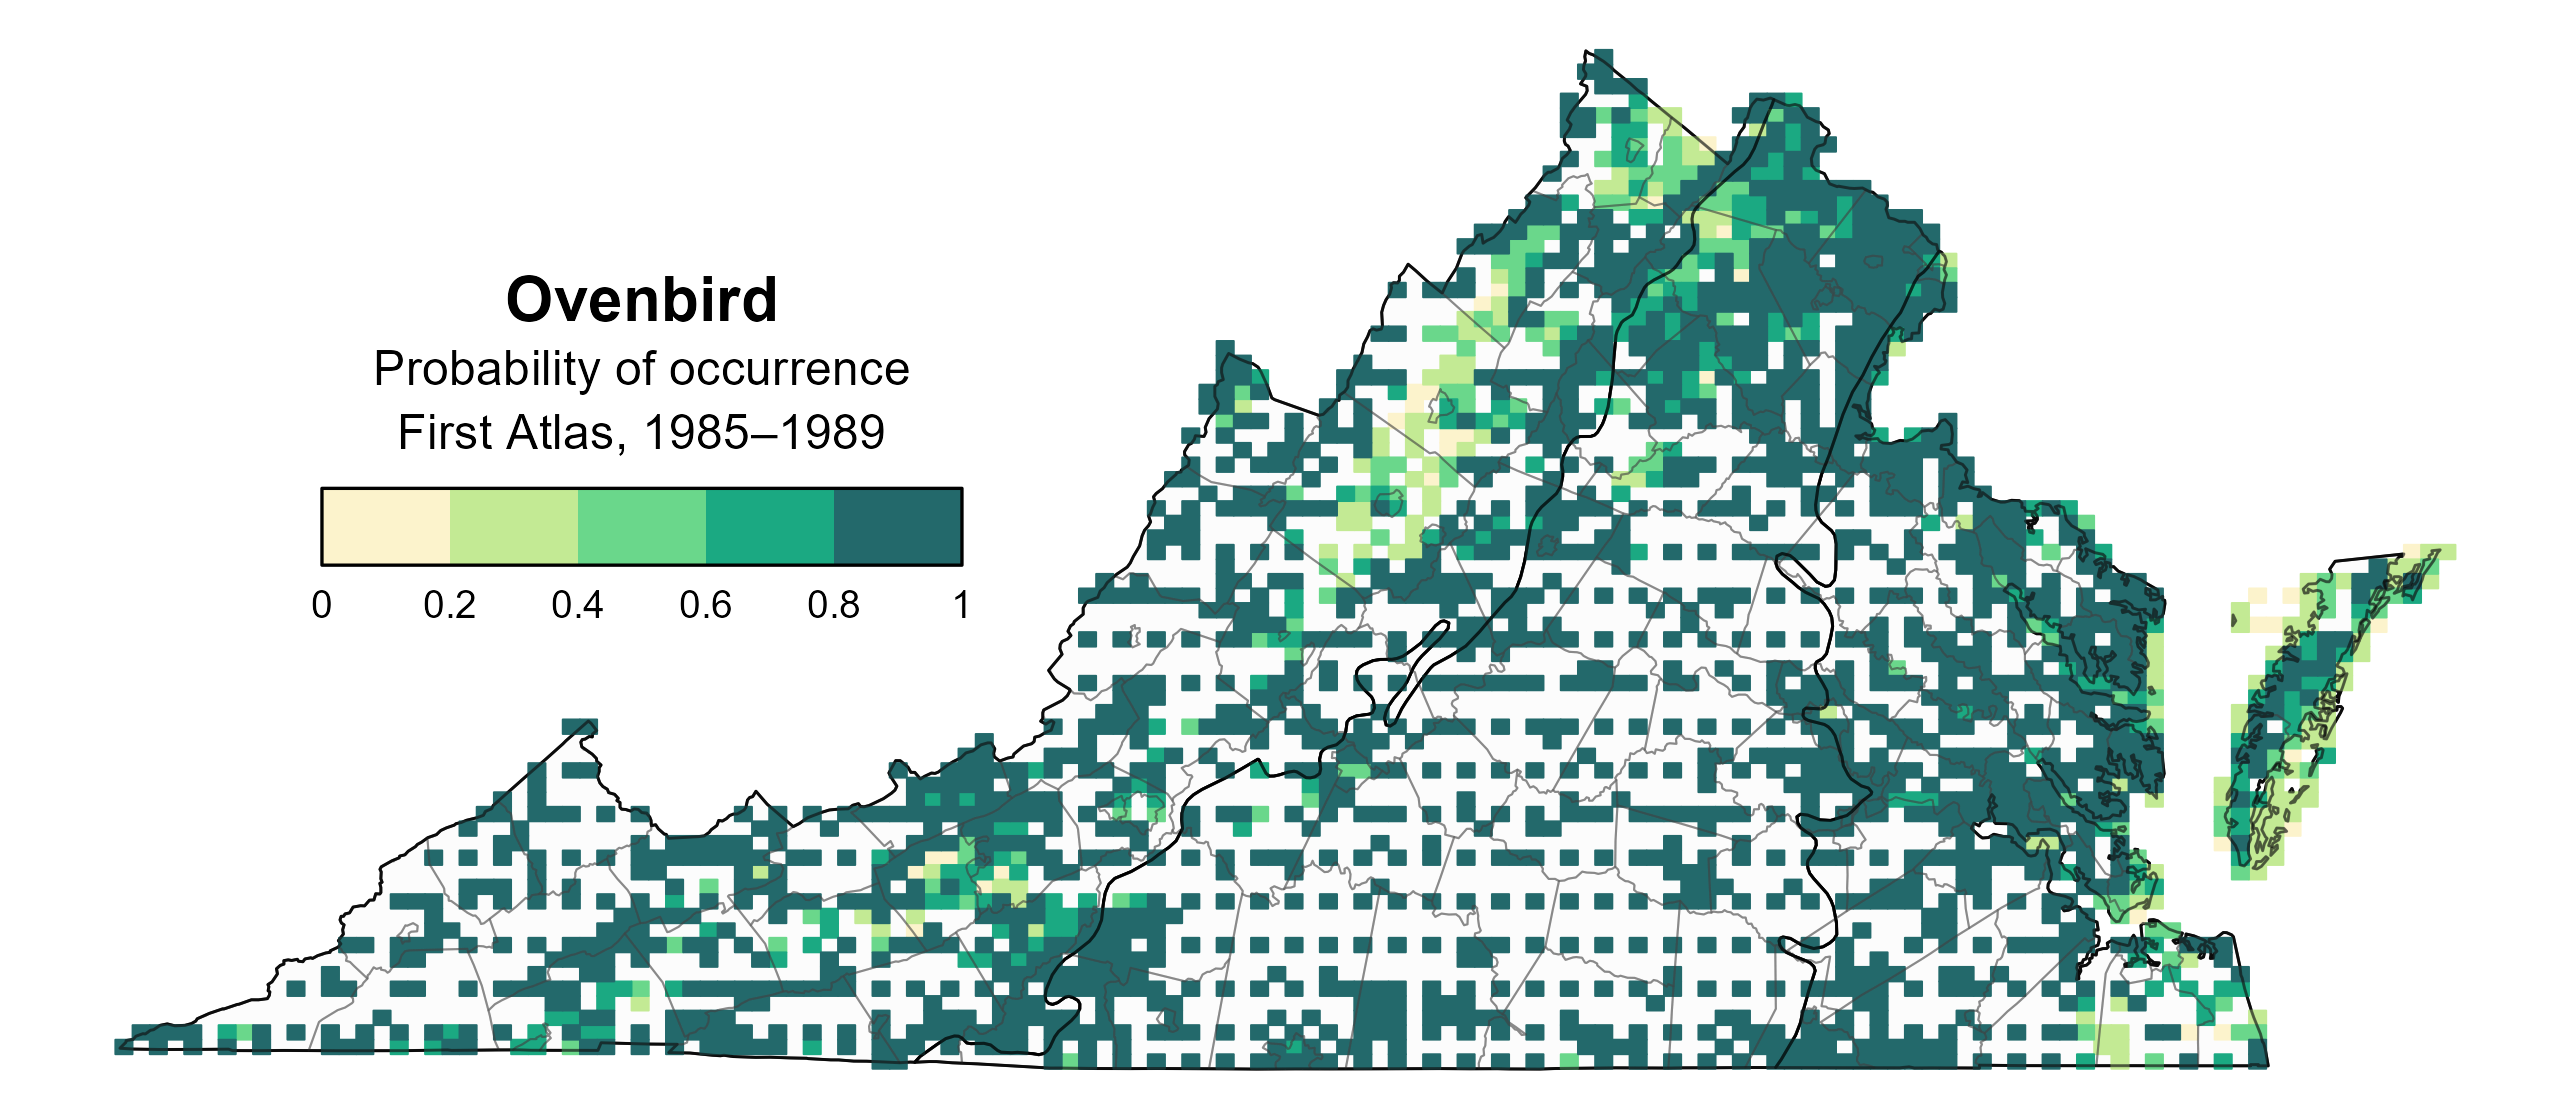
Figure 2: Ovenbird breeding distribution based on probability of occurrence (First Atlas, 1985–1989). This map indicates the probability that this species will occur in an Atlas block (an approximately 10 mi2 [26 km2] survey unit) based on environmental (including habitat) factors and after adjusting for the probability of detection (variation in survey effort among blocks). Blocks in white were not surveyed during the First Atlas and were not modeled.
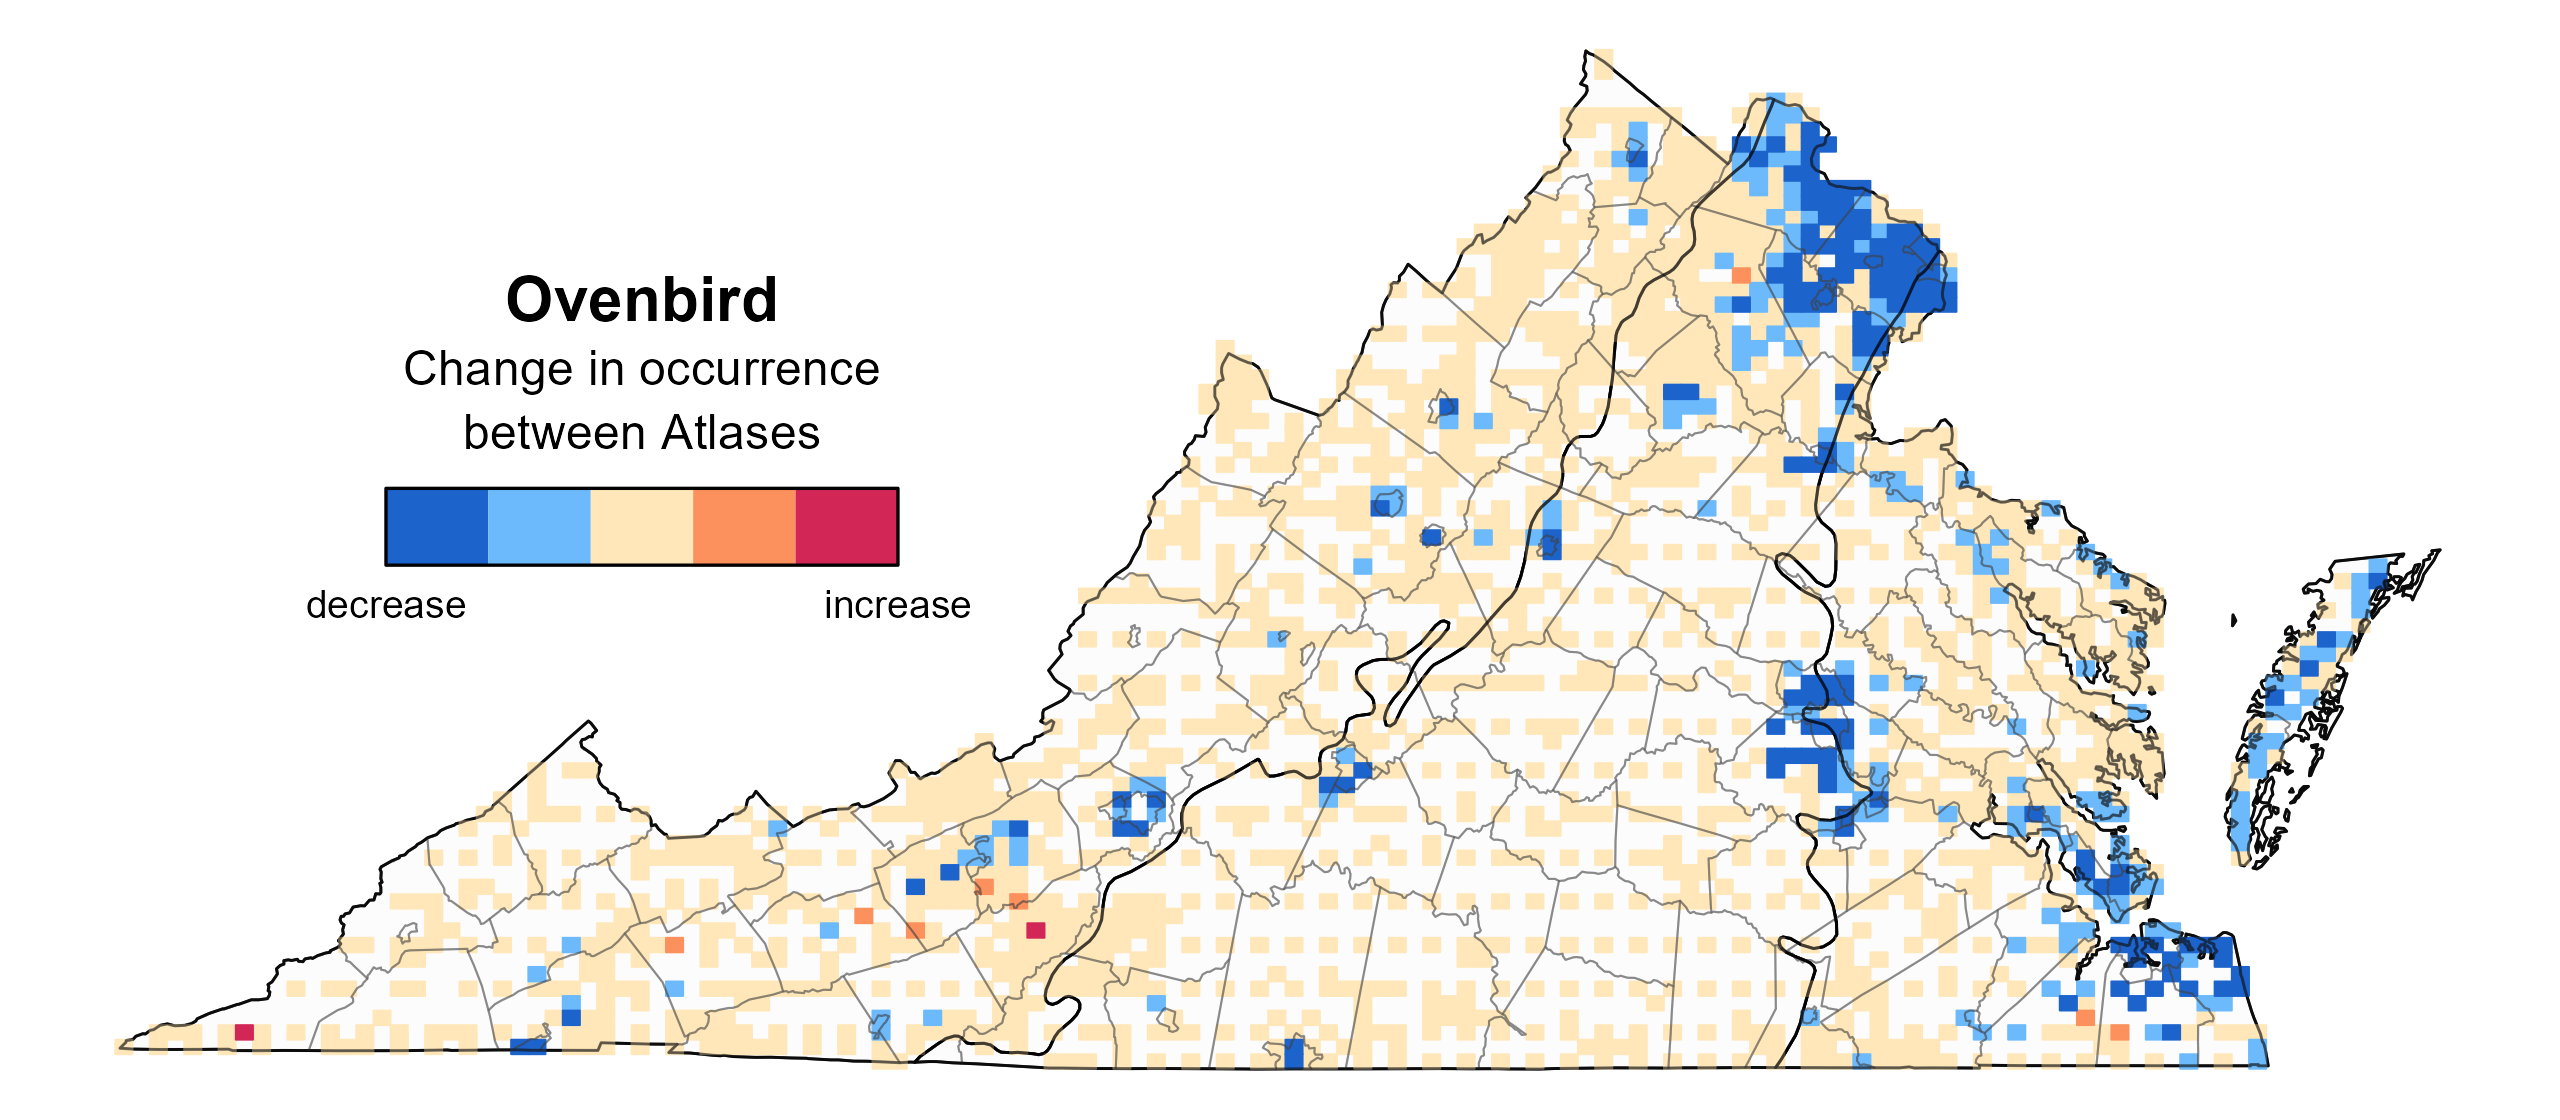
Figure 3: Ovenbird change in breeding distribution between Atlases (1985–1989 and 2016–2020) based on probability of occurrence. This map indicates the change in the probability that this species will occur in a block (an approximately 10 mi2 [26 km2] survey unit) between Atlas periods. Blocks with no change may have constant presence or constant absence. Blocks in white were not surveyed during the First Atlas and were not modeled.
Breeding Evidence
Ovenbirds were confirmed breeders in 242 blocks and 86 counties and probable breeders in an additional 16 counties (Figure 4). They were also observed breeding throughout the state during the First Atlas (Figure 5).
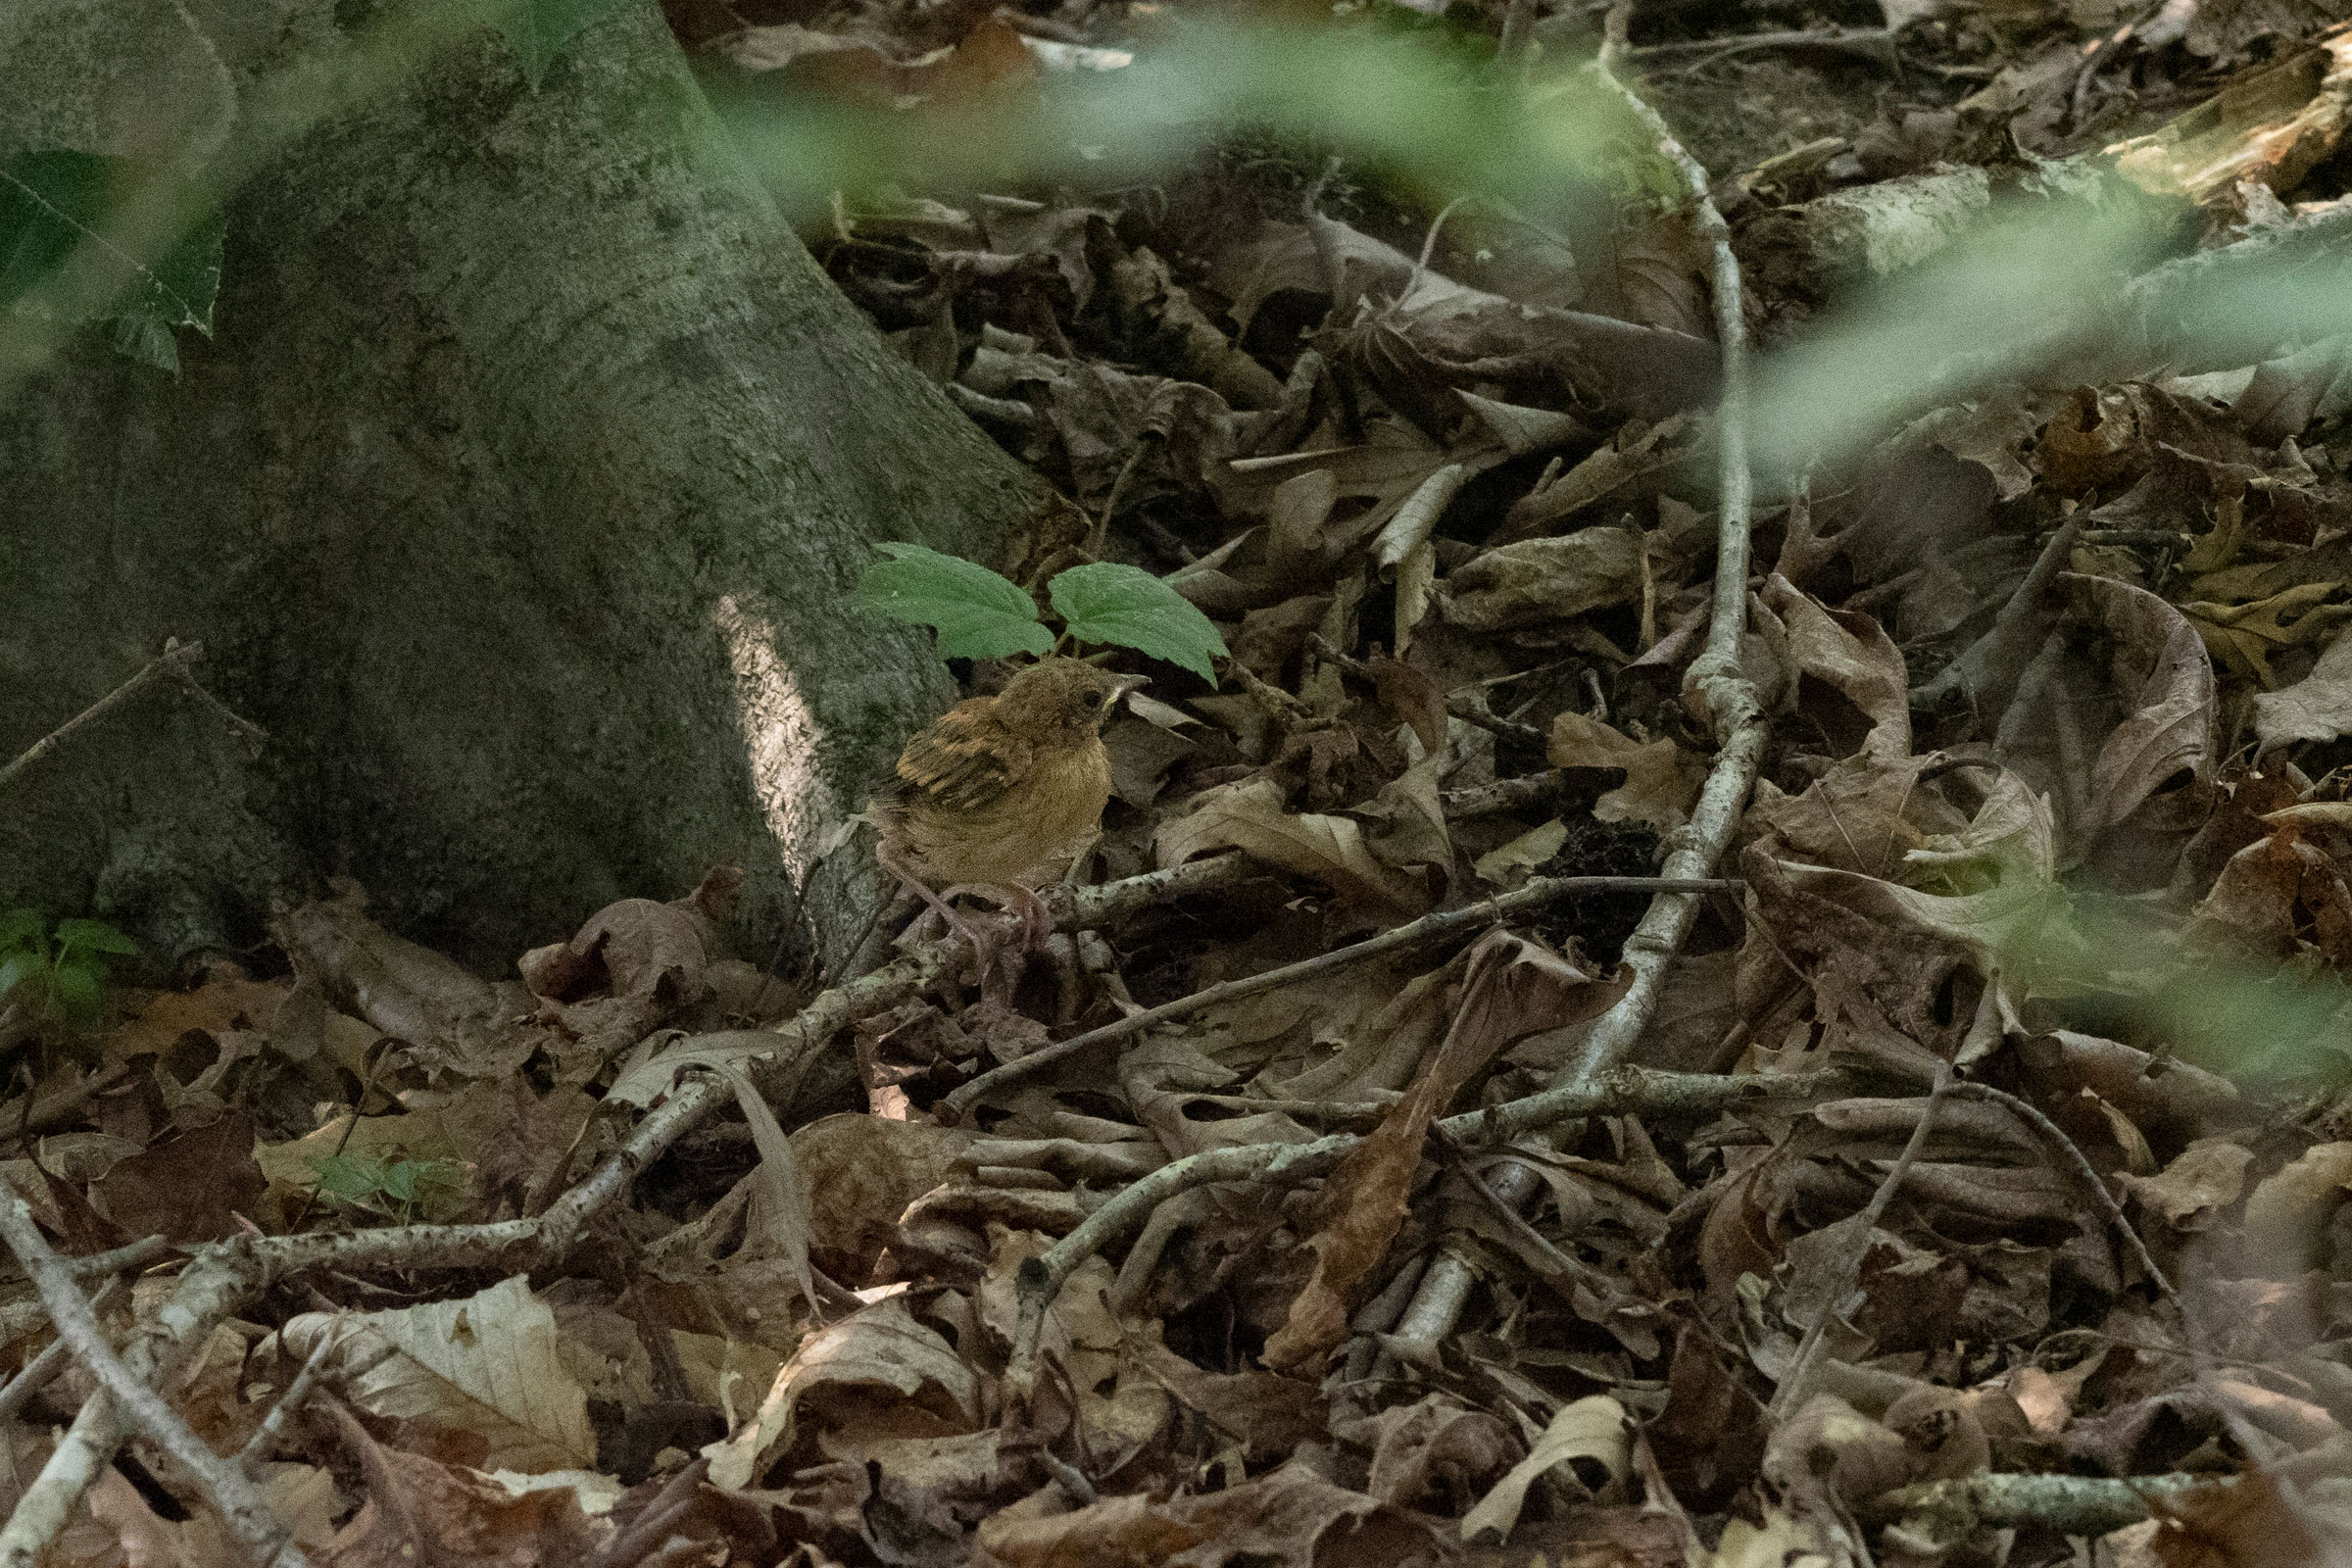
The earliest breeding evidence was recorded as an adult carrying nest material on April 17. However, breeding was confirmed primarily through observations of adults carrying food (April 28 – July 26) and recently fledged young (May 14 – August 8) (Figure 6).
For more general information on the breeding habits of this species, please refer to All About Birds.
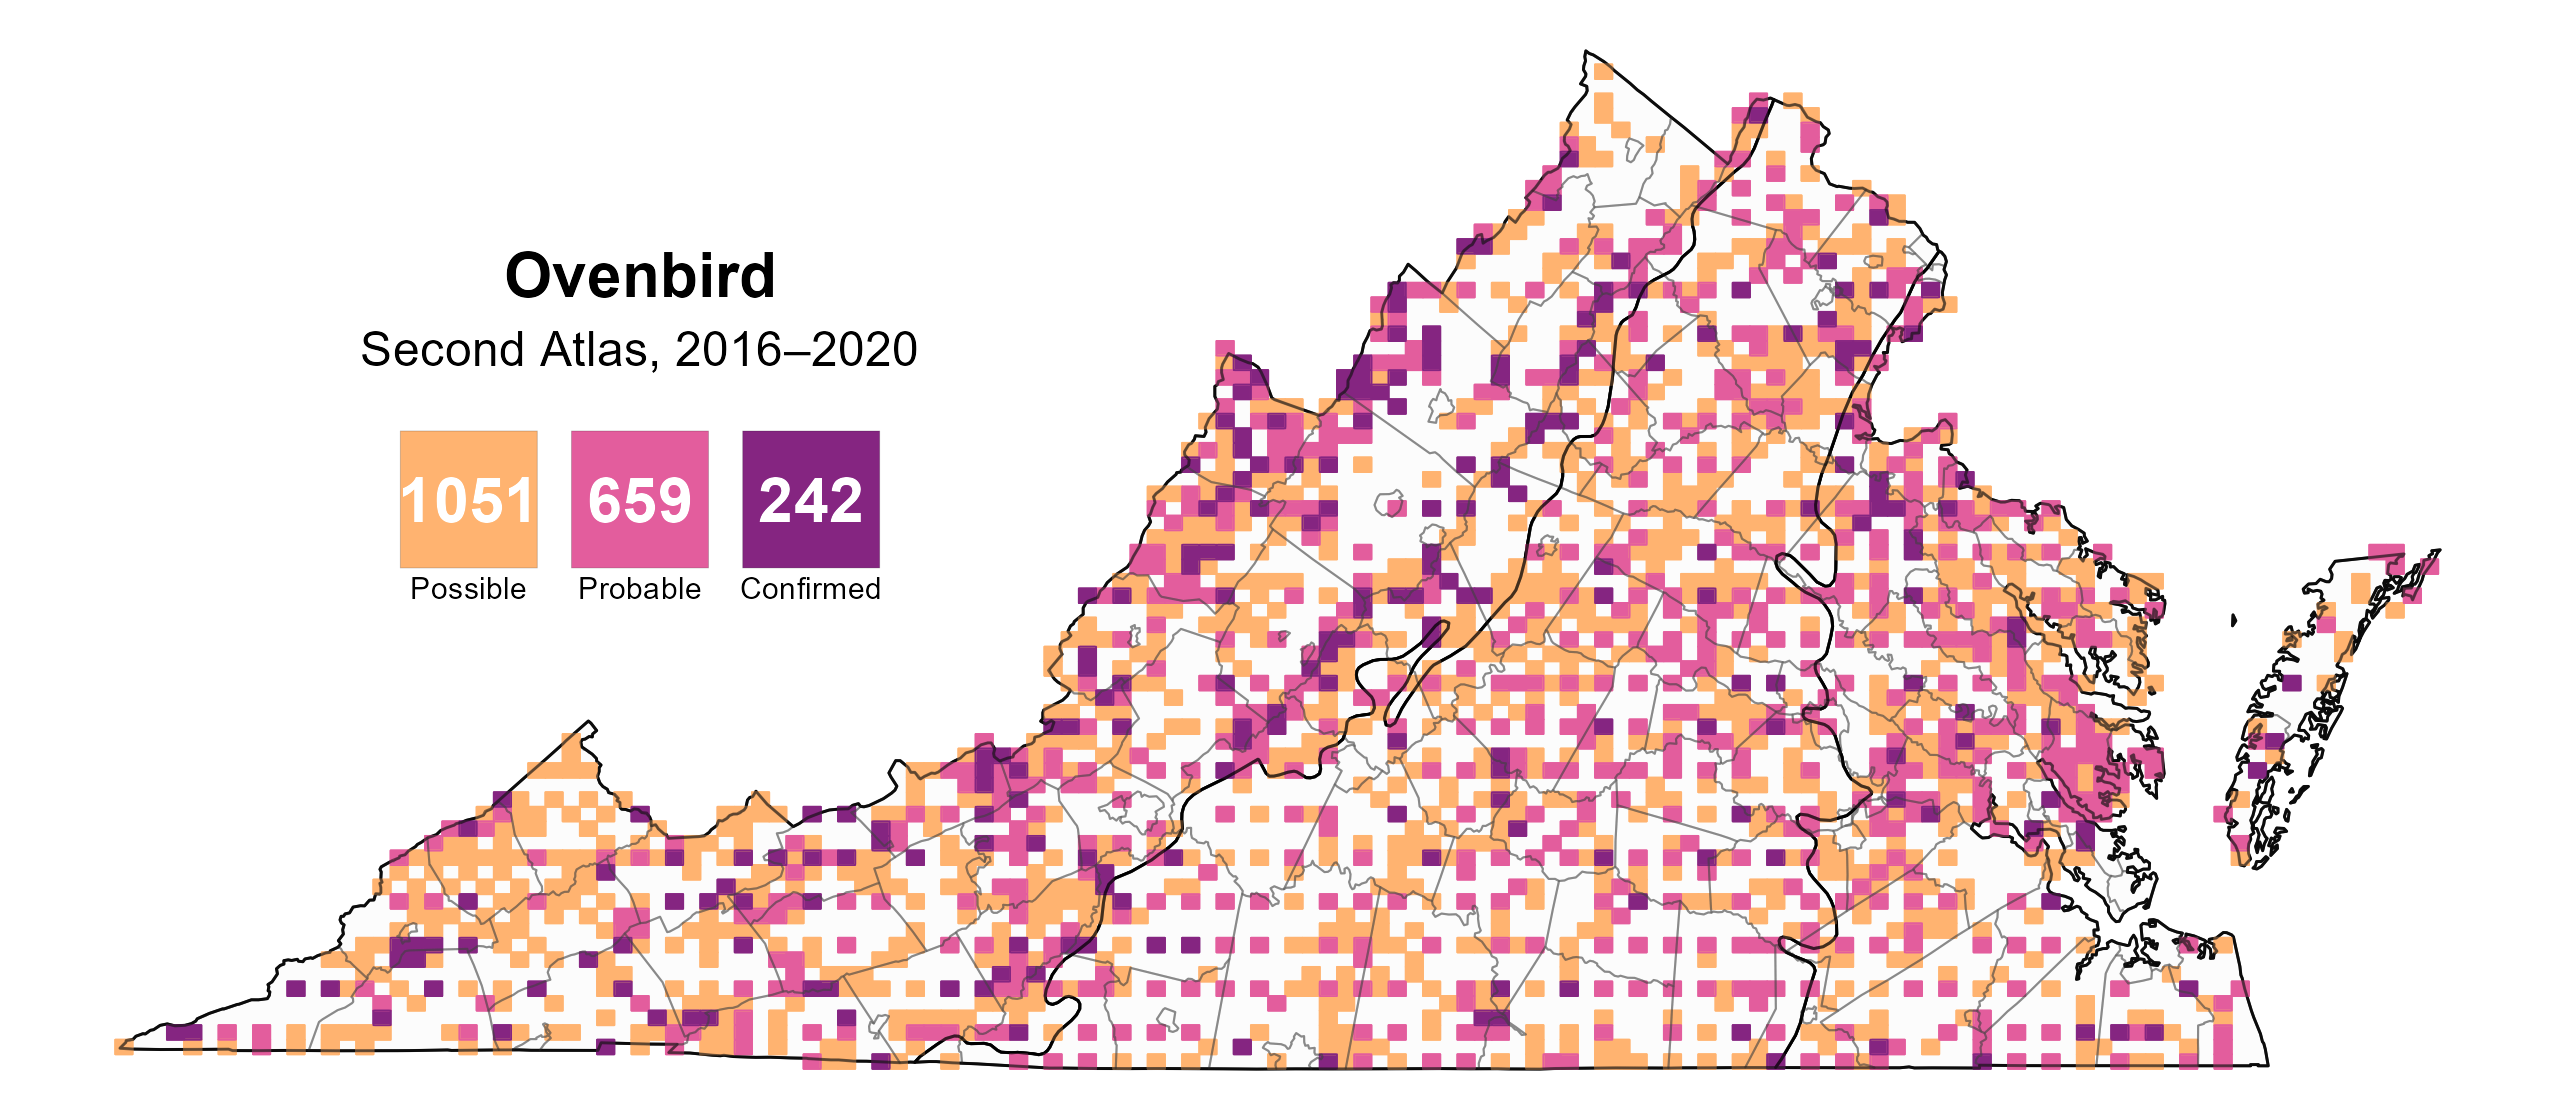
Figure 4: Ovenbird breeding observations from the Second Atlas (2016–2020). The colored boxes illustrate Atlas blocks (approximately 10 mi2 [26 km2] survey units) where the species was detected. The colors show the highest breeding category recorded in a block. The numbers within the colors in the legend correspond to the number of blocks with that breeding evidence category.

Figure 5: Ovenbird breeding observations from the First Atlas (1985–1989). The colored boxes illustrate Atlas blocks (approximately 10 mi2 [26 km2] survey units) where the species was detected. The colors show the highest breeding category recorded in a block. The numbers within the colors in the legend correspond to the number of blocks with that breeding evidence category.
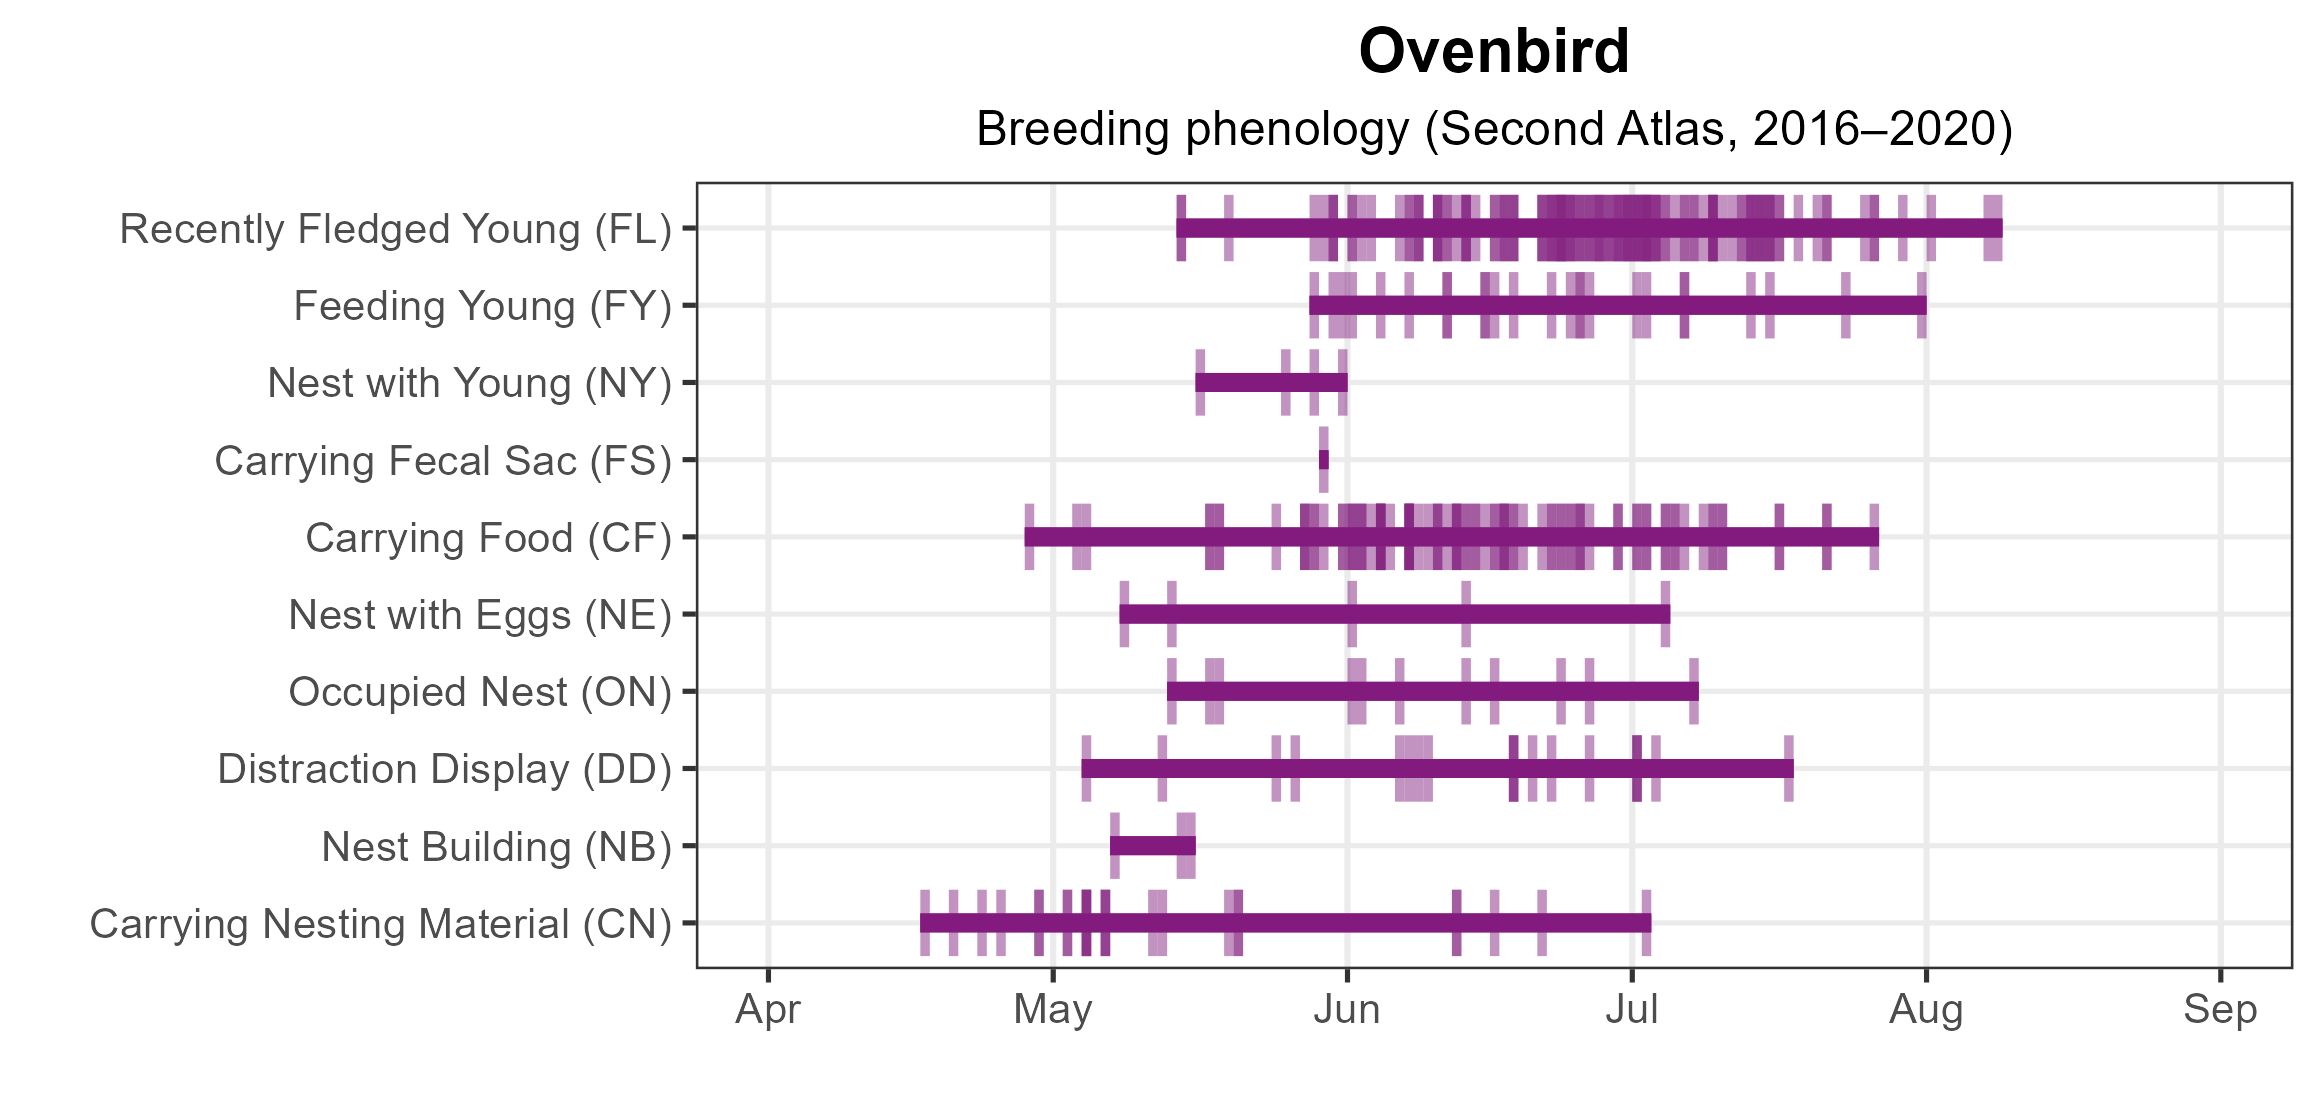
Figure 6: Ovenbird phenology: confirmed breeding codes. This graph shows a timeline of confirmed breeding behaviors. Tick marks represent individual observations of the behavior.
Population Status
Ovenbird relative abundance was estimated to be lowest near urban and agricultural areas that lack adequate forest habitat (Figure 7). For example, the Fairfax County, Richmond, the Shenandoah Valley, and Virginia Beach had much lower predicted abundance than more forested areas of the Mountains and Valleys and central Piedmont regions.
The total estimated Ovenbird population in the state is approximately 777,000 individuals (with a range between 668,000 and 905,000). Based on the North American Breeding Bird Survey (BBS), the Ovenbird population increased by a nonsignificant 0.36% annually from 1966–2022 in Virginia, and between Atlases, its population increased by a similar nonsignificant 0.52% per year from 1987–2018 (Hostetler et al. 2023; Figure 8).
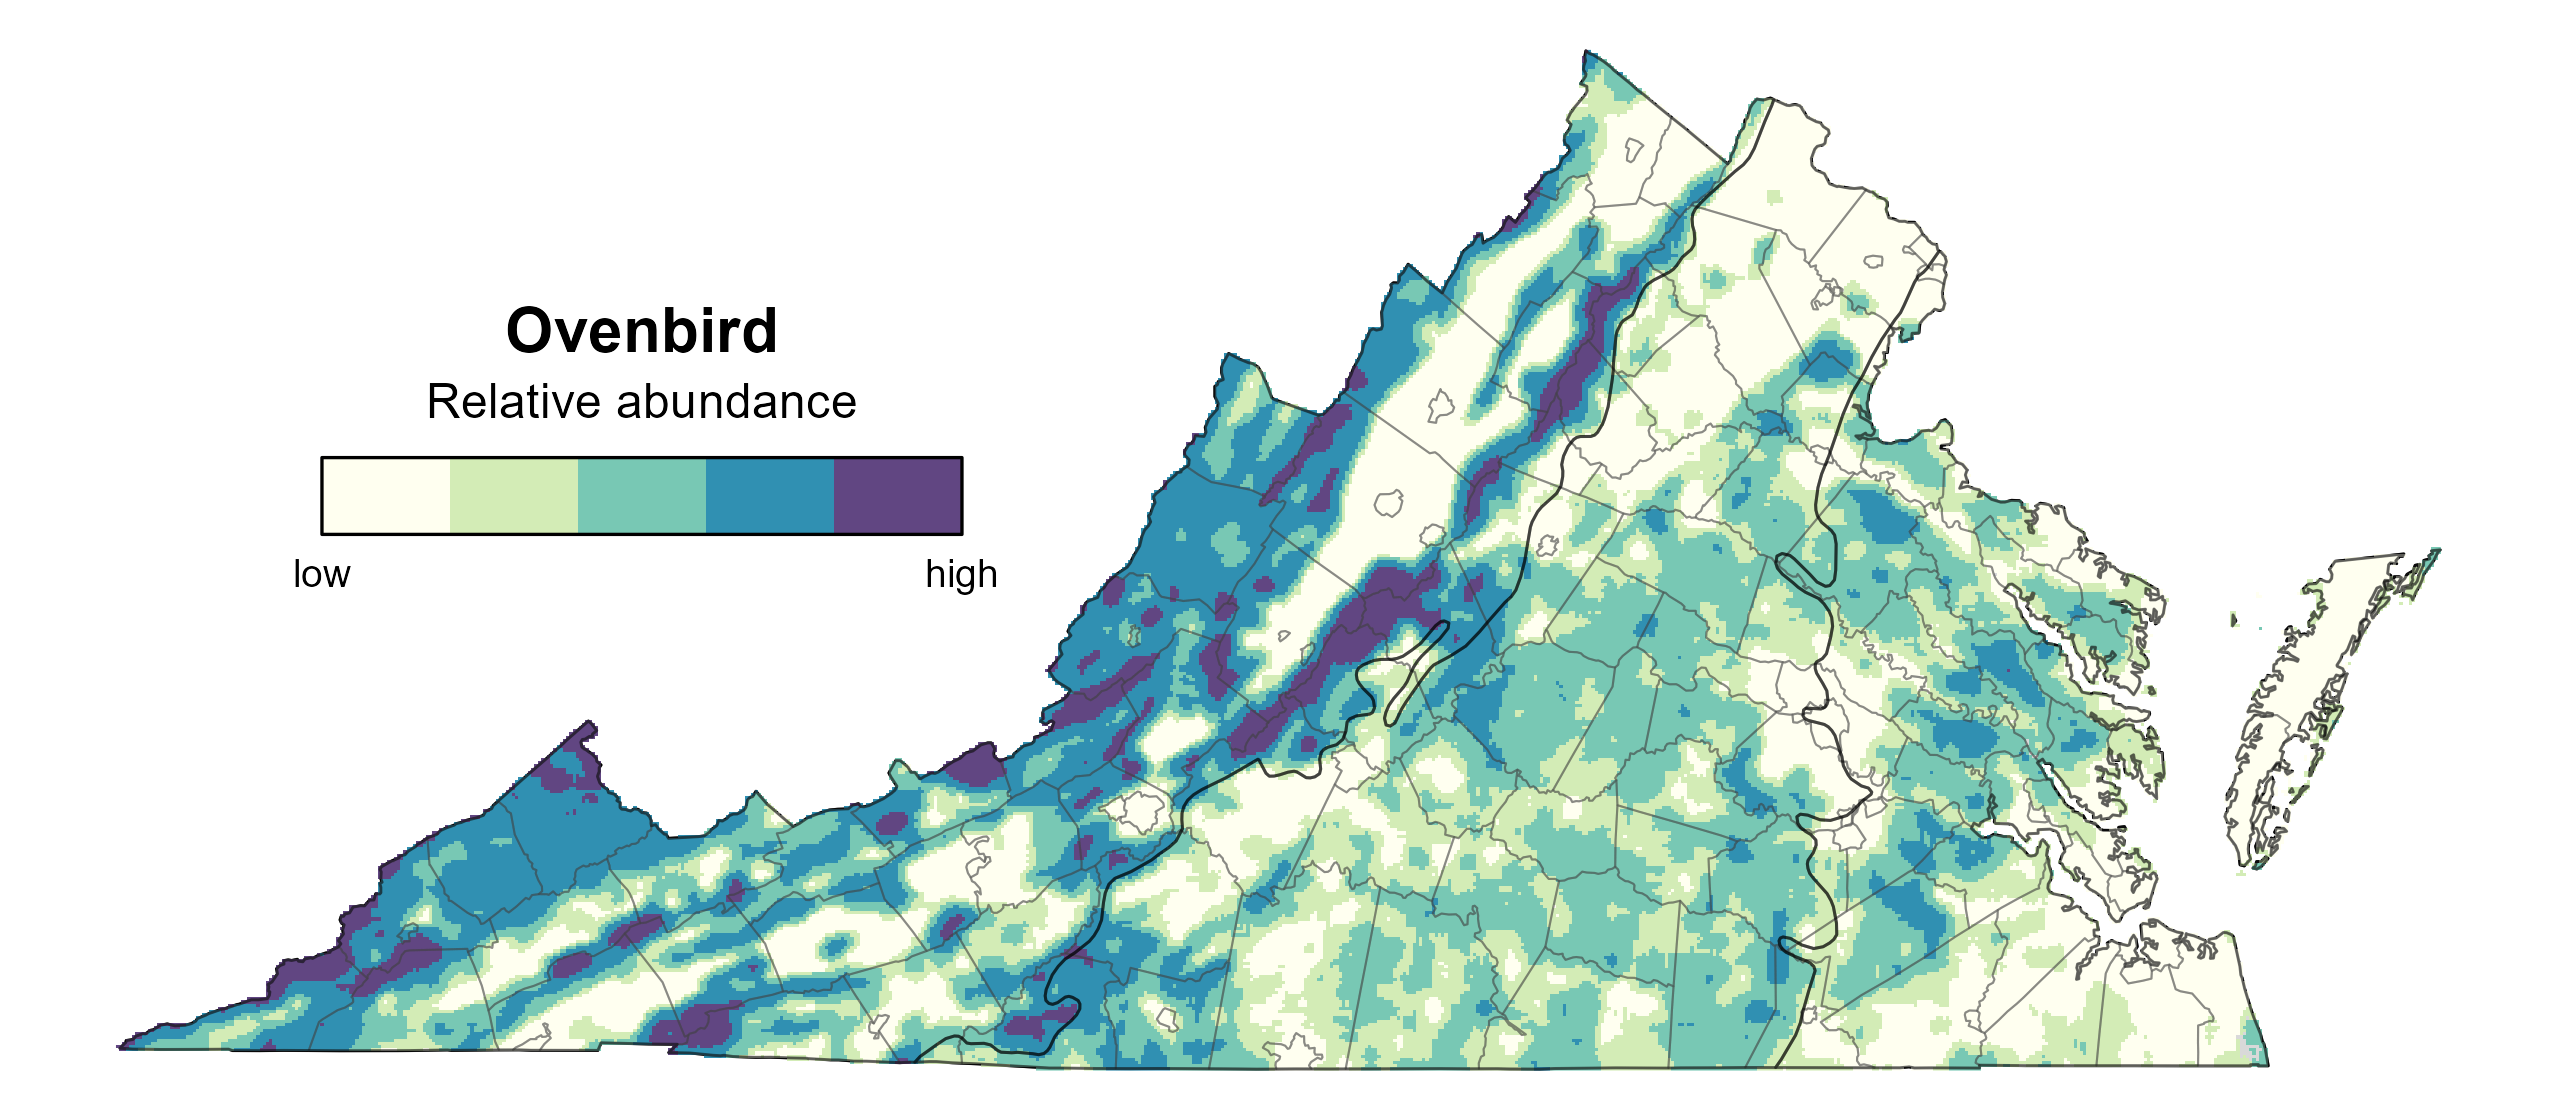
Figure 7: Ovenbird relative abundance (Second Atlas, 2016–2020). This map indicates the predicted abundance of this species at a 0.4 mi2 (1 km2) scale based on environmental (including habitat) factors. Abundance values are presented on a relative scale of low to high.
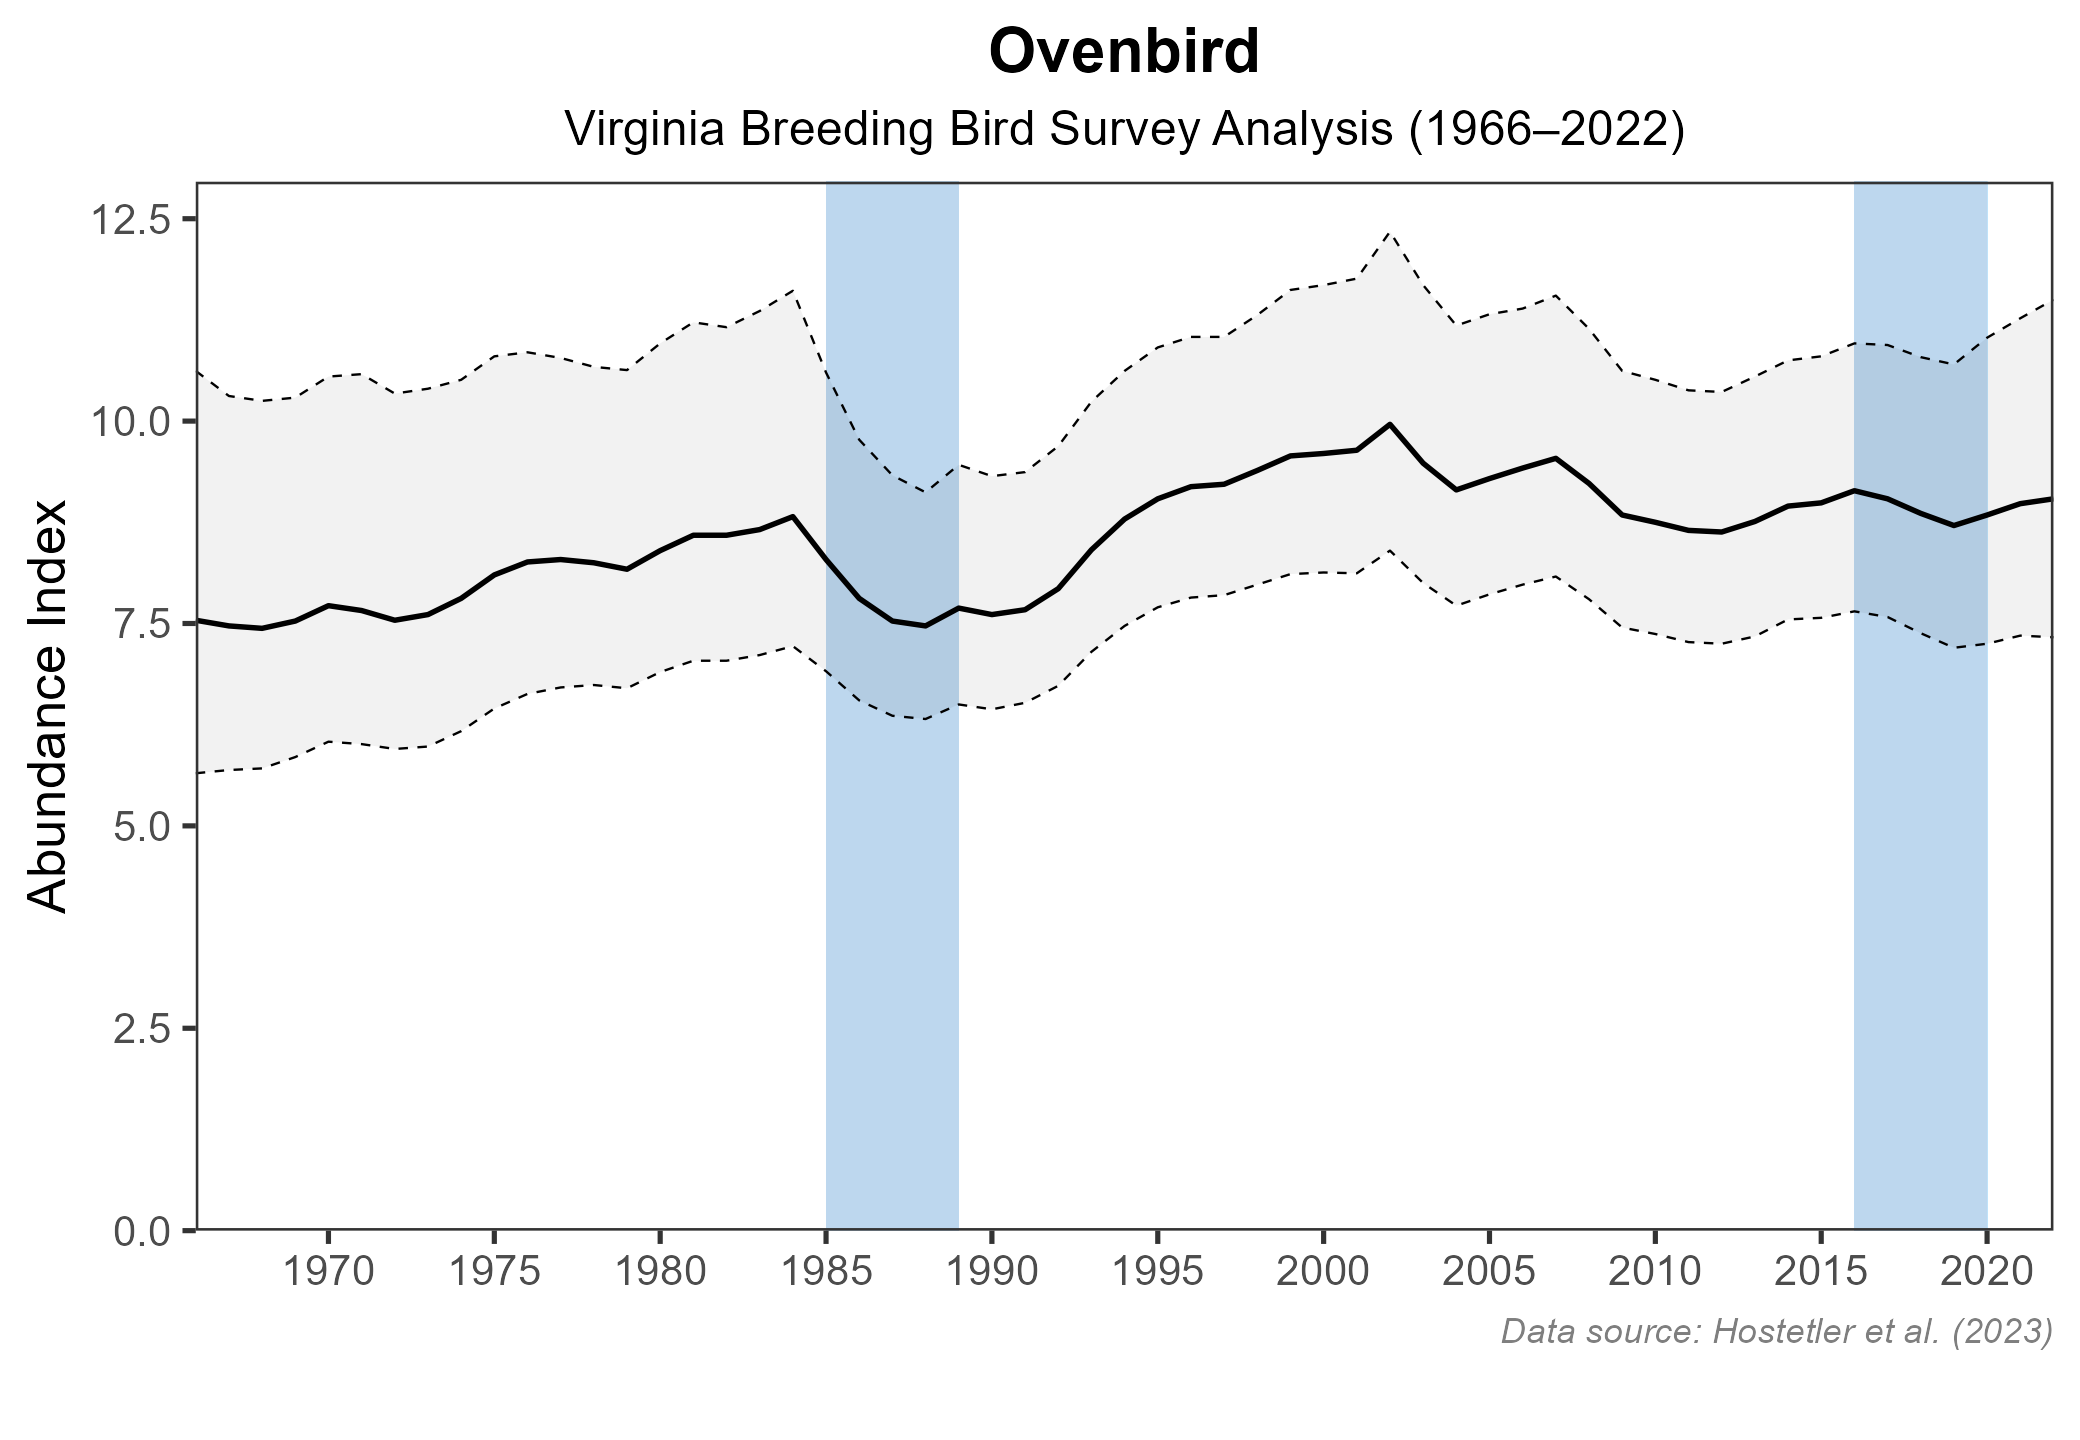
Figure 8: Ovenbird population trend for Virginia as estimated by the North American Breeding Bird Survey. The vertical axis shows species abundance; the horizontal axis shows the year. The solid line indicates the estimated population trend; there is a 97.5% probability that the true population trend falls between the dashed lines. The shaded bars indicate the First and Second Atlas periods.
Conservation
Ovenbirds are common and widespread throughout Virginia and their range, but their sensitivity to fragmentation and other human landscape modifications have led them to be a model species for migratory bird conservation (Porneluzi el al. 2020).
Interactive Map
The interactive map contains up to six Atlas layers (probability of occurrence for the First and Second Atlases, change in probability of occurrence between Atlases, breeding evidence for the First and Second Atlases, and abundance for the Second Atlas) that can be viewed one at a time. To view an Atlas map layer, mouse over the layer box in the upper left. County lines and physiographic regional boundaries (Mountains and Valleys, Piedmont, and Coastal Plain) can be turned on and off by checking or unchecking the box below the layer box. Within the map window, users can hover on a block to see its value for each layer and pan and zoom to see roads, towns, and other features of interest that are visible beneath a selected layer.
View Interactive Map in Full Screen
References
Hostetler, J. A., J. R. Sauer, J. E. Hines, D. Ziolkowski, and M. Lutmerding (2023). The North American breeding bird survey, analysis results 1966–2022. U.S. Geological Survey, Laurel, MD, USA. https://doi.org/10.5066/P9SC7T11.
Porneluzi, P., M. A. Van Horn, and T. M. Donovan (2020). Ovenbird (Seiurus aurocapilla), version 1.0. In Birds of the World (A. F. Poole, Editor). Cornell Lab of Ornithology, Ithaca, NY, USA. https://doi.org/10.2173/bow.ovenbi1.01.