Introduction
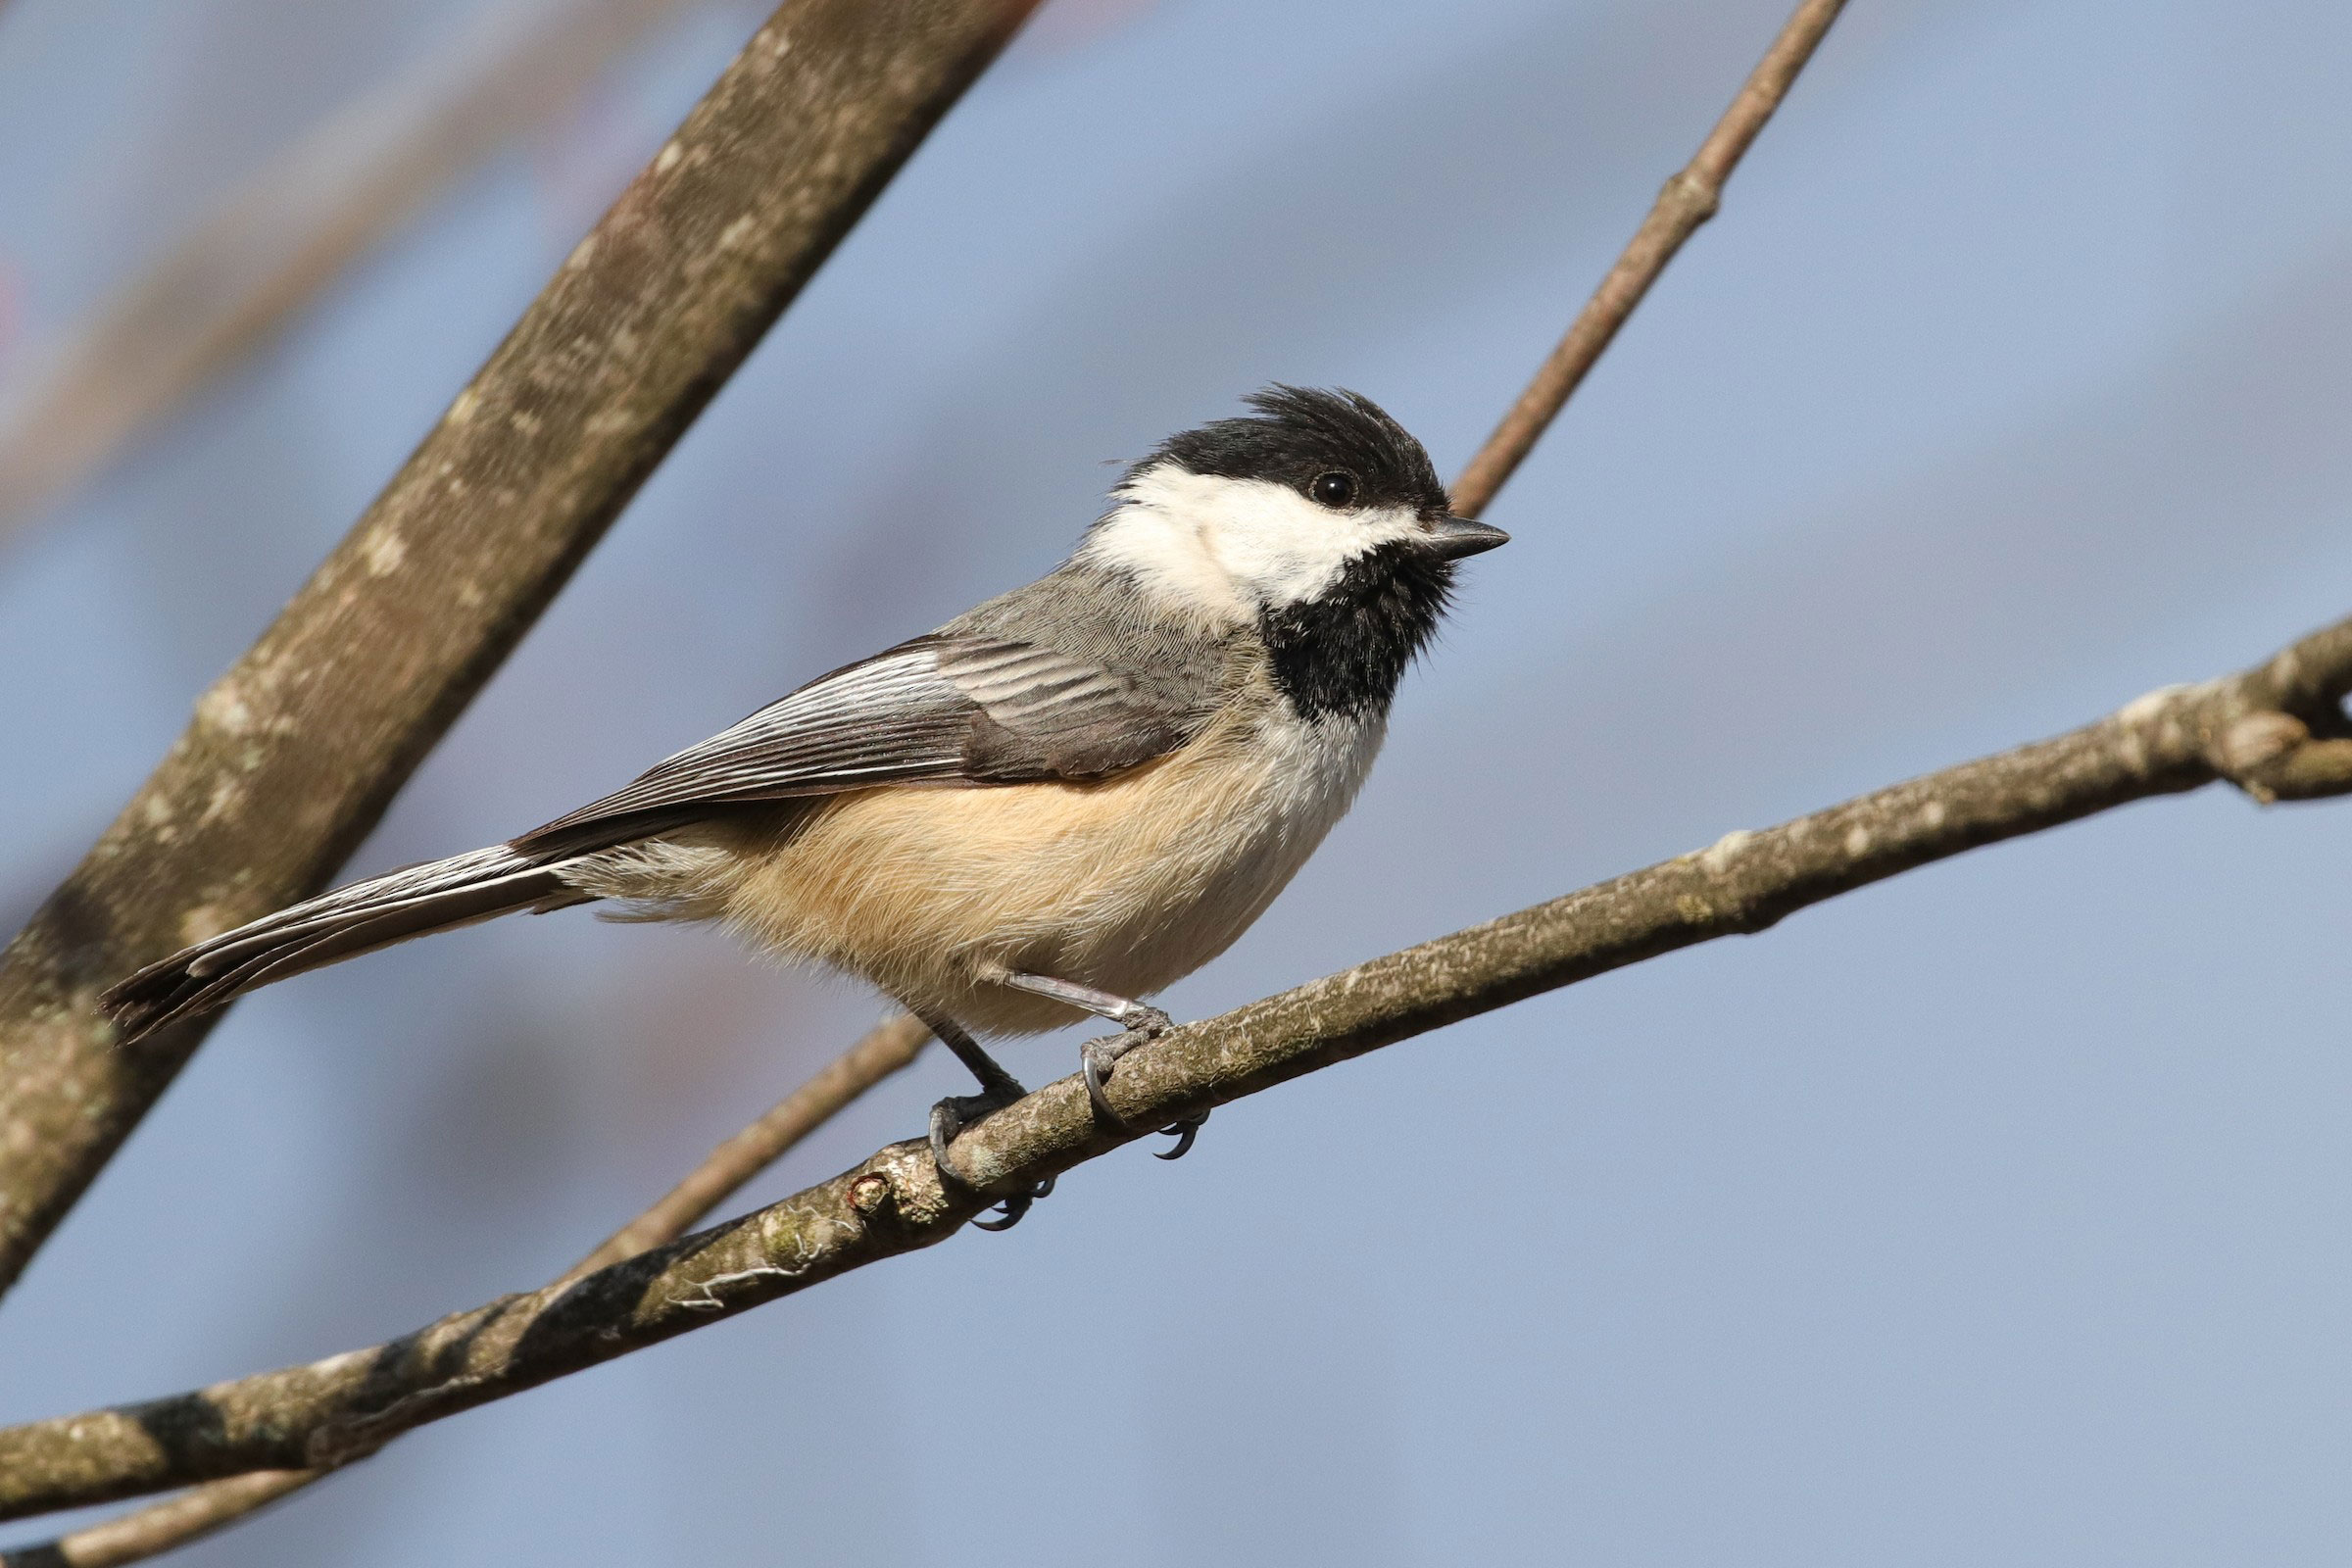
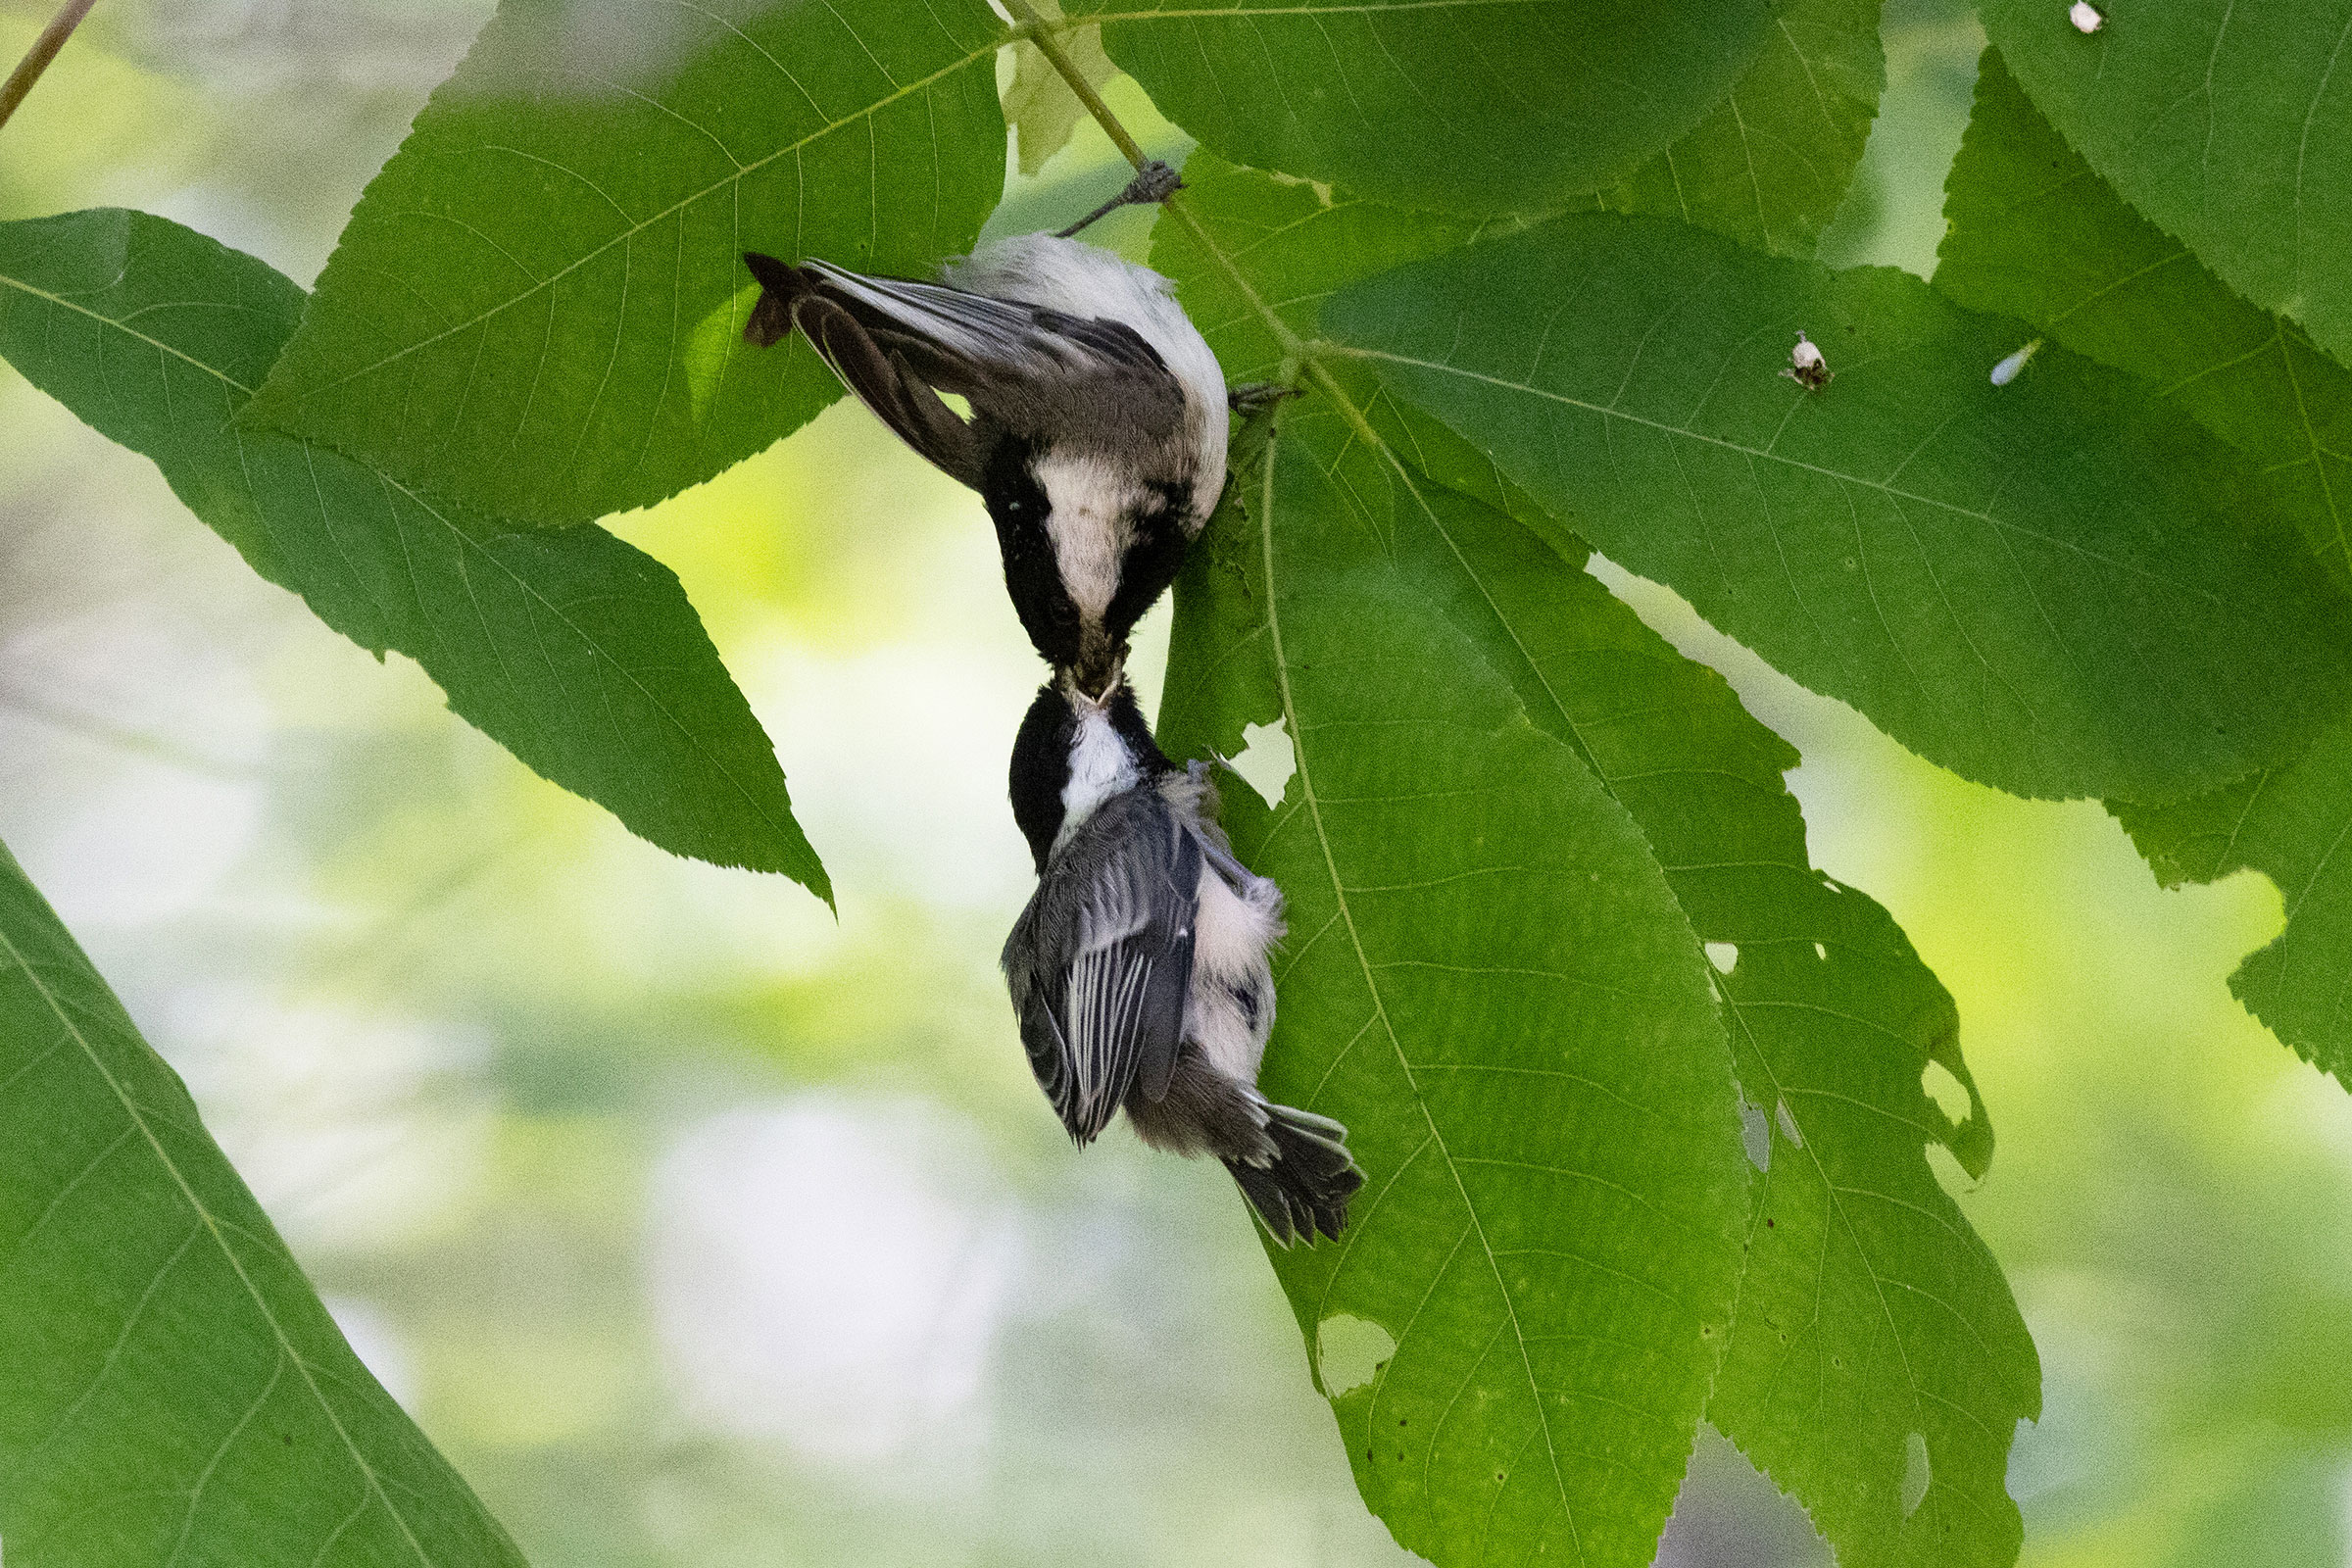
The Black-capped Chickadee is well known for its ability to remember the locations of thousands of seeds that it has cached for winter food. In Virginia, this species can be easily confused with its “look-alike species,” the Carolina Chickadee (Poecile carolinensis). In other areas, they can be distinguished based on song, but here, this approach is less useful because chickadees learn vocalizations and will adopt and sing the songs of other species. This is a problem because there is a hybridization zone (where the western edge of the Shenandoah Mountains reaches the first ridge of the Appalachians) where Black-capped Chickadees and Carolina Chickadees overlap (Rottenborn and Brinkley 2007). Given the hybridization zone, location is also not always a reliable identification tool. Thus, the challenges to correctly identifying Black-capped Chickadees make understanding their abundance and distribution in the state difficult (Rottenborn and Brinkley 2007).
Breeding Distribution
Blacked-capped Chickadees are found only within the Mountains and Valleys region and are most likely to occur along forested ridges (Figure 1). Accordingly, Black-capped Chickadee likelihood of occurring increases as elevation, evergreen shrub cover, and forest cover increase in a block. There is a slight negative association between their occurrence and forest edge habitat, which could indicate a preference for more contiguous forest.
Between the First and Second Atlases (Figures 1 and 2), there was little change in the predicted occurrence of the Black-capped Chickadee (Figure 3).
View Environmental Associations
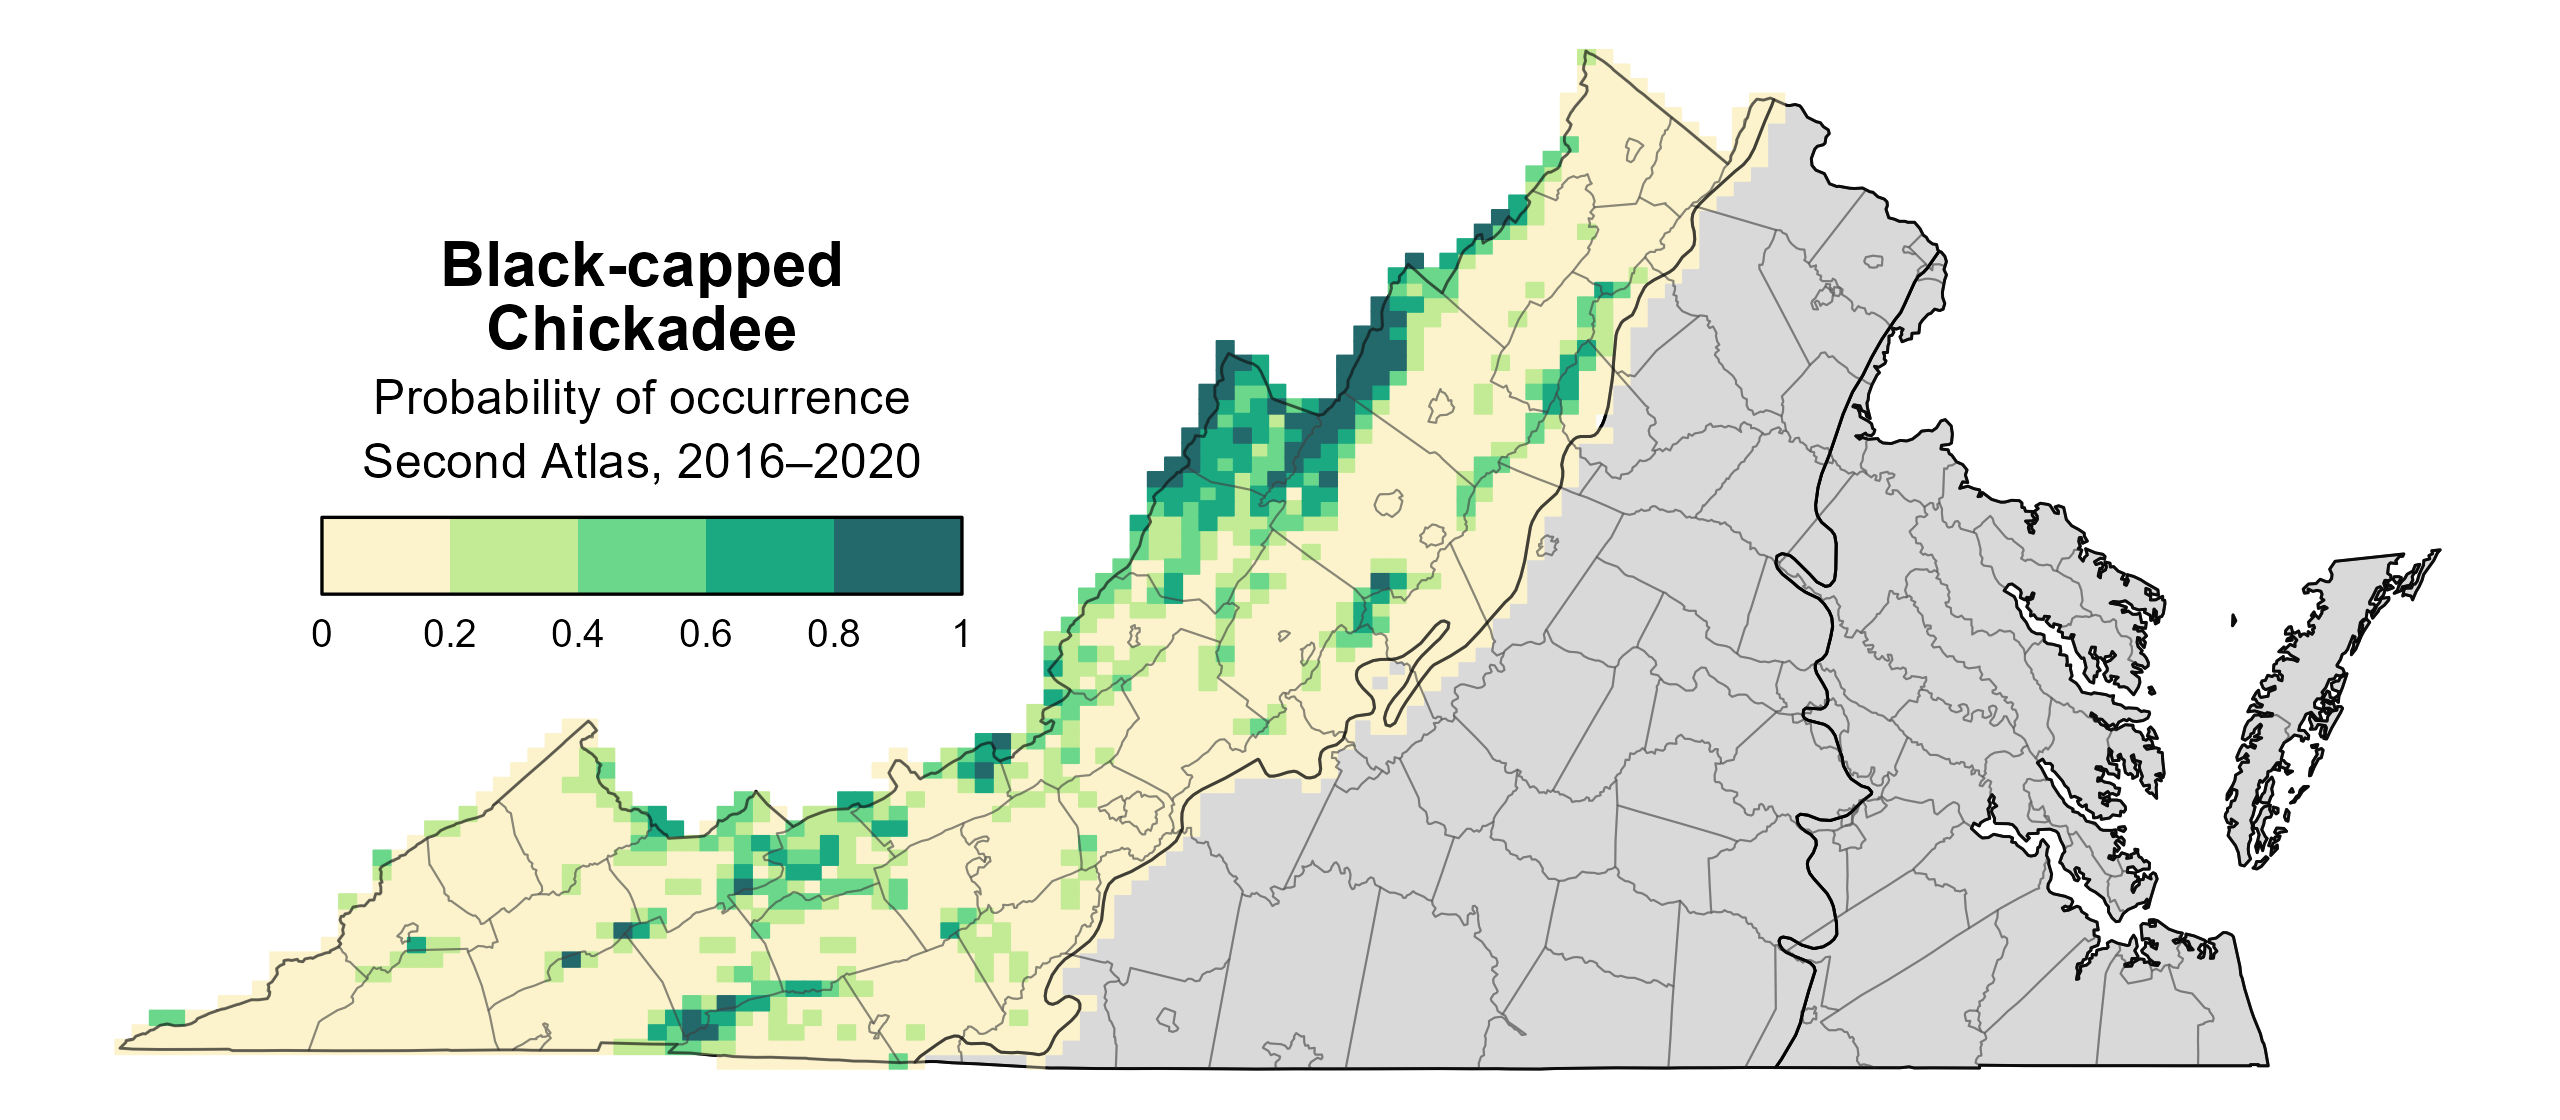
Figure 1: Black-capped Chickadee breeding distribution based on probability of occurrence (Second Atlas, 2016–2020). This map indicates the probability that this species will occur in an Atlas block (an approximately 10 mi2 [26 km2] survey unit) based on environmental (including habitat) factors and after adjusting for the probability of detection (variation in survey effort among blocks). Blocks in gray are outside the species’ core range and were not modeled.
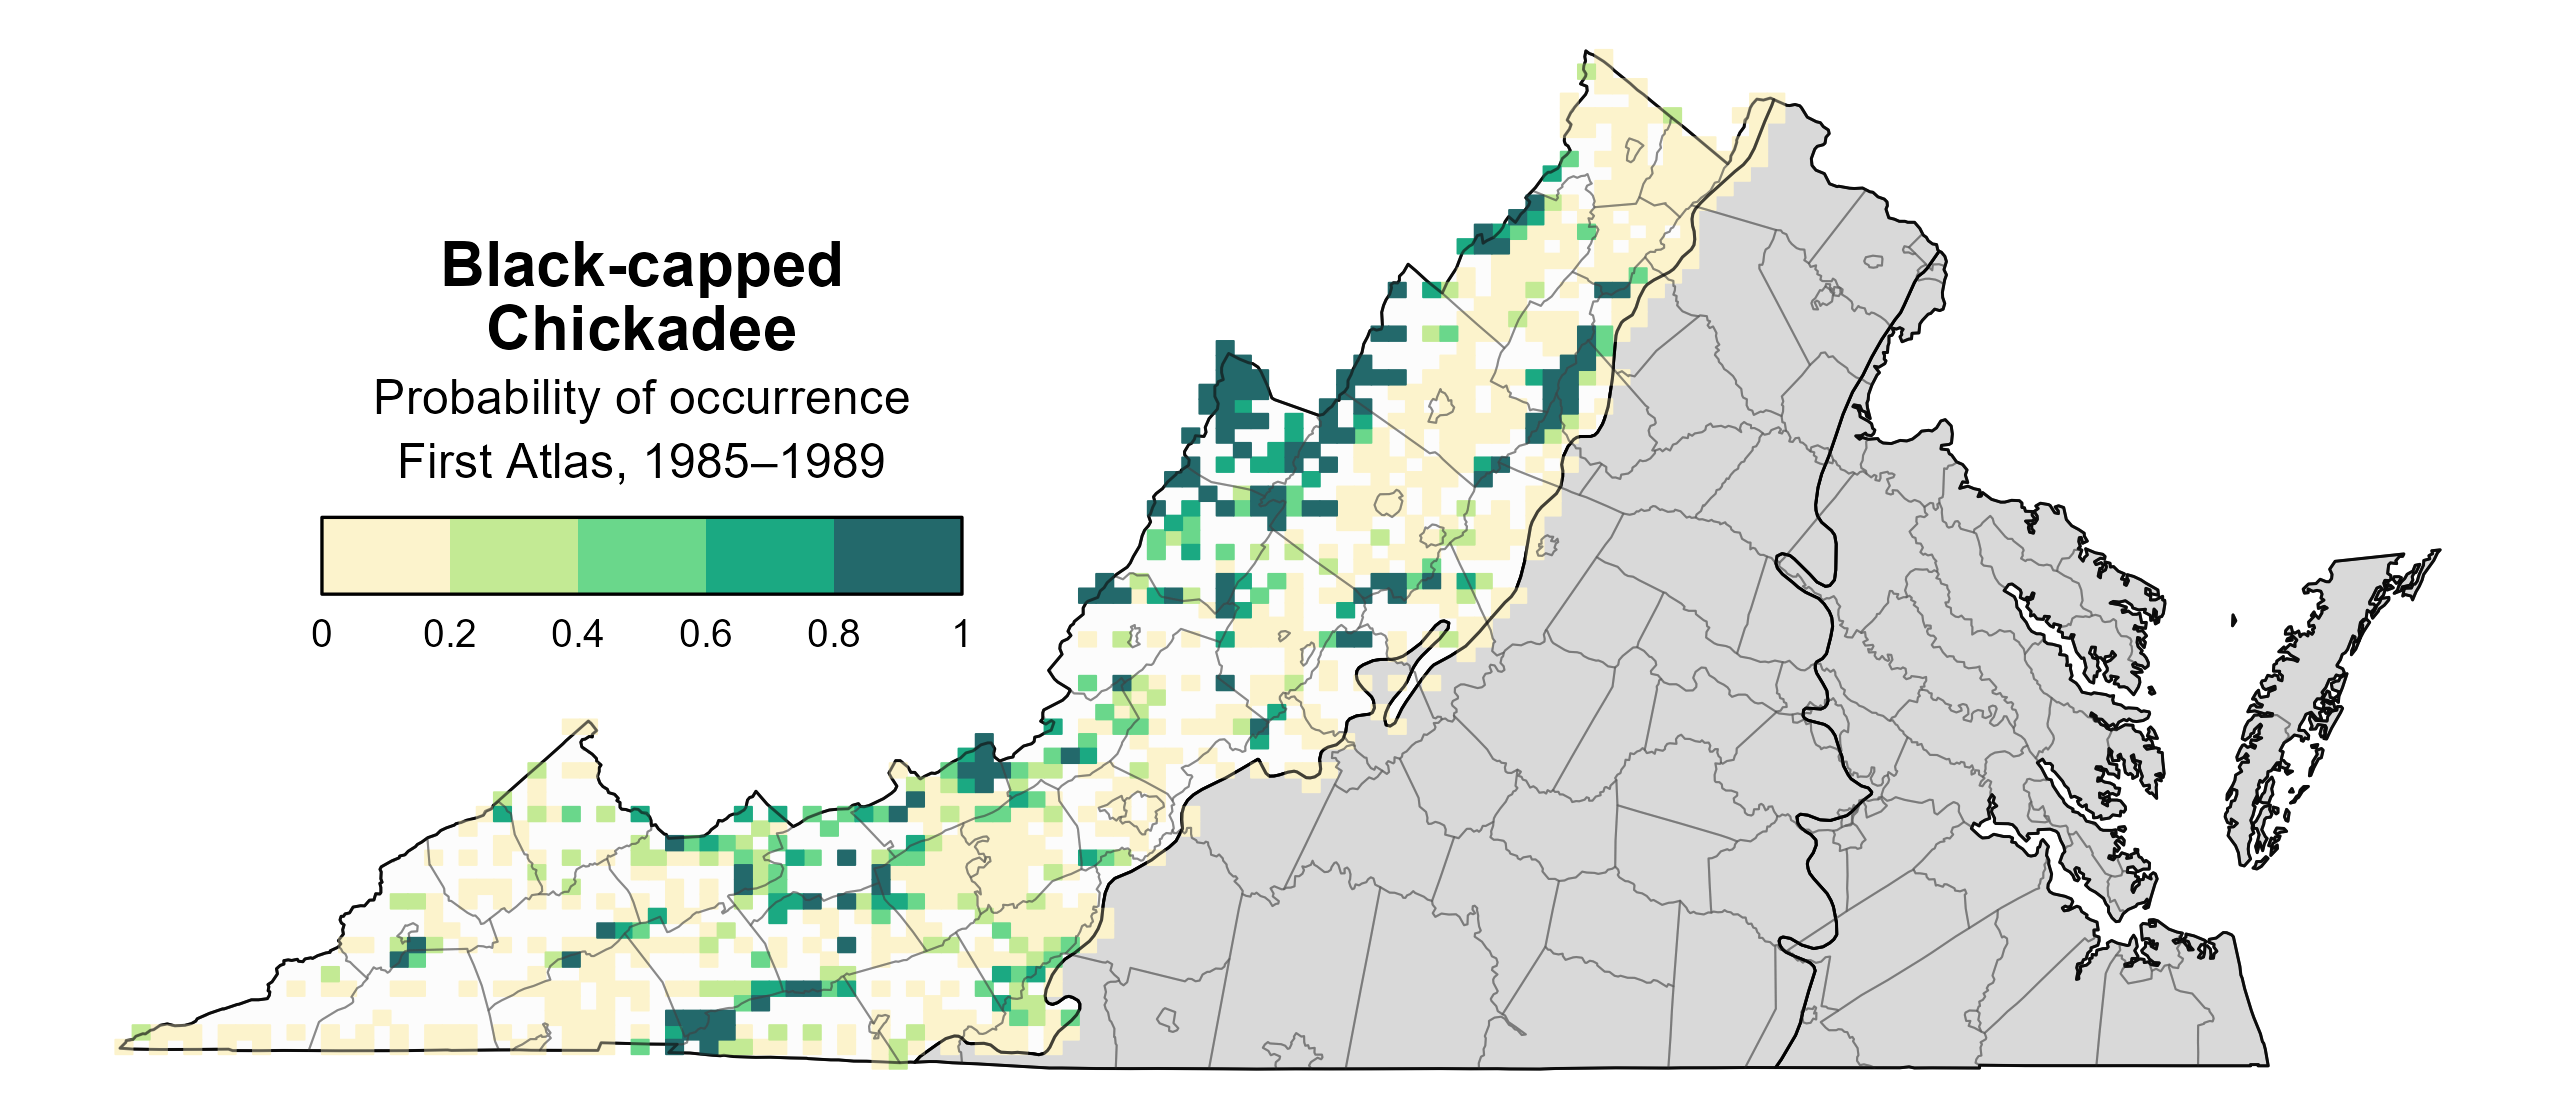
Figure 2: Black-capped Chickadee breeding distribution based on probability of occurrence (First Atlas, 1985–1989). This map indicates the probability that this species will occur in an Atlas block (an approximately 10 mi2 [26 km2] survey unit) based on environmental (including habitat) factors and after adjusting for the probability of detection (variation in survey effort among blocks). Blocks in white were not surveyed during the First Atlas and were not modeled. Blocks in gray are outside the species’ core range and were not modeled.
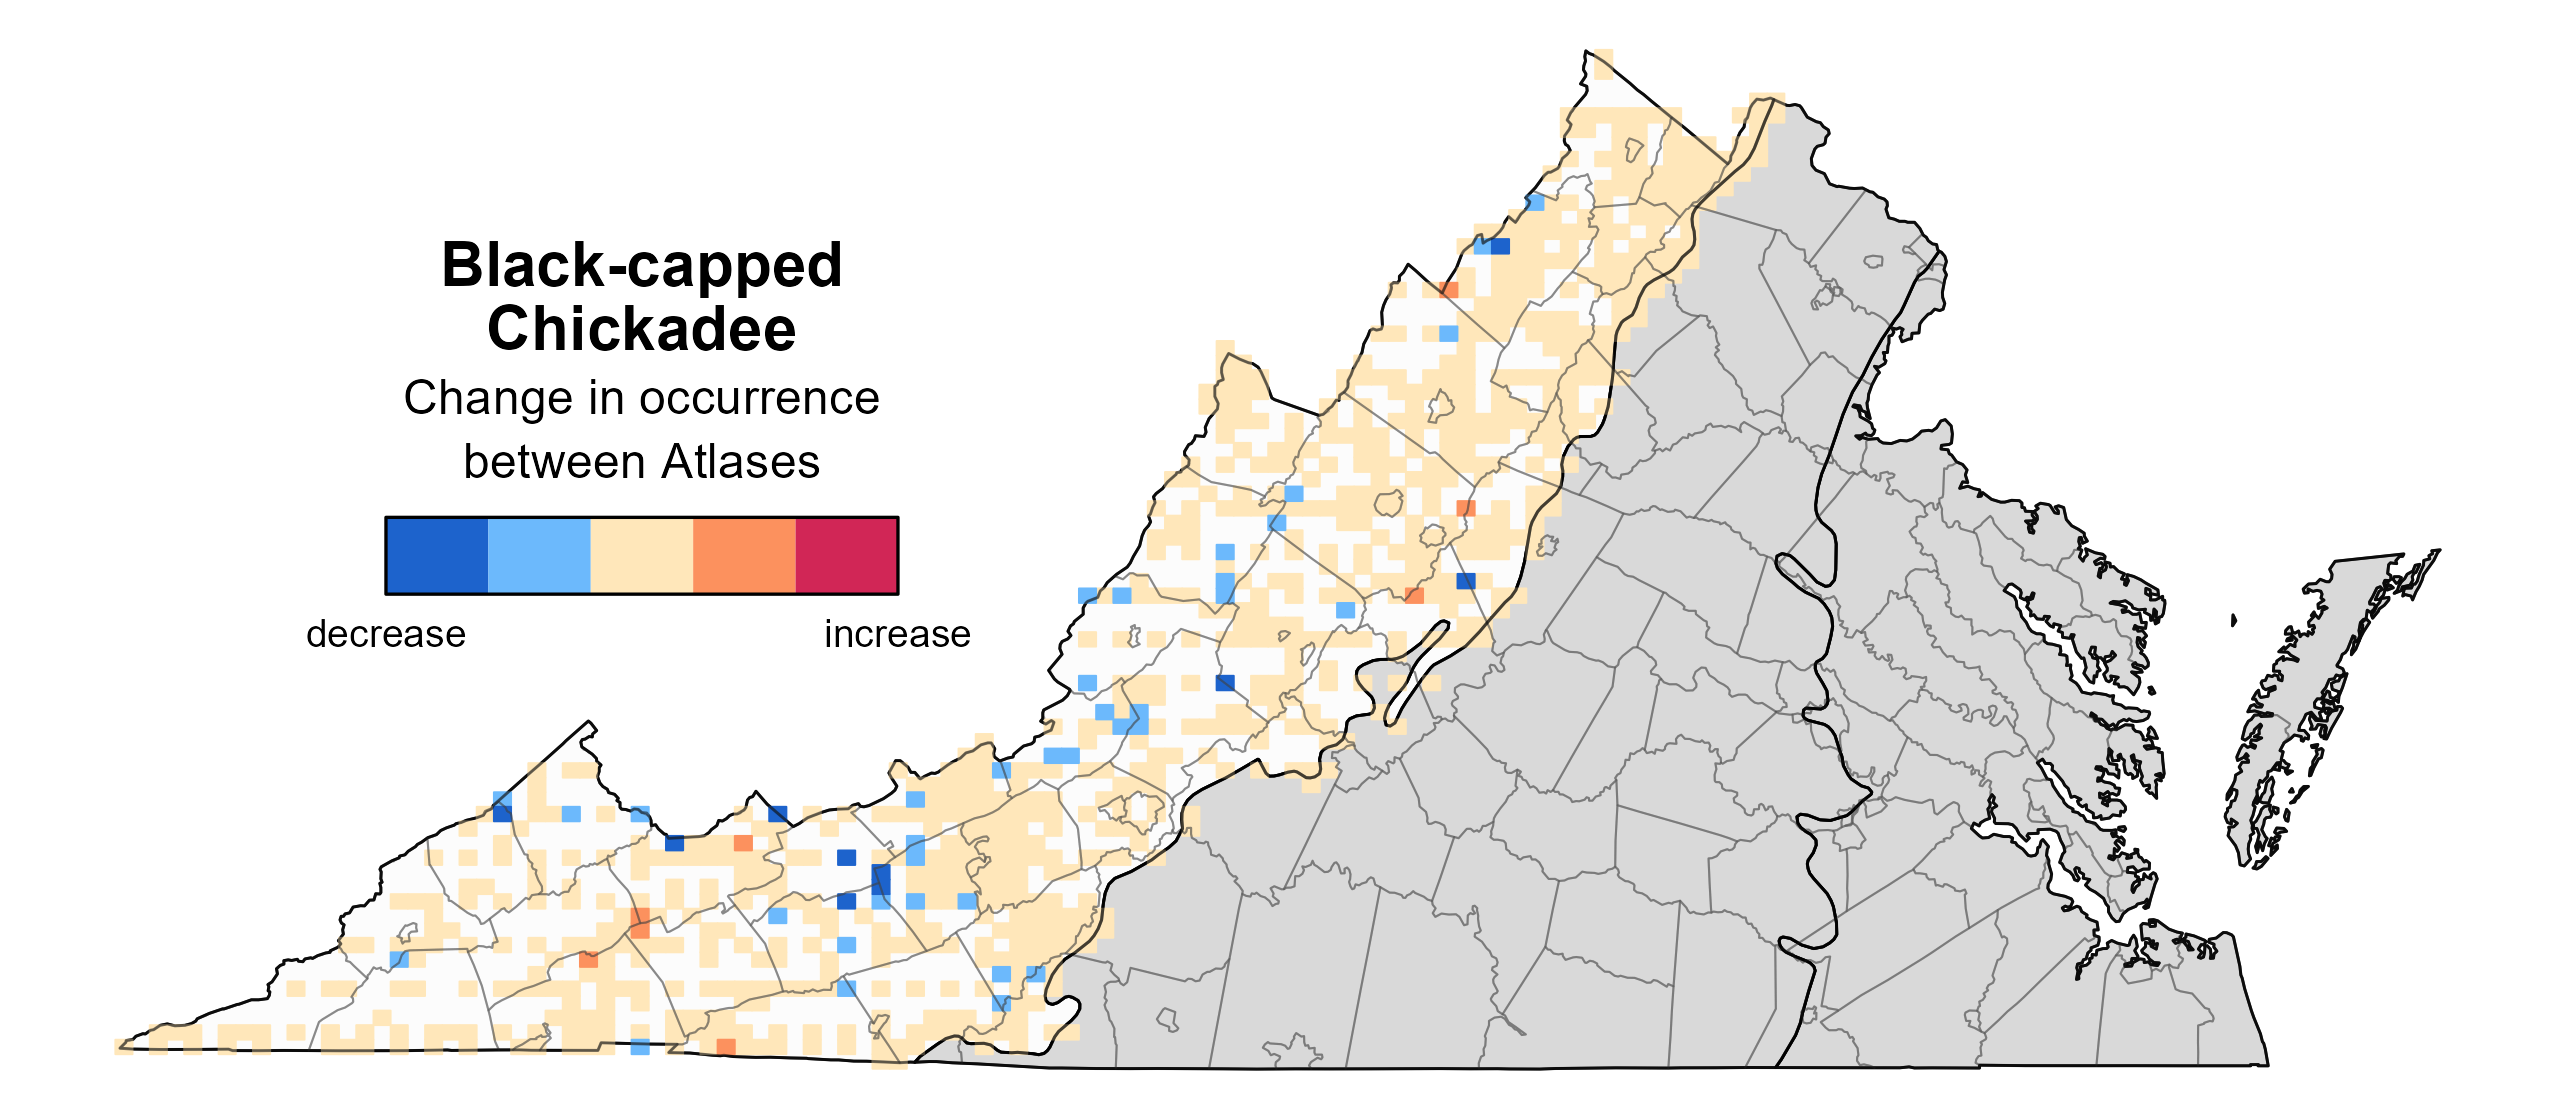
Figure 3: Black-capped Chickadee change in breeding distribution between Atlases (1985–1989 and 2016–2020) based on probability of occurrence. This map indicates the change in the probability that this species will occur in a block (an approximately 10 mi2 [26 km2] survey unit) between Atlas periods. Blocks with no change (tan) may have constant presence or constant absence. Blocks in white were not surveyed during the First Atlas so were not modeled. Blocks in gray are outside the species’ core range and were not modeled.
Breeding Evidence
Black-capped Chickadees were confirmed breeders in 48 blocks and seven counties (Alleghany, Augusta, Bath, Bland, Grayson, Highland, and Shenandoah) and found to probable breeders in an additional county (Smyth) (Figure 4). Although fewer detections were recorded during the First Atlas, which was likely due to less survey effort, a similar pattern of detections was observed between Atlas periods (Figures 4 and 5).
The earliest breeding evidence for Black-capped Chickadees was a nest with eggs on April 17. However, breeding was primarily confirmed through observation of adults carrying food (May 2 – July 24), adults feeding young (May 21 – August 4), and recently fledged young (May 22 – July 30) (Figure 6).
For more general information on the breeding habits of this species, please refer to All About Birds.
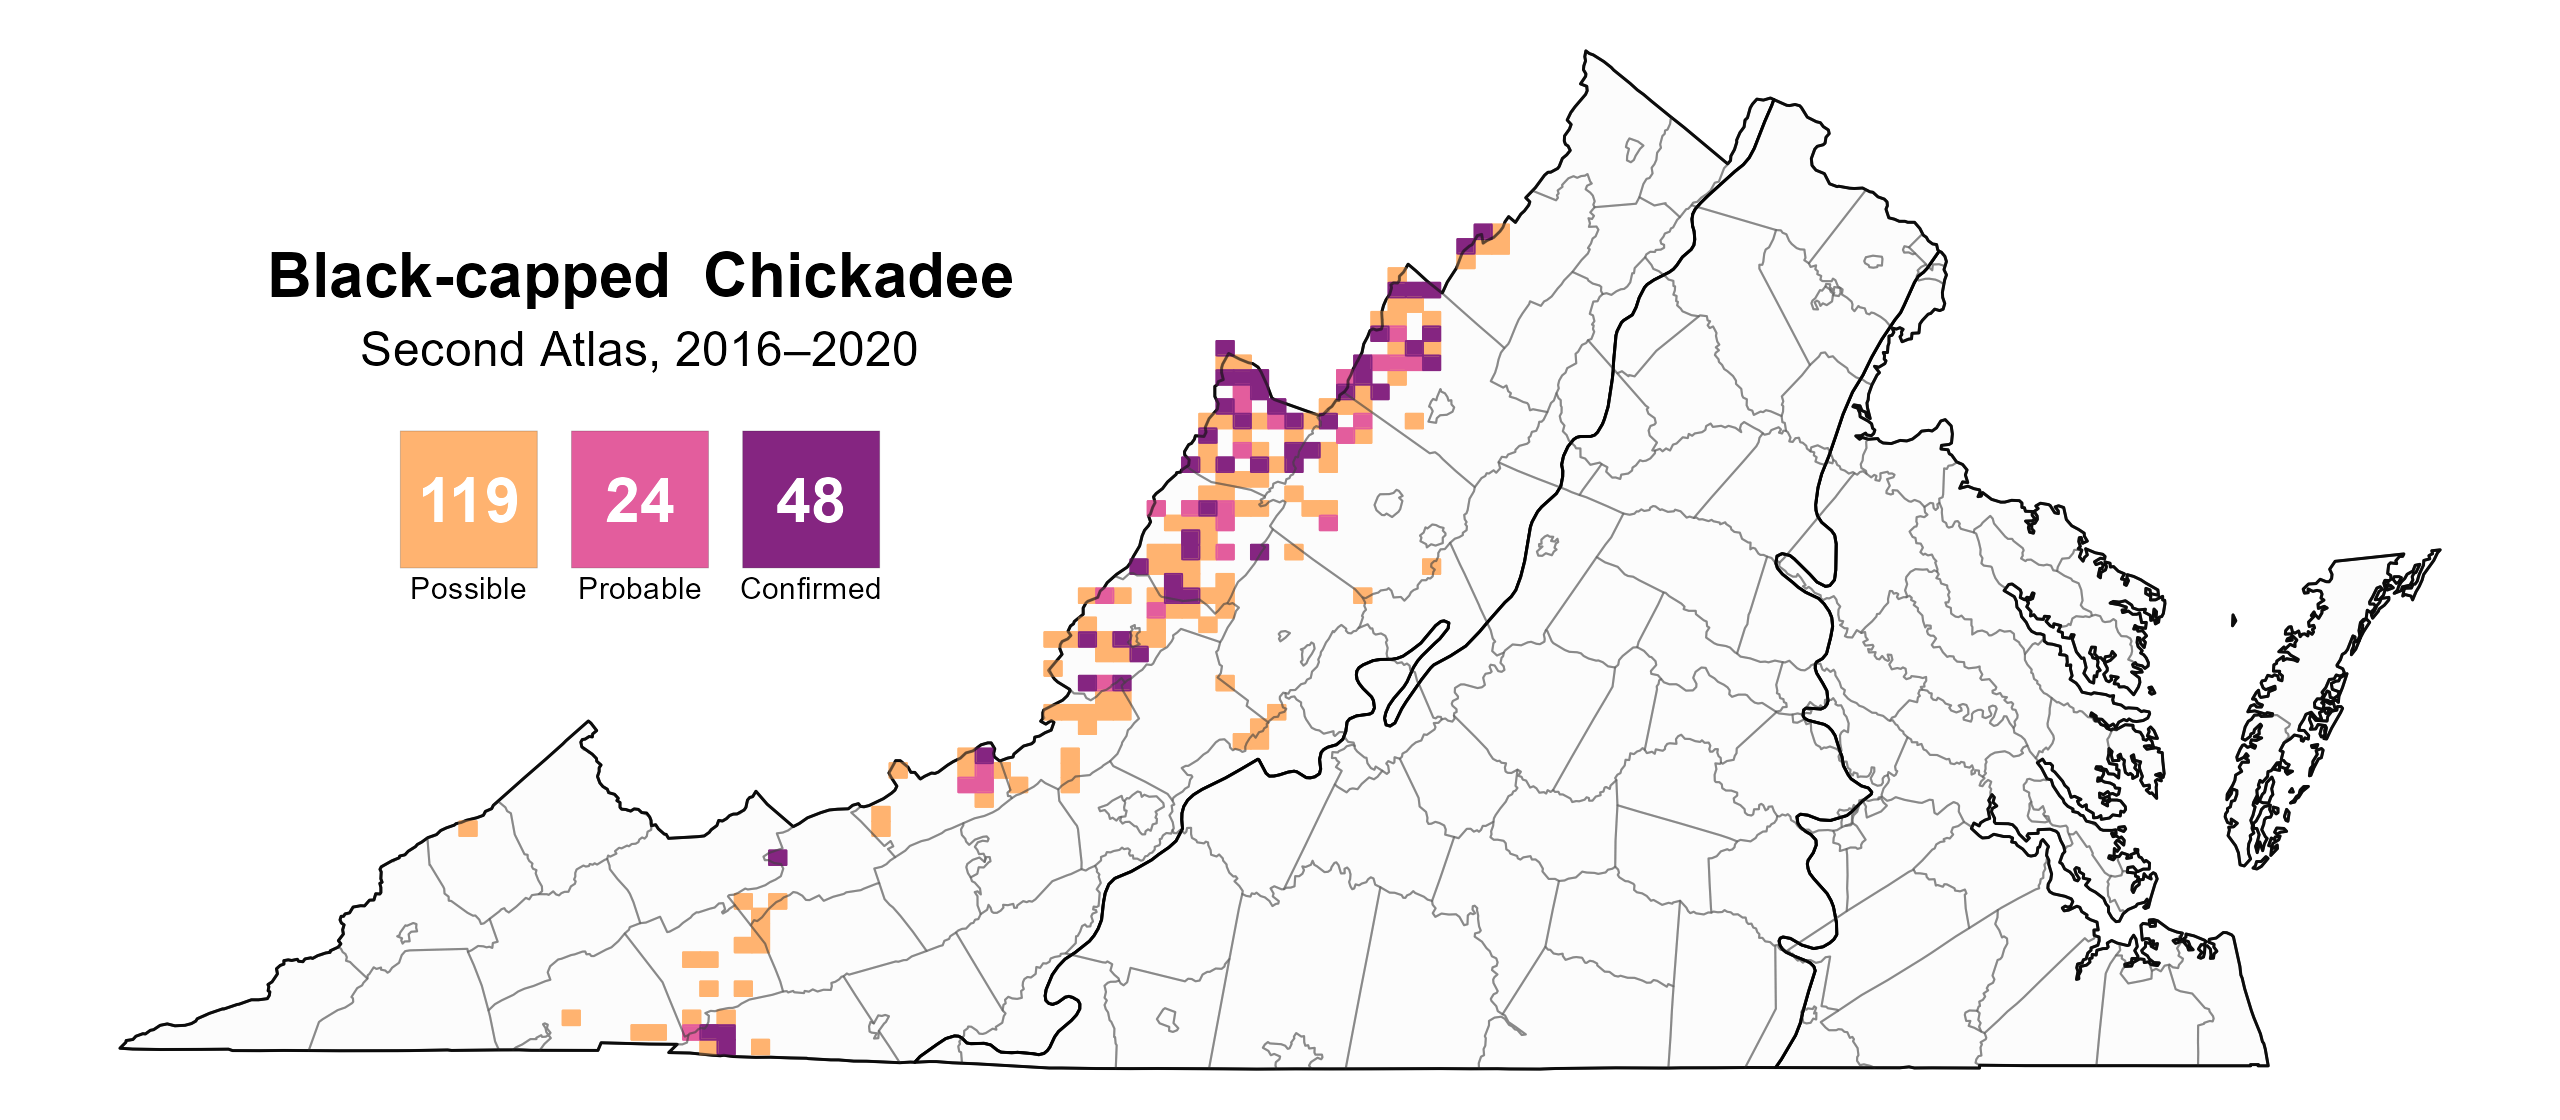
Figure 4: Black-capped Chickadee breeding observations from the Second Atlas (2016–2020). The colored boxes illustrate Atlas blocks (approximately 10 mi2 [26 km2] survey units) where the species was detected. The colors show the highest breeding category recorded in a block. The numbers within the colors in the legend correspond to the number of blocks with that breeding evidence category.
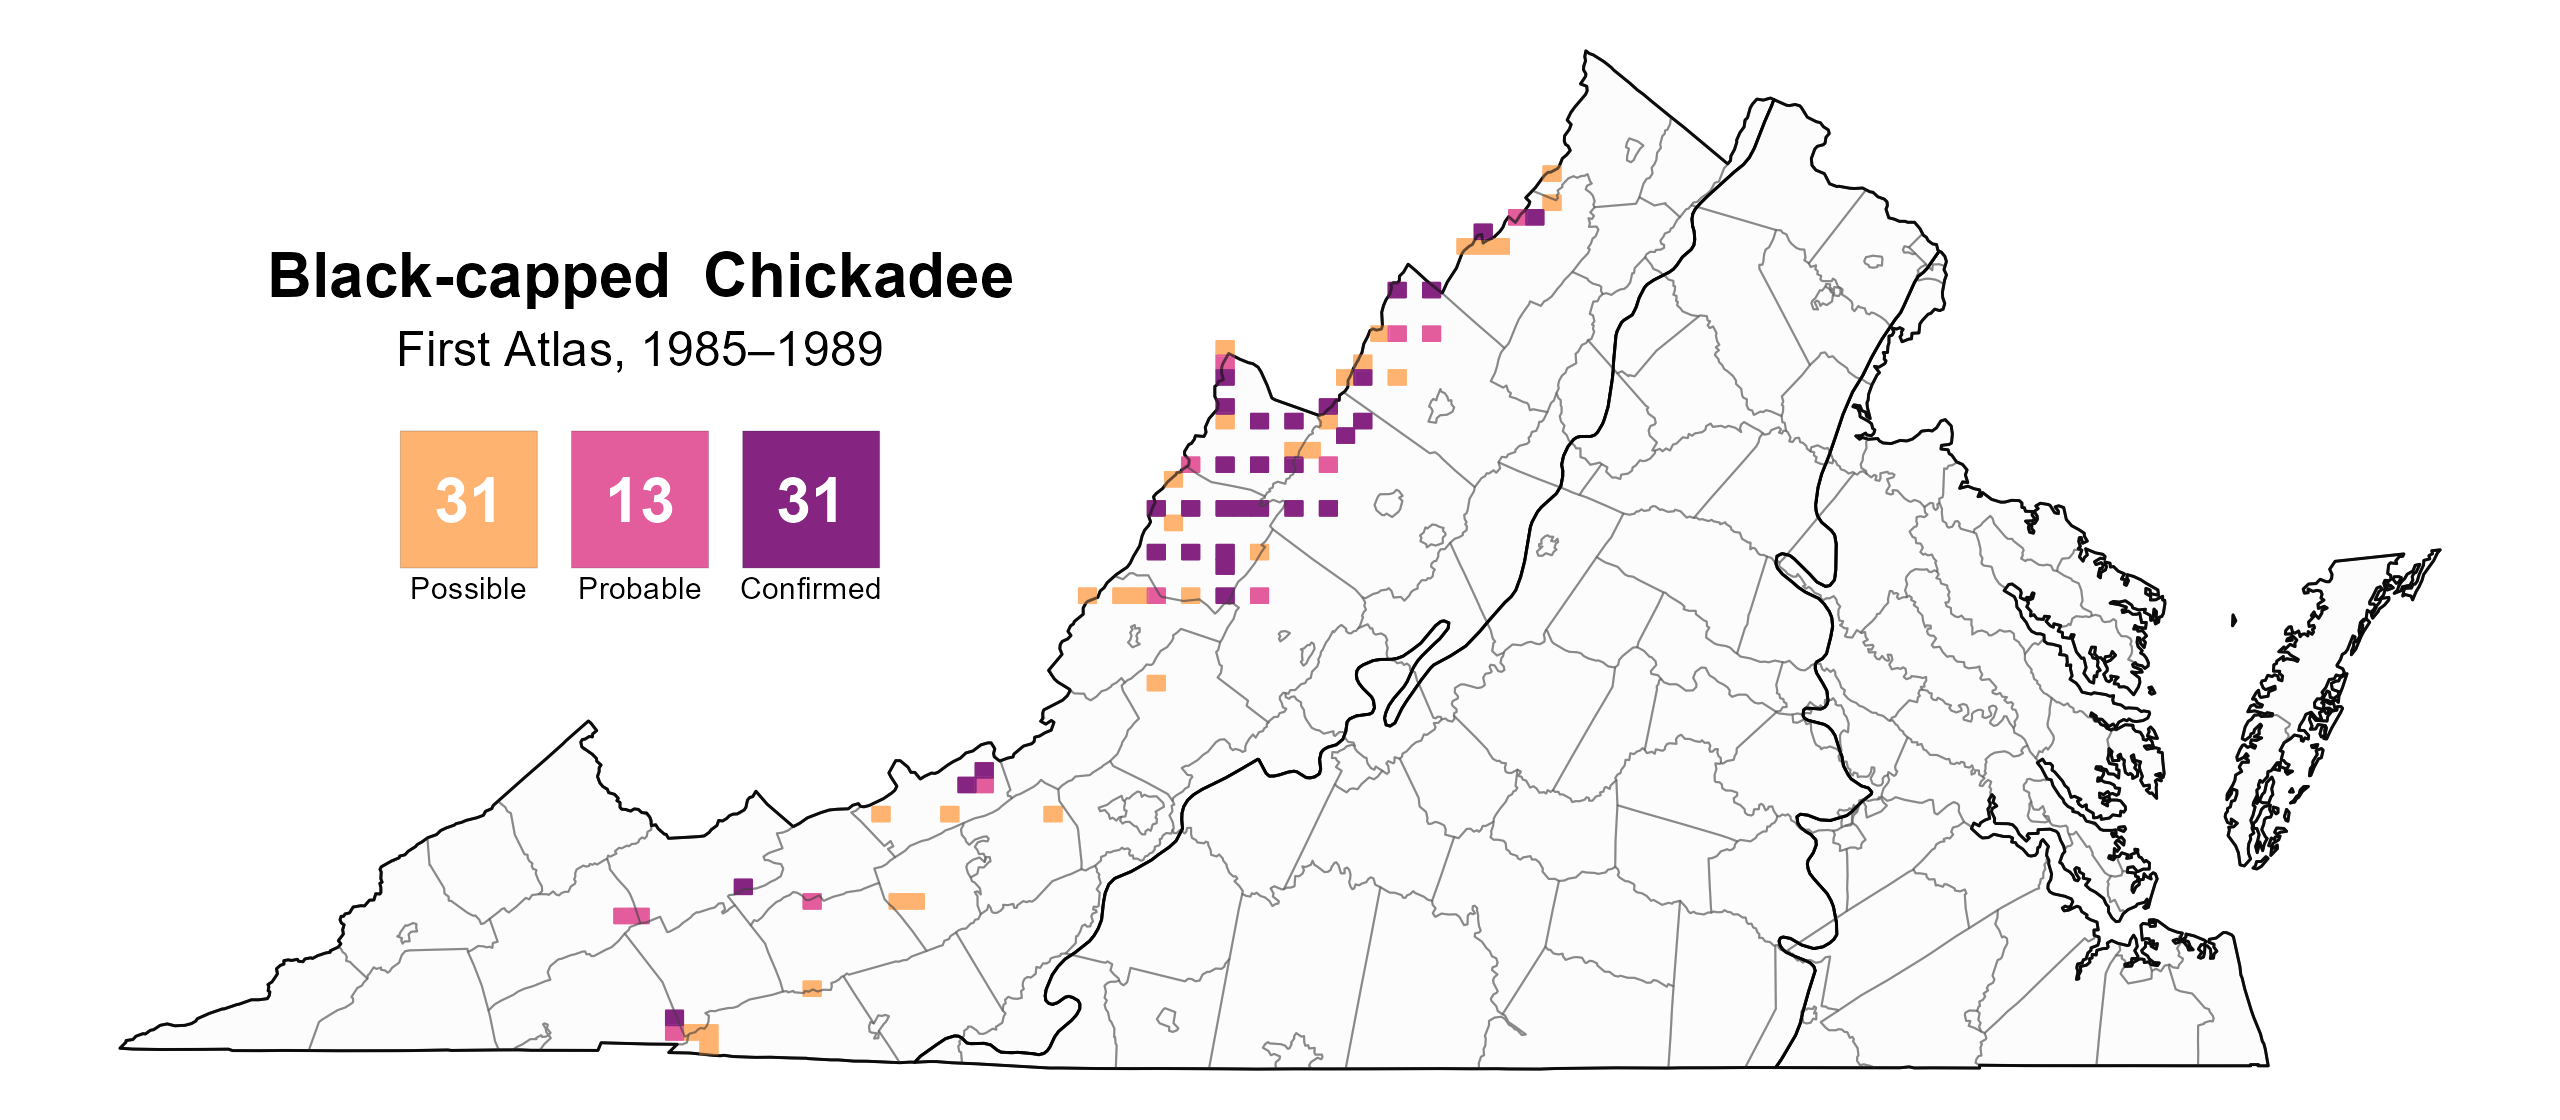
Figure 5: Black-capped Chickadee breeding observations from the First Atlas (1985–1989). The colored boxes illustrate Atlas blocks (approximately 10 mi2 [26 km2] survey units) where the species was detected. The colors show the highest breeding category recorded in a block. The numbers within the colors in the legend correspond to the number of blocks with that breeding evidence category.
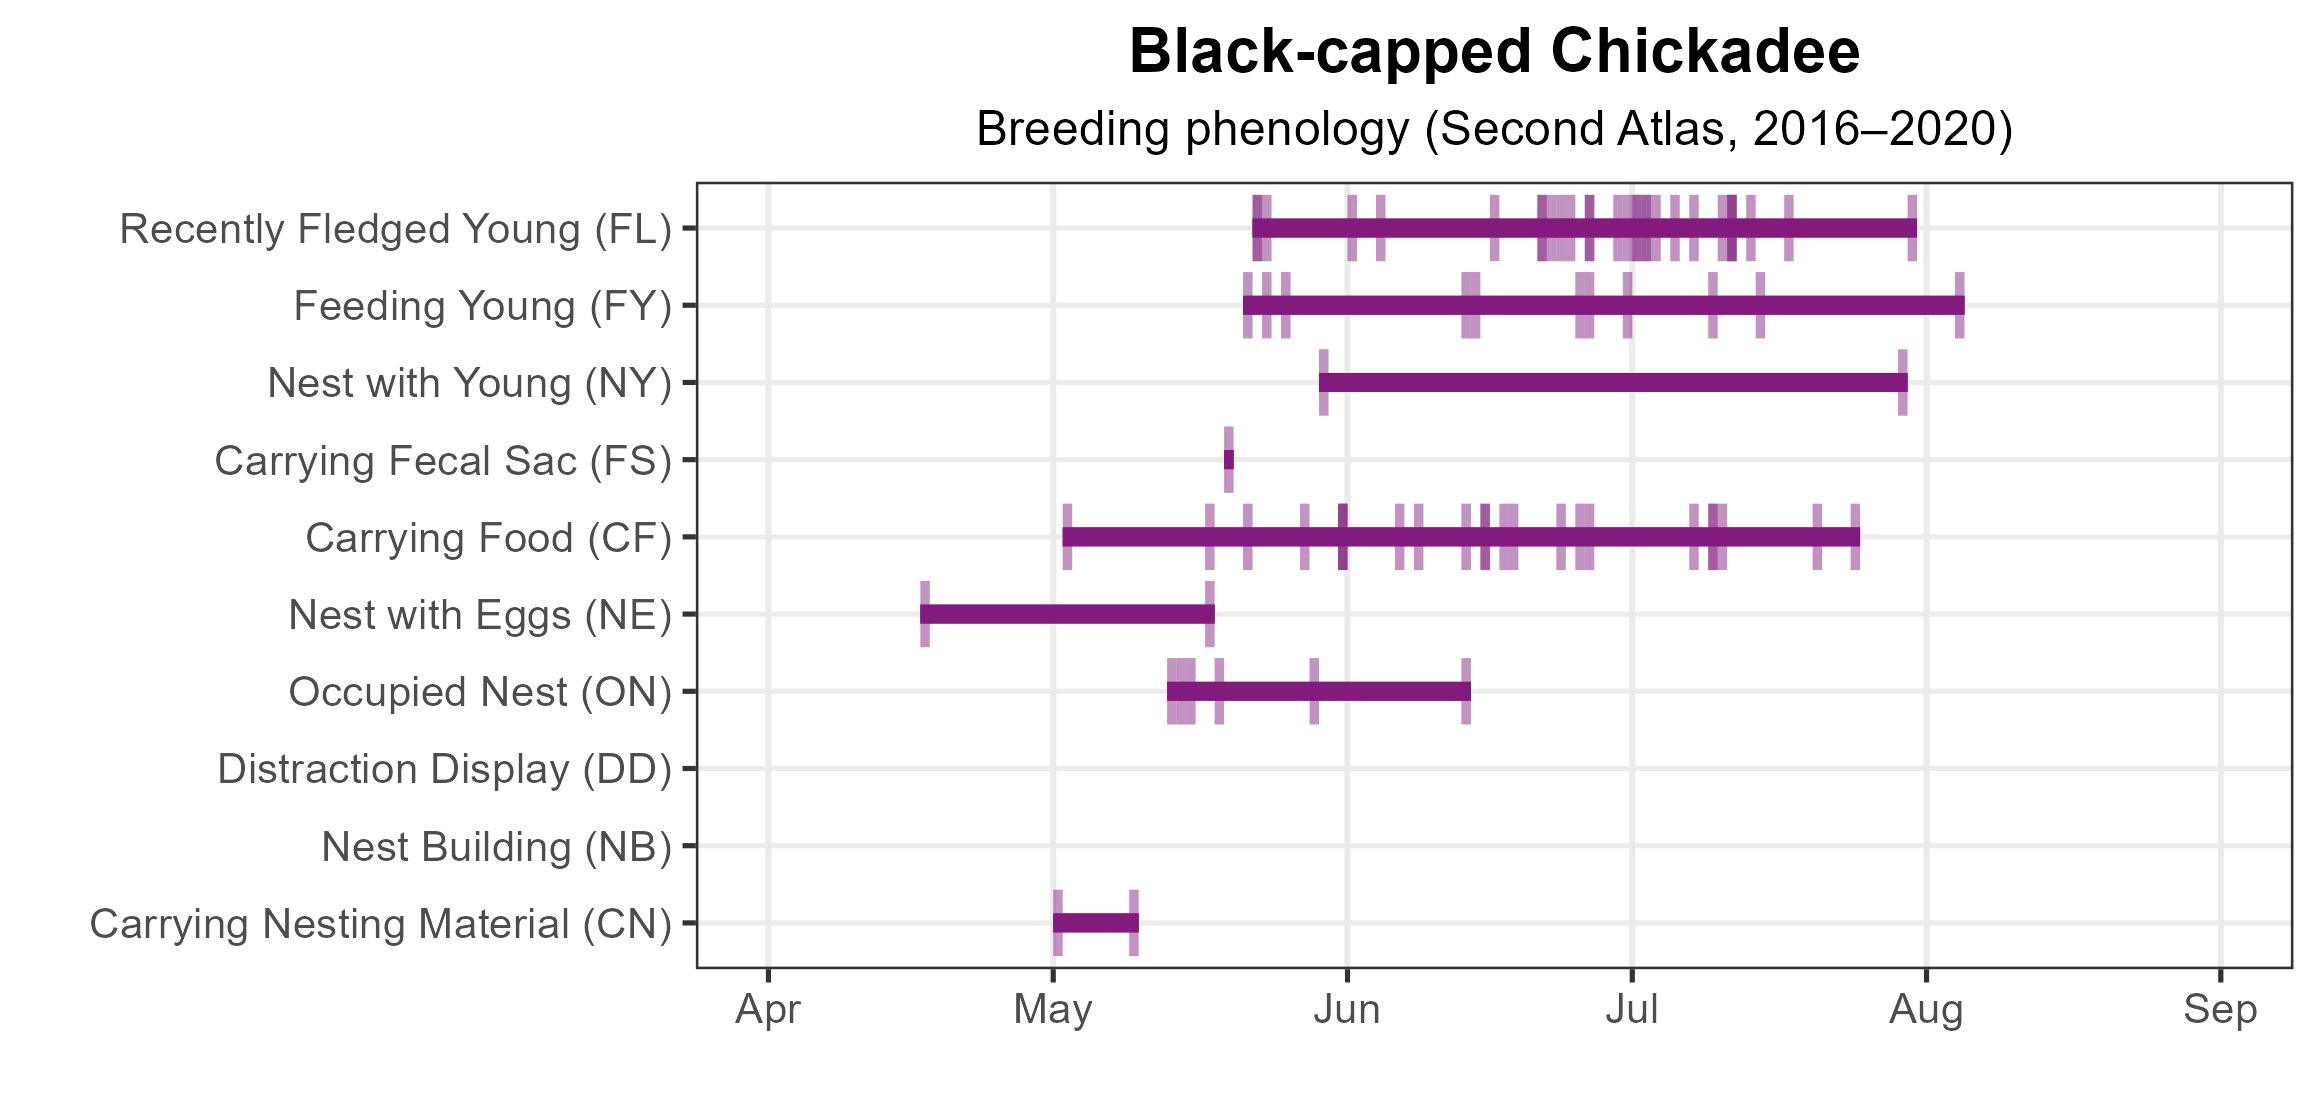
Figure 6: Black-capped Chickadee phenology: confirmed breeding codes. This graph shows a timeline of confirmed breeding behaviors. Tick marks represent individual observations of the behavior.
Population Status
Black-capped Chickadee relative abundance was estimated to be highest in the heavily forested areas of the Mountains and Valleys region (Figure 7).
The total estimated Black-capped Chickadee population in the state is approximately 60,000 individuals (with a range between 16,000 and 236,000). Based on the North American Breeding Bird Survey (BBS) data for the Appalachian Mountains region, as the BBS does not produce a credible population trend for Virginia, the Black-capped Chickadee population showed a nonsignificant increase of 0.31% annually from 1966–2022 (Hostetler et al. 2023; Figure 8). However, between Atlas periods, Black-capped Chickadees showed a significant decrease of 1.13% per year from 1987–2018 .
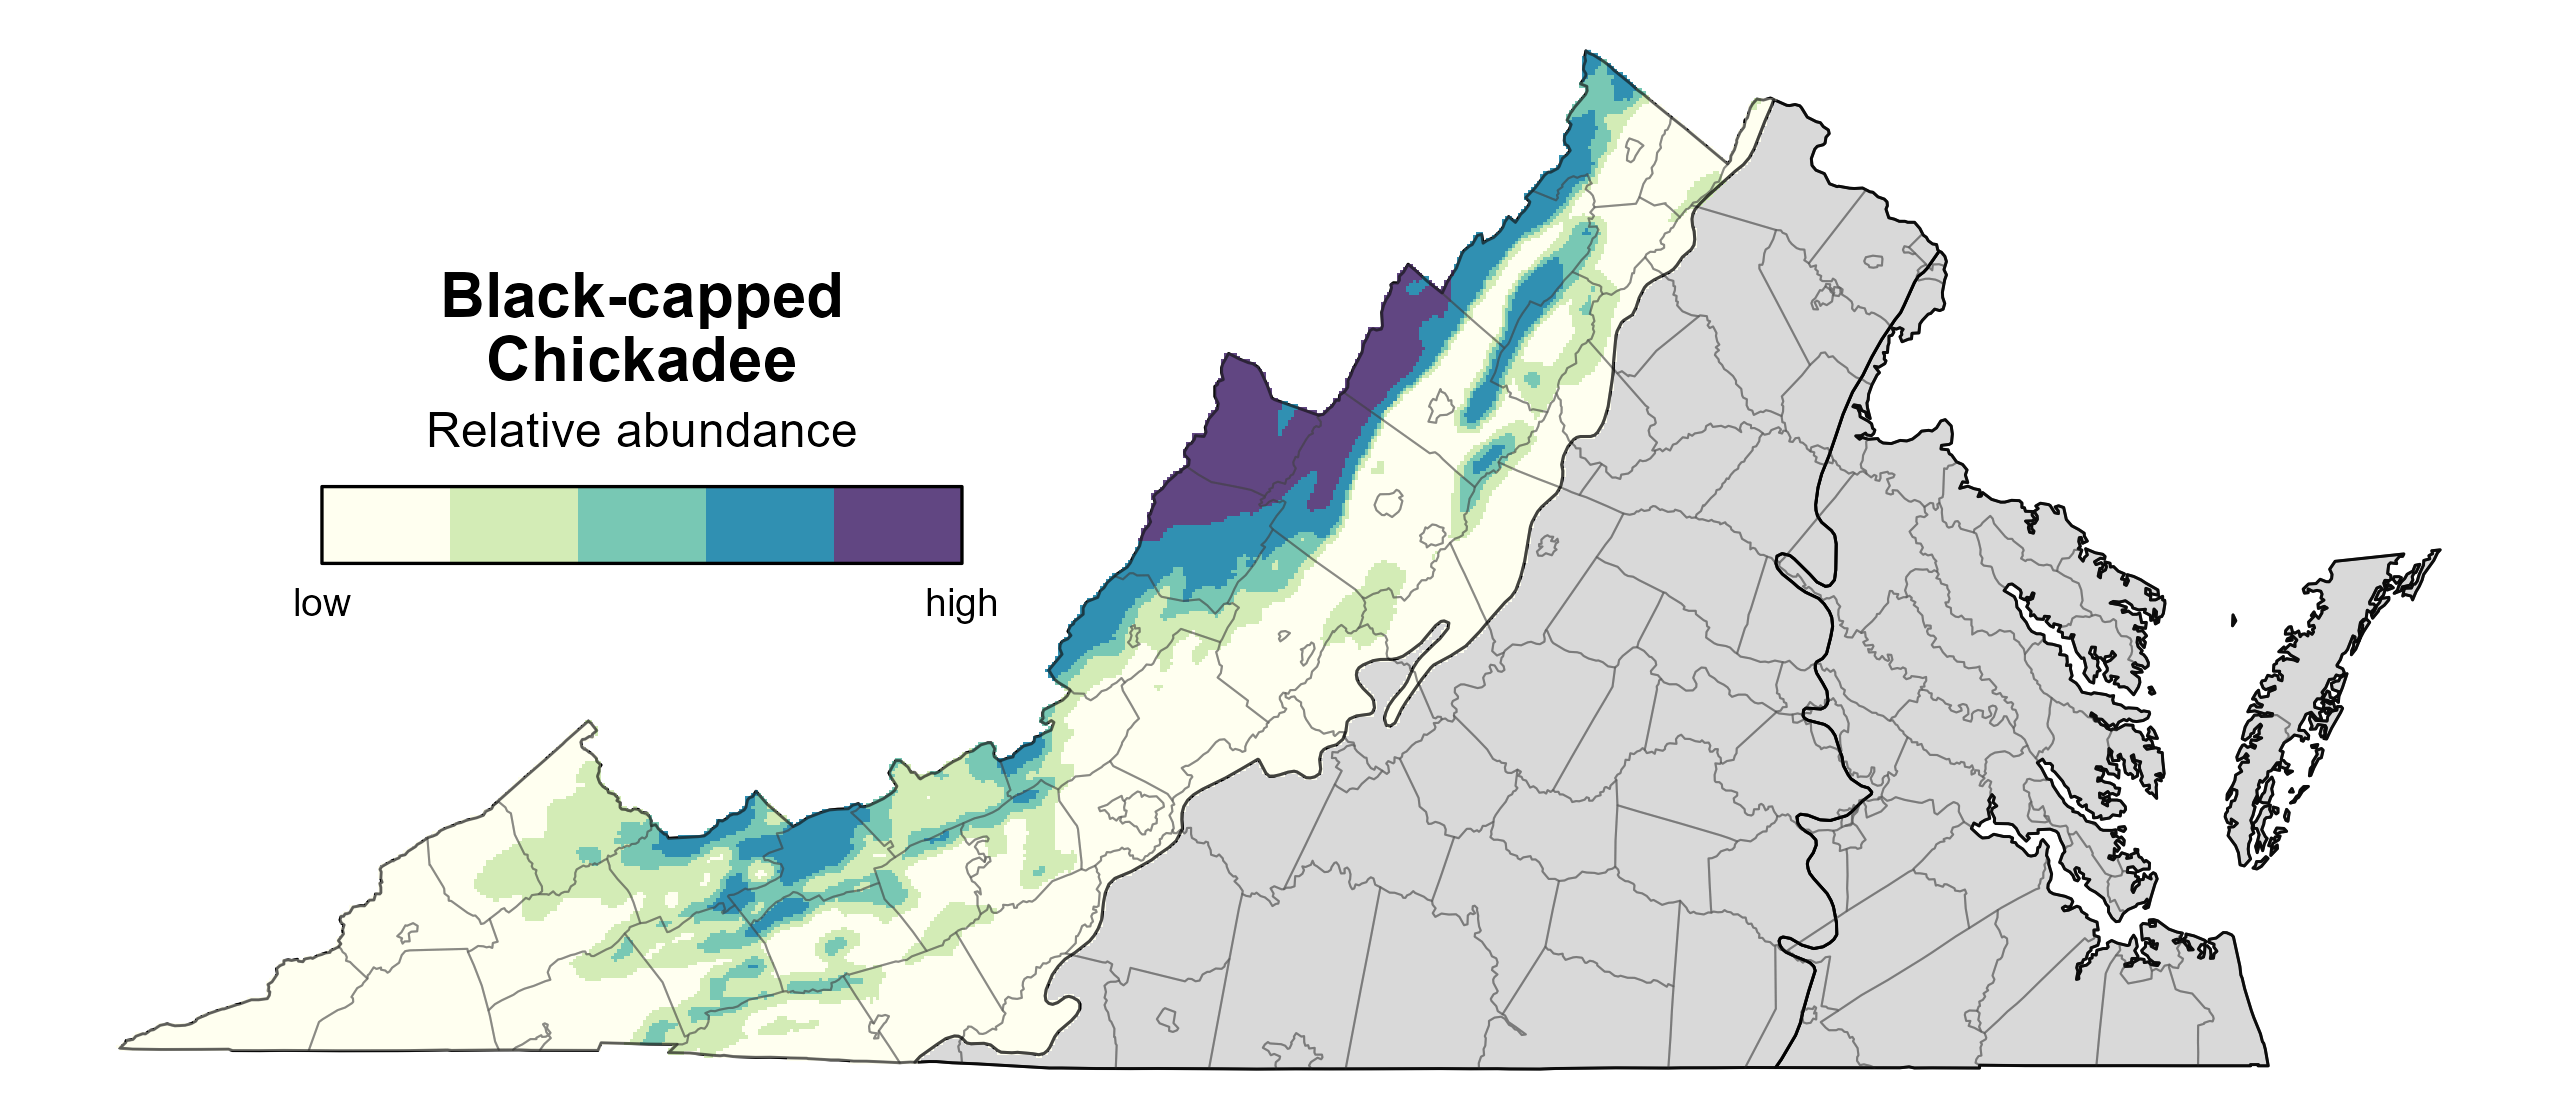
Figure 7: Black-capped Chickadee relative abundance (Second Atlas, 2016–2020). This map indicates the predicted abundance of this species at a 0.4 mi2 (1 km2) scale based on environmental (including habitat) factors. Abundance values are presented on a relative scale of low to high. Areas in gray are outside the species’ core range and were not modeled.
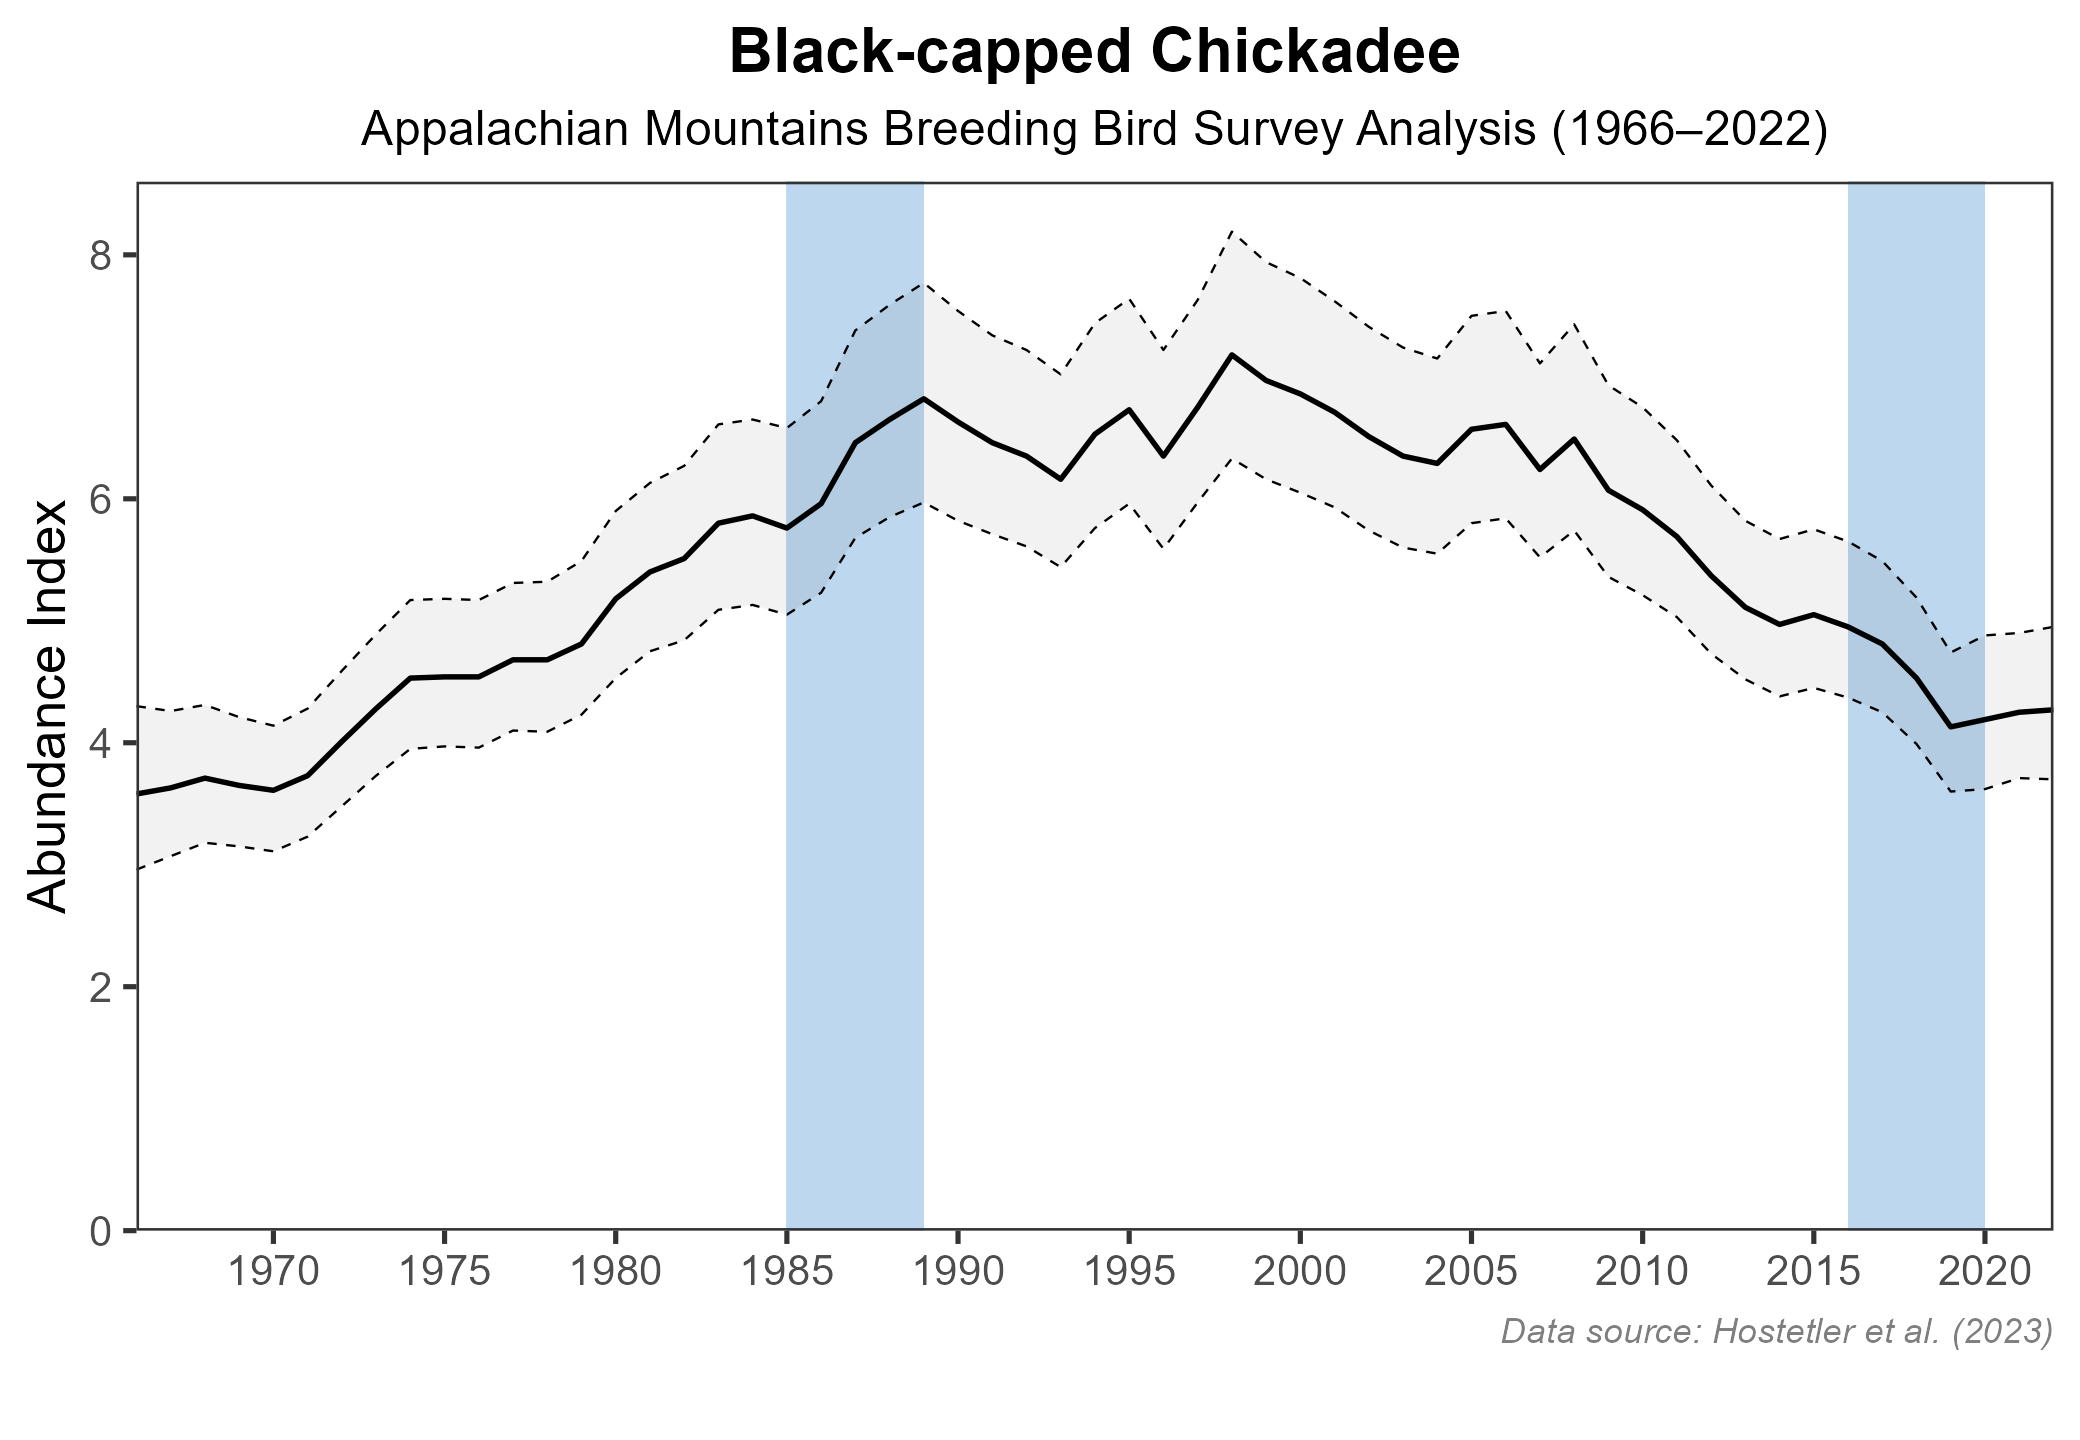
Figure 8: Black-capped Chickadee population trend for the Appalachian Mountains as estimated by the North American Breeding Bird Survey. The vertical axis shows species abundance; the horizontal axis shows the year. The solid line indicates the estimated population trend; there is a 97.5% probability that the true population trend falls between the dashed lines. The shaded bars indicate the First and Second Atlas periods.
Conservation
In Virginia, Black-capped Chickadees are range-restricted and experienced a slight population decline between Atlases, but throughout their range, they are common and not of conservation concern (Foote et al. 2020). However, based on studies conducted on climate change and birds in the Northeast, as temperatures increase, Black-capped Chickadees may experience a decrease in range (Rodenhouse et al. 2008). Warming temperatures could force them to move to higher elevations in Virginia’s mountains, limiting their habitat even further. Warming temperatures may also favor the expansion of the Carolina Chickadee, resulting in increased hybridization (Taylor et al. 2014). Thus, climate change may affect their conservation status over the long term.
Interactive Map
The interactive map contains up to six Atlas layers (probability of occurrence for the First and Second Atlases, change in probability of occurrence between Atlases, breeding evidence for the First and Second Atlases, and abundance for the Second Atlas) that can be viewed one at a time. To view an Atlas map layer, mouse over the layer box in the upper left. County lines and physiographic regional boundaries (Mountains and Valleys, Piedmont, and Coastal Plain) can be turned on and off by checking or unchecking the box below the layer box. Within the map window, users can hover on a block to see its value for each layer and pan and zoom to see roads, towns, and other features of interest that are visible beneath a selected layer.
View Interactive Map in Full Screen
References
Foote, J. R., D. J. Mennill, L. M. Ratcliffe, and S. M. Smith (2020). Black-capped Chickadee (Poecile atricapillus), version 1.0. In Birds of the World (A. F. Poole, Editor). Cornell Lab of Ornithology, Ithaca, NY, USA. https://doi.org/10.2173/bow.bkcchi.01.
Hostetler, J. A., J. R. Sauer, J. E. Hines, D. Ziolkowski, and M. Lutmerding (2023). The North American breeding bird survey, analysis results 1966–2022. U.S. Geological Survey, Laurel, MD, USA. https://doi.org/10.5066/P9SC7T11.
Rodenhouse, N.L., S. N. Matthews, K. P. McFarland, J. D. Lambert, L. R. Iverson, A. Prasad, T. S. Stillett, and R. T. Holmes (2008). Potential effects of climate change on birds of the Northeast. Mitigation and Adaptation Strategies for Global Change 13:487-516.
Rottenborn, S. C., and E. S. Brinkley (Editors) (2007). Virginia’s birdlife: an annotated checklist. 4th edition. Virginia Society of Ornithology.
Taylor, S. A., T. A. White, W. M. Hochachka, V. Ferretti, R. L. Curry, and I. Lovette (2014). Climate-mediated movement of an avian hybrid zone. Current Biology 24: 671–676.