Introduction
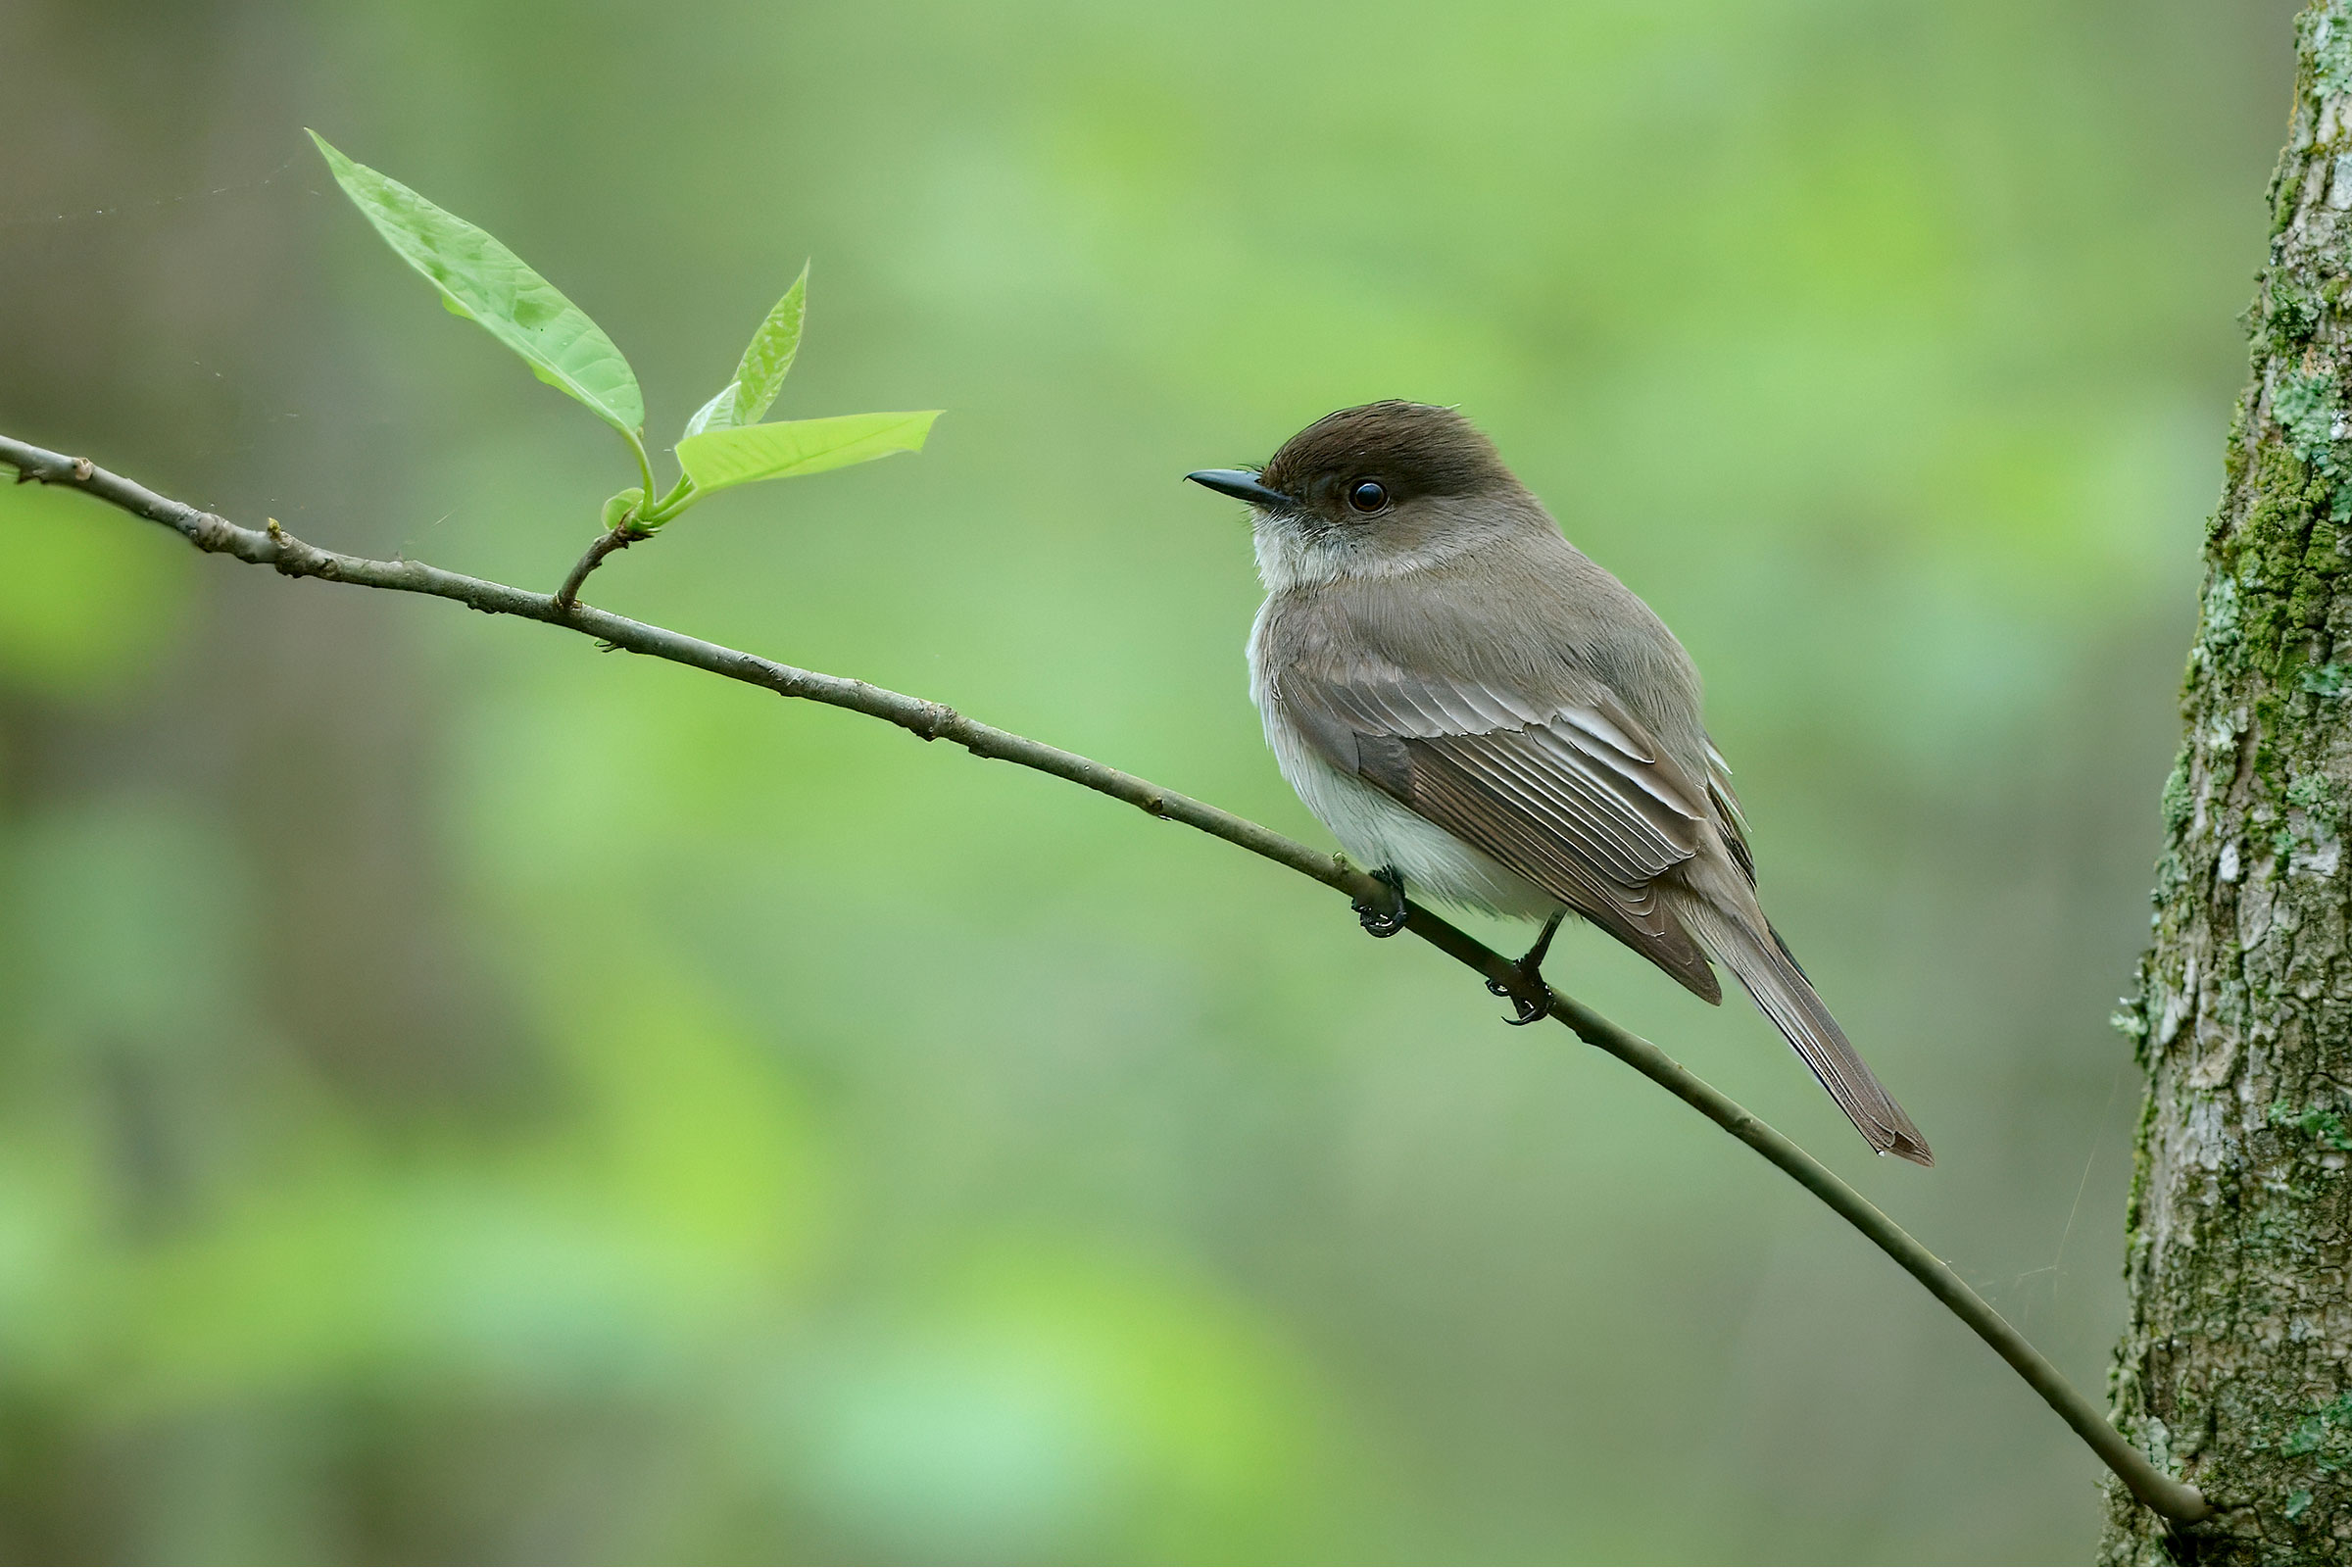
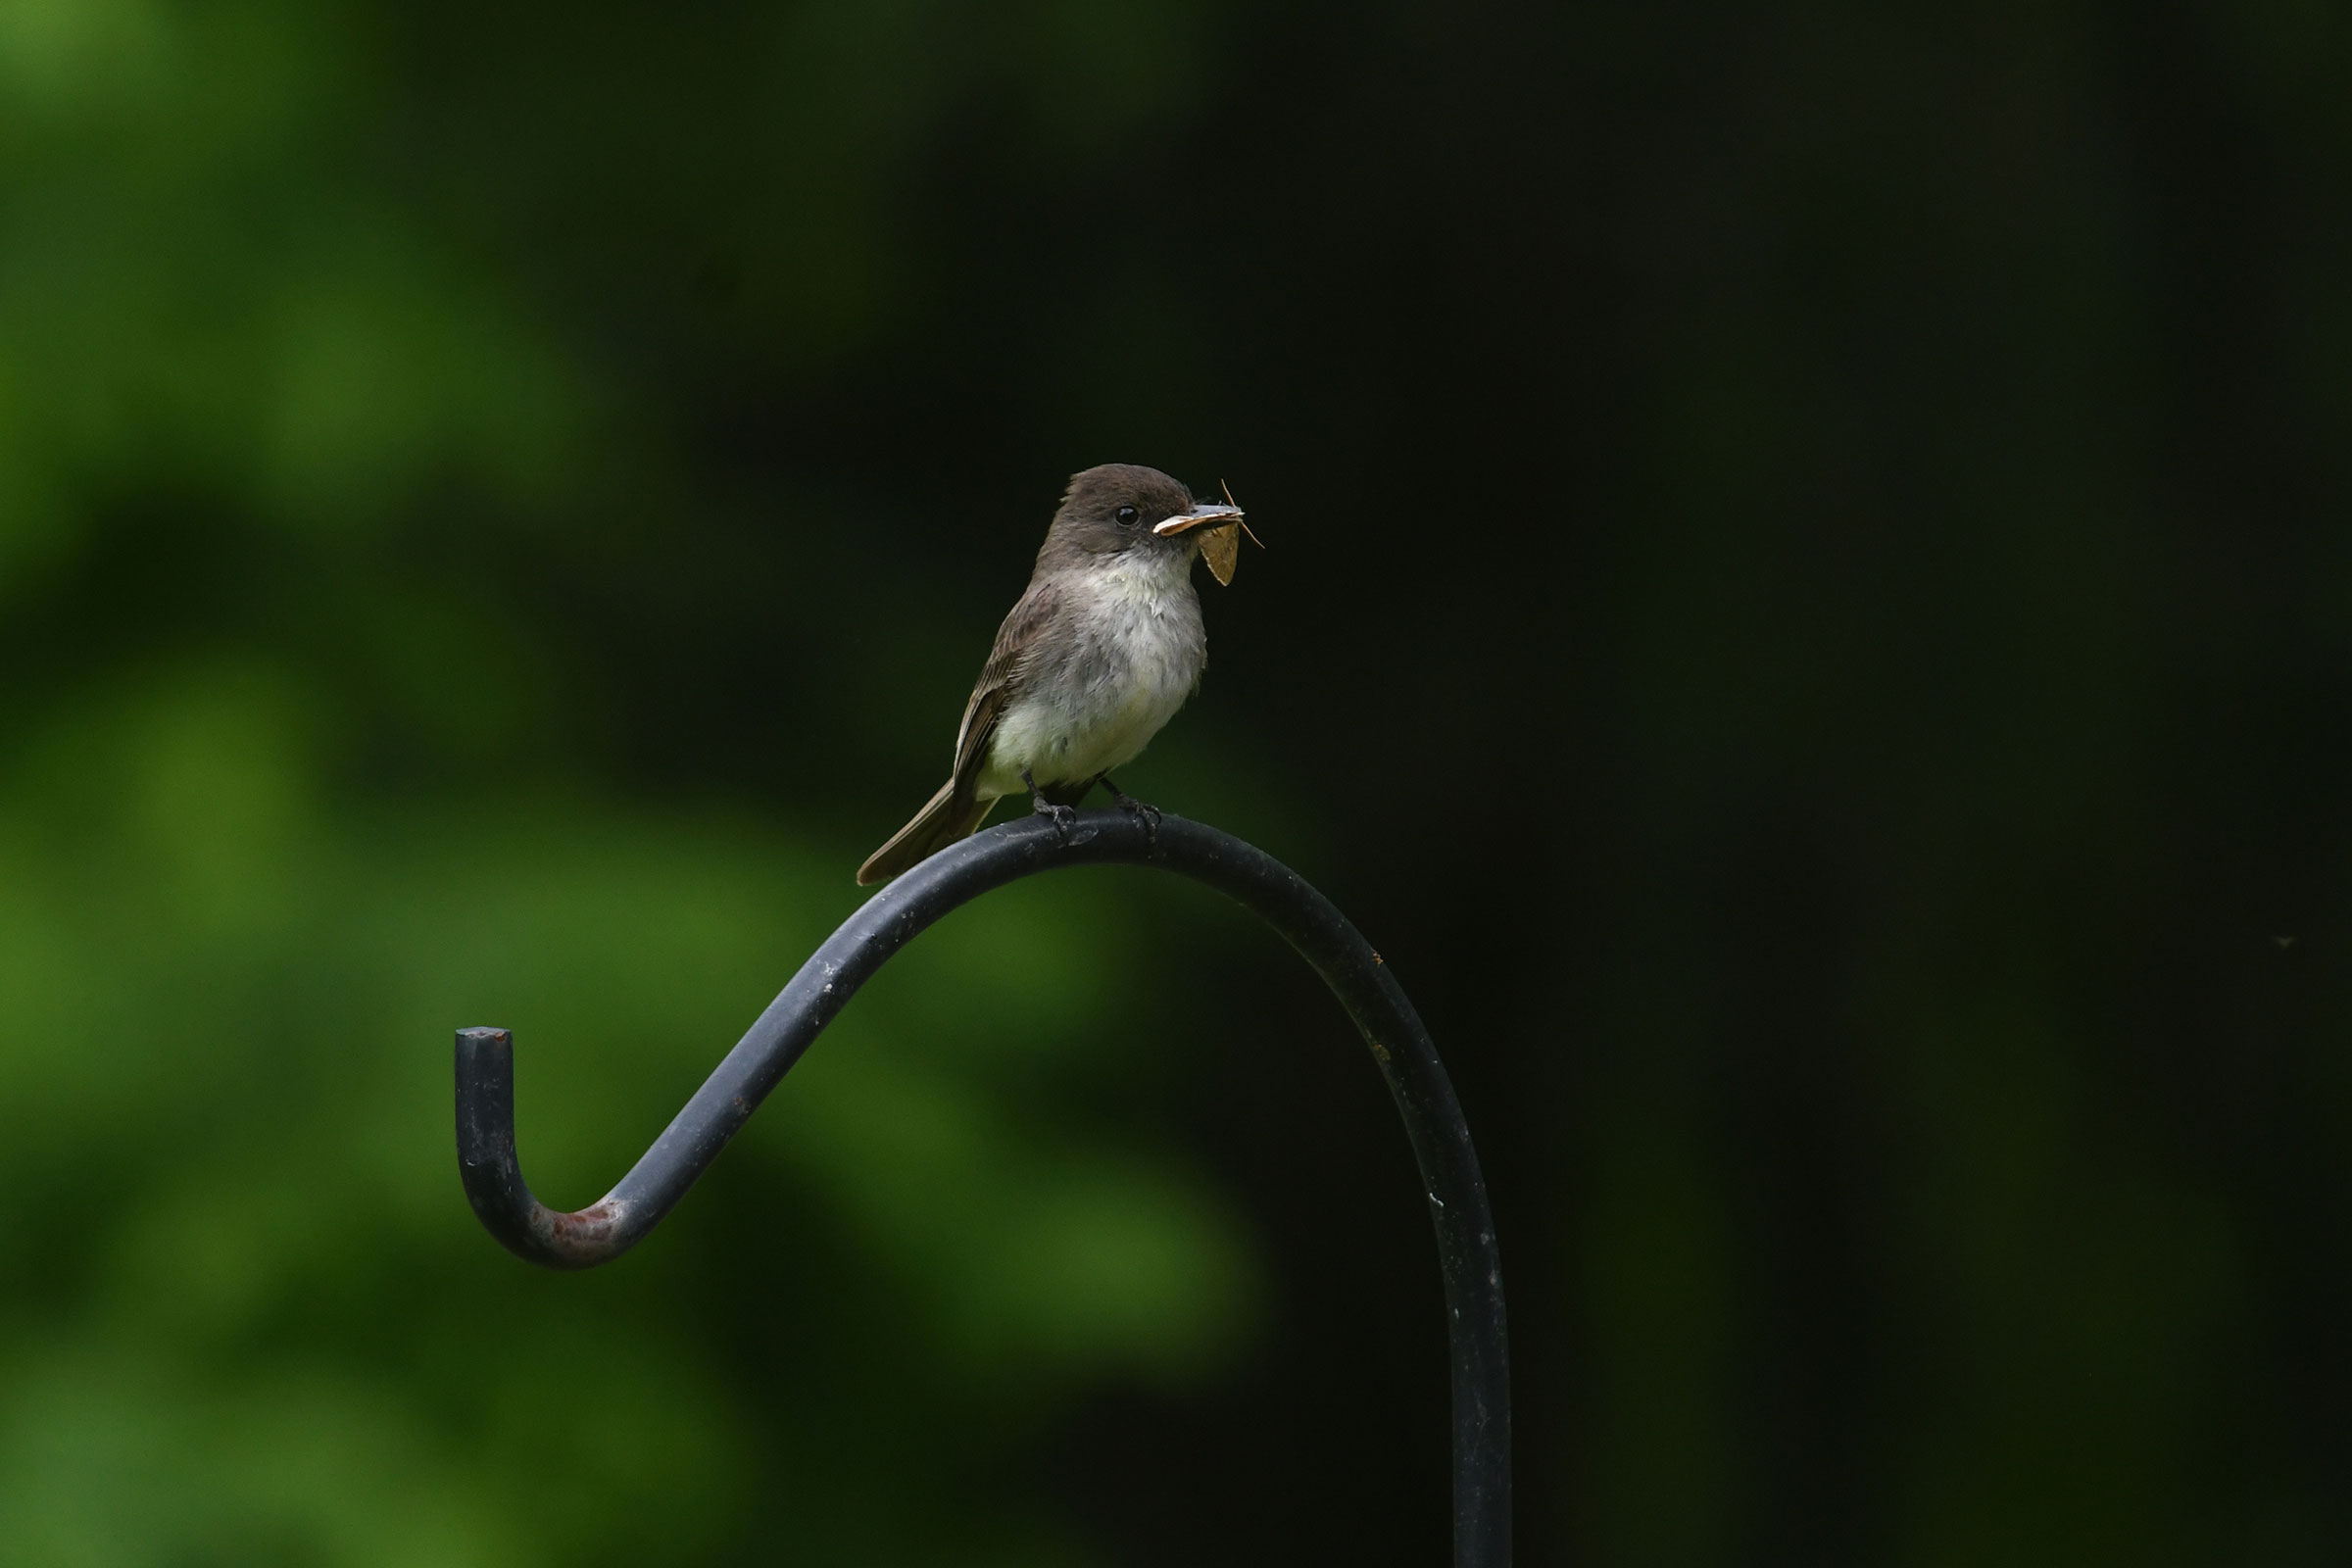
Named for its call phoebe, the Eastern Phoebe is a common sight in the state. Each spring, thousands of Virginians walk from their homes to discover that a bird’s nest of mud, grass, and moss has seemingly sprung up on their porch overnight. Eastern Phoebes have successfully adapted to human-dominated landscapes by building their nests under bridges and on barns, porches, and other structures. For many, this is a welcome sign of spring (Weeks 2020).
Breeding Distribution
Eastern Phoebes are found throughout most of Virginia, but they are less likely to be found in urbanized landscapes, some coastal areas, and the Eastern Shore (Figure 1). The likelihood of Eastern Phoebes occurring in a block is increases with forest cover and is also positively associated with forest edges and agricultural areas, suggesting that a mix of forest and open areas provide optimal nesting habitat. The lack of human structures and open areas for building nests may explain the scarcity of this species in the Great Dismal Swamp in the breeding season but does not explain its lower occurrence further east (Nicholas Flanders, personal communication).
In the time since the First Atlas (Figure 2), there was little change in the Eastern Phoebe’s likelihood of occurrence across the state (Figure 3).
View Environmental Associations

Figure 1: Eastern Phoebe breeding distribution based on probability of occurrence (Second Atlas, 2016–2020). This map indicates the probability that this species will occur in an Atlas block (an approximately 10 mi2 [26 km2] survey unit) based on environmental (including habitat) factors and after adjusting for the probability of detection (variation in survey effort among blocks).
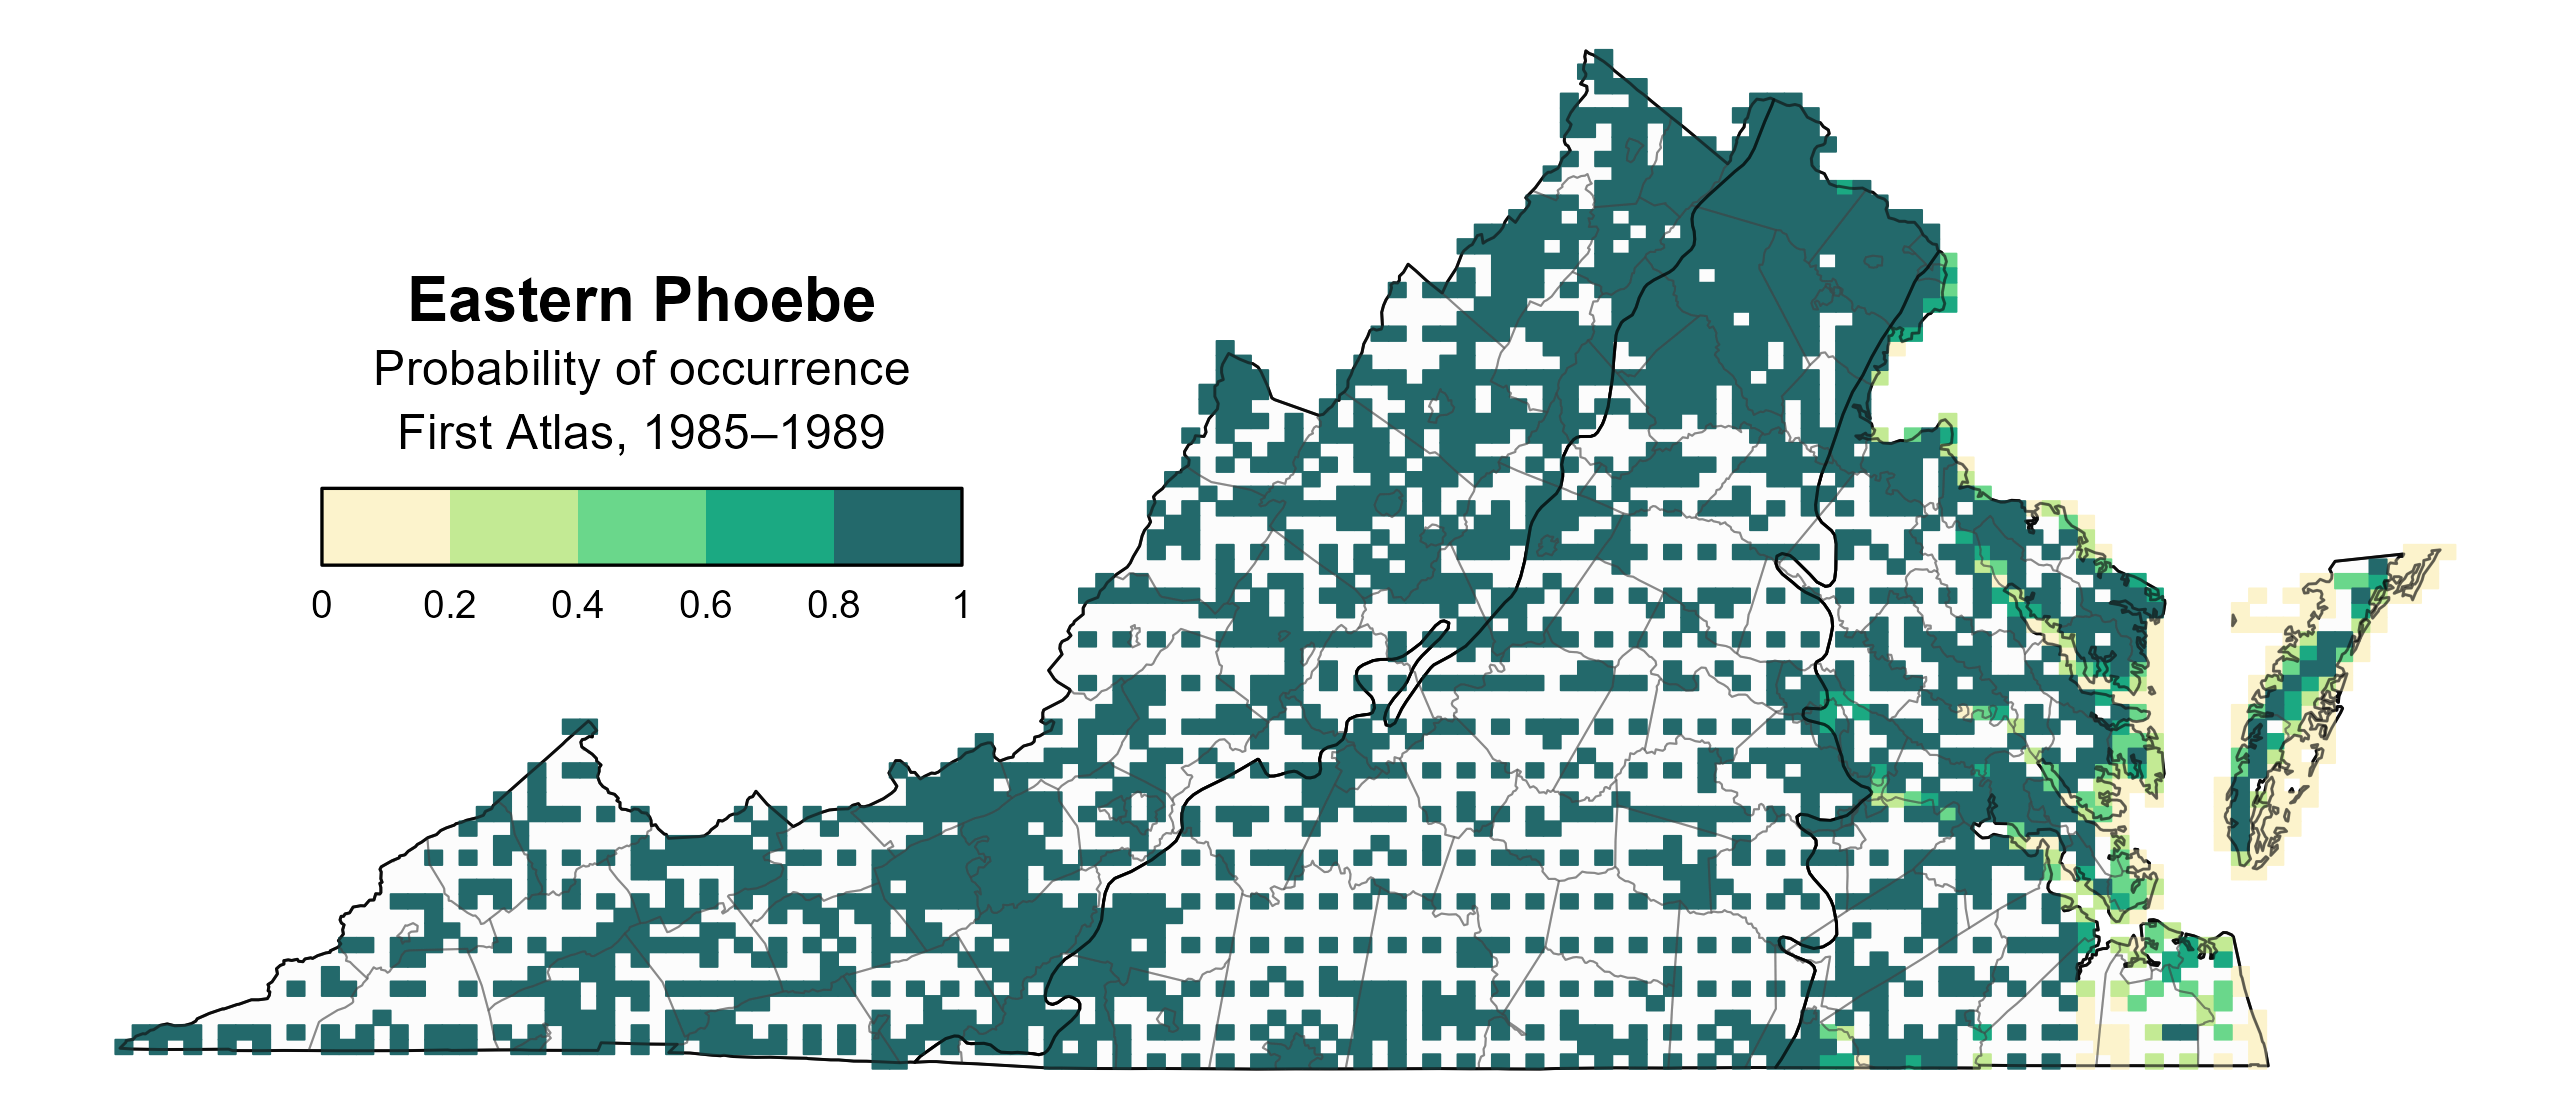
Figure 2: Eastern Phoebe breeding distribution based on probability of occurrence (First Atlas, 1985–1989). This map indicates the probability that this species will occur in an Atlas block (an approximately 10 mi2 [26 km2] survey unit) based on environmental (including habitat) factors and after adjusting for the probability of detection (variation in survey effort among blocks). Blocks in white were not surveyed during the First Atlas and were not modeled.
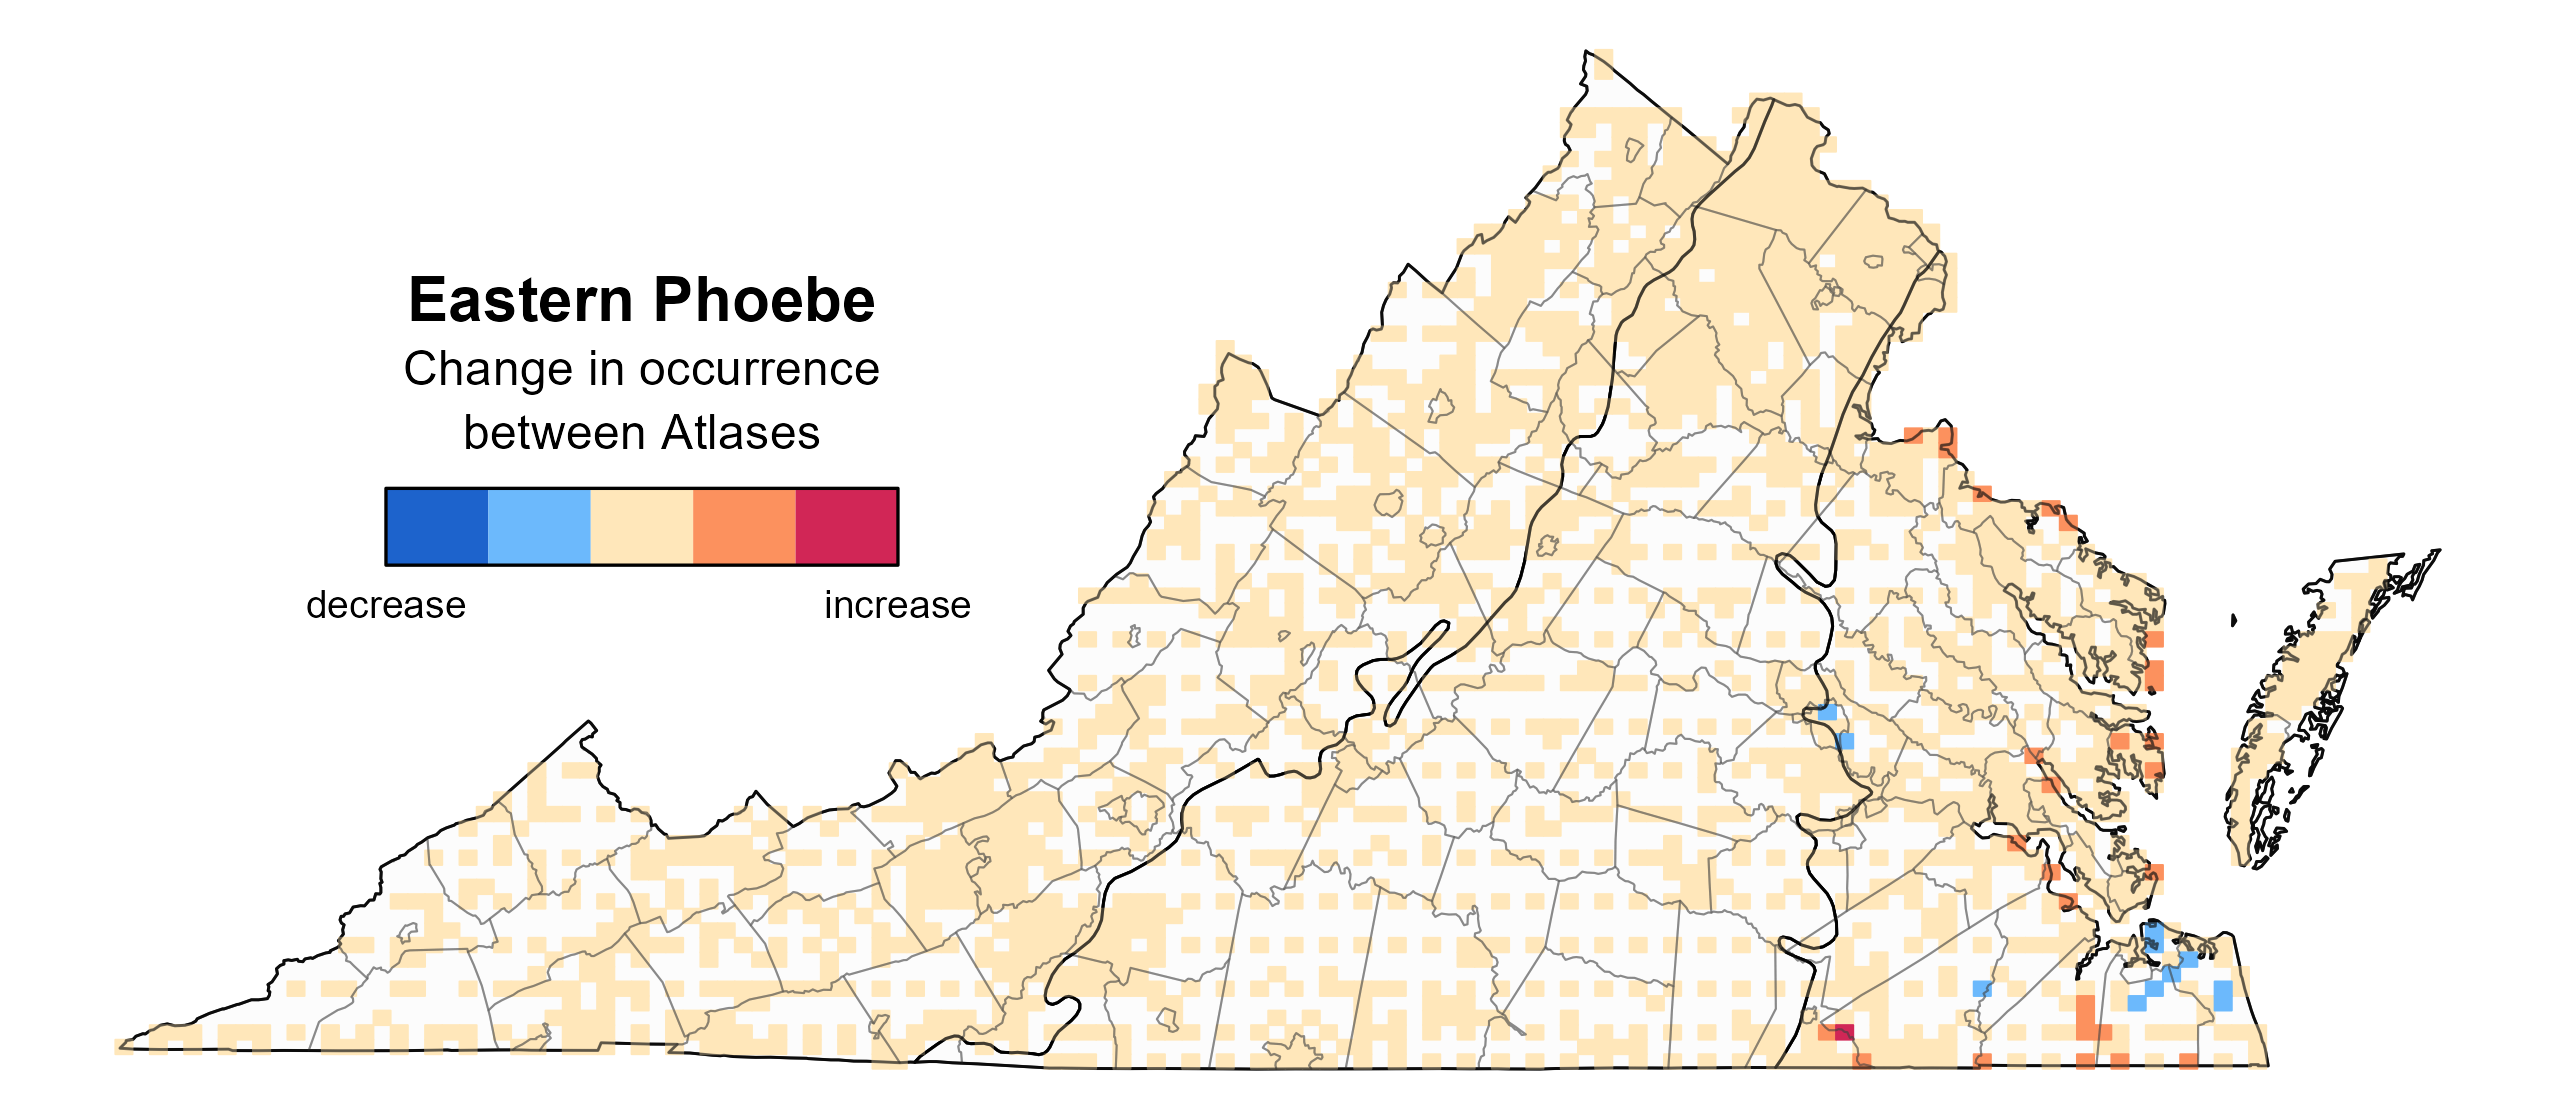
Figure 3: Eastern Phoebe change in breeding distribution between Atlases (1985–1989 and 2016–2020) based on probability of occurrence. This map indicates the change in the probability that this species will occur in a block (an approximately 10 mi2 [26 km2] survey unit) between Atlas periods. Blocks with no change (tan) may have constant presence or constant absence. Blocks in white were not surveyed during the First Atlas and were not modeled.
Breeding Evidence
Eastern Phoebes were confirmed breeders in 989 blocks and 111 counties and found to be probable breeders in an additional five counties (Figure 4). Breeding observations were recorded throughout the state in the First Atlas as well (Figure 5).
The earliest confirmed breeding behavior was recorded in early March when nest building was observed. However, breeding was primarily confirmed through observations of occupied nests (March 26 – July 30), recently fledged young April 25 – August 28), and nests with young (April 25 – July 22) (Figure 6).
For more general information on the breeding habits of this species, please refer to All About Birds.

Figure 4: Eastern Phoebe breeding observations from the Second Atlas (2016–2020). The colored boxes illustrate Atlas blocks (approximately 10 mi2 [26 km2] survey units) where the species was detected. The colors show the highest breeding category recorded in a block. The numbers within the colors in the legend correspond to the number of blocks with that breeding evidence category.

Figure 5: Eastern Phoebe breeding observations from the First Atlas (1985–1989). The colored boxes illustrate Atlas blocks (approximately 10 mi2 [26 km2] survey units) where the species was detected. The colors show the highest breeding category recorded in a block. The numbers within the colors in the legend correspond to the number of blocks with that breeding evidence category.

Figure 6: Eastern Phoebe phenology: confirmed breeding codes. This graph shows a timeline of confirmed breeding behaviors. Tick marks represent individual observations of the behavior.
Population Status
Eastern Phoebe relative abundance was estimated to be highest in the western portion of the Mountains and Valleys region, decreasing moving east through the Piedmont into Coastal Plain region (Figure 7).
The total estimated Eastern Phoebe population in the state is approximately 612,000 individuals (with a range between 445,000 and 843,000). Based on the North American Breeding Bird Survey (BBS), the Eastern Phoebe population declined by a nonsignificant 0.12% annually from 1966–2022 in Virginia, and between Atlases, the population showed a significant decrease of 0.87% per year from 1987–2018 (Hostetler et al. 2023; Figure 8).
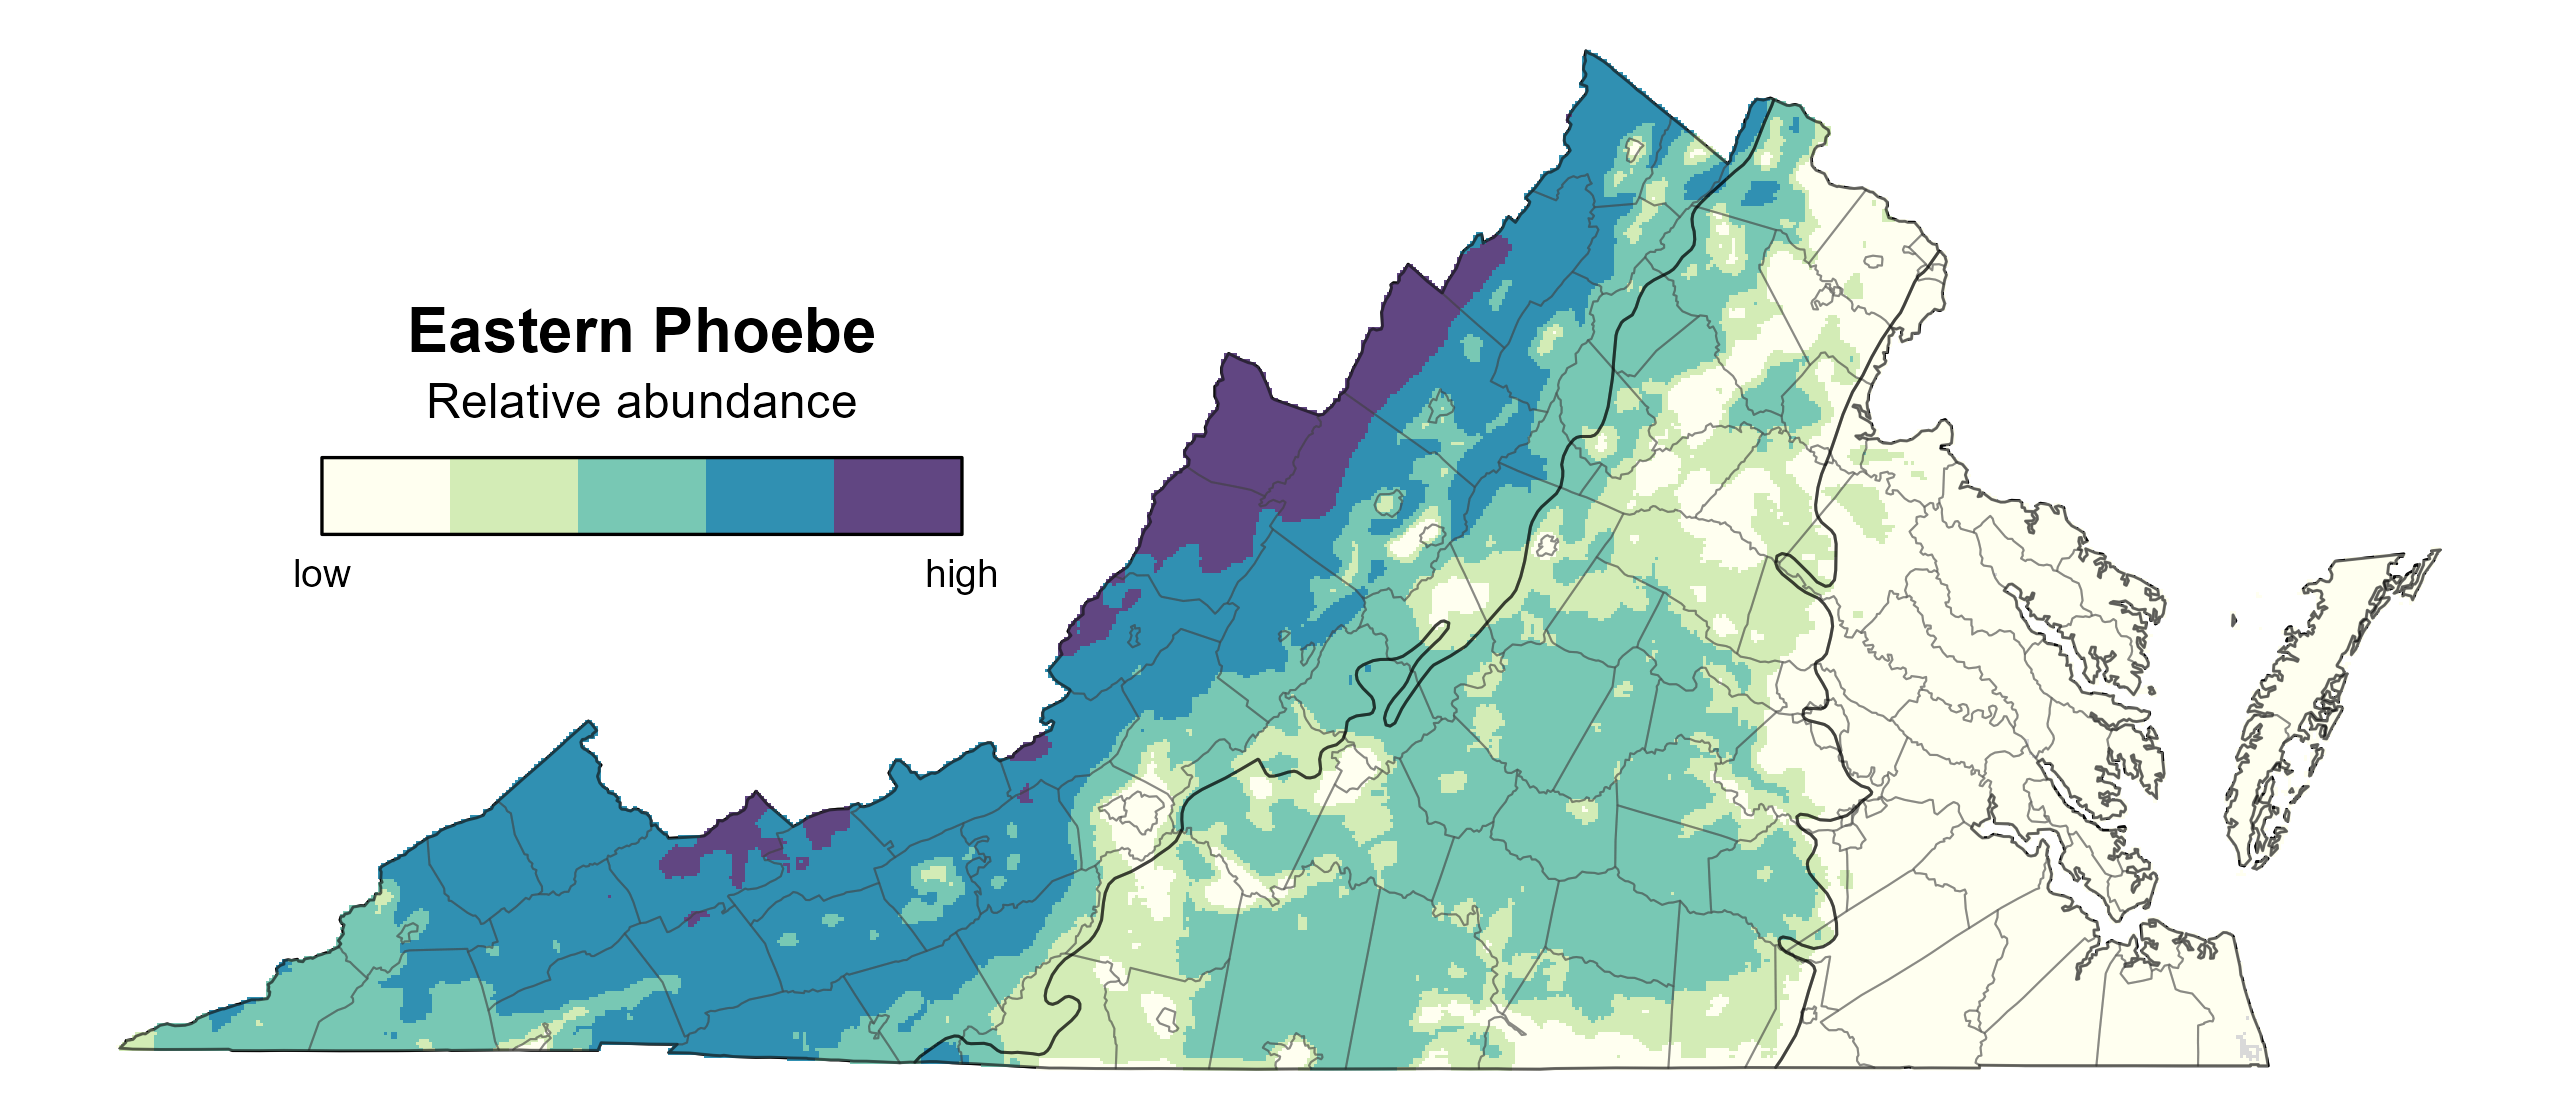
Figure 7: Eastern Phoebe relative abundance (Second Atlas, 2016–2020). This map indicates the predicted abundance of this species at a 0.4 mi2 (1 km2) scale based on environmental (including habitat) factors. Abundance values are presented on a relative scale of low to high.

Figure 8: Eastern Phoebe population trend for Virginia as estimated by the North American Breeding Bird Survey. The vertical axis shows species abundance; the horizontal axis shows the year. The solid line indicates the estimated population trend; there is a 97.5% probability that the true population trend falls between the dashed lines. The shaded bars indicate the First and Second Atlas periods.
Conservation
Eastern Phoebes are common and generally stable throughout Virginia. They are not considered a species of special concern, and no specific conservation projects are underway in Virginia. If Eastern Phoebes are nesting in unacceptable locations, such as over a front door, then they can often be lured to artificial ledges that can be installed in more appropriate locations. Plans for building Eastern Phoebe nesting platforms can be found at the Cornell Lab’s NestWatch website.
Interactive Map
The interactive map contains up to six Atlas layers (probability of occurrence for the First and Second Atlases, change in probability of occurrence between Atlases, breeding evidence for the First and Second Atlases, and abundance for the Second Atlas) that can be viewed one at a time. To view an Atlas map layer, mouse over the layer box in the upper left. County lines and physiographic regional boundaries (Mountains and Valleys, Piedmont, and Coastal Plain) can be turned on and off by checking or unchecking the box below the layer box. Within the map window, users can hover on a block to see its value for each layer and pan and zoom to see roads, towns, and other features of interest that are visible beneath a selected layer.
View Interactive Map in Full Screen
References
Hostetler, J. A., J. R. Sauer, J. E. Hines, D. Ziolkowski, and M. Lutmerding (2023). The North American breeding bird survey, analysis results 1966–2022. U.S. Geological Survey, Laurel, MD, USA. https://doi.org/10.5066/P9SC7T11.
Weeks Jr., H. P. (2020). Eastern Phoebe (Sayornis phoebe), version 1.0. In Birds of the World (A. F. Poole, Editor). Cornell Lab of Ornithology, Ithaca, NY, USA. https://doi.org/10.2173/bow.easpho.01.