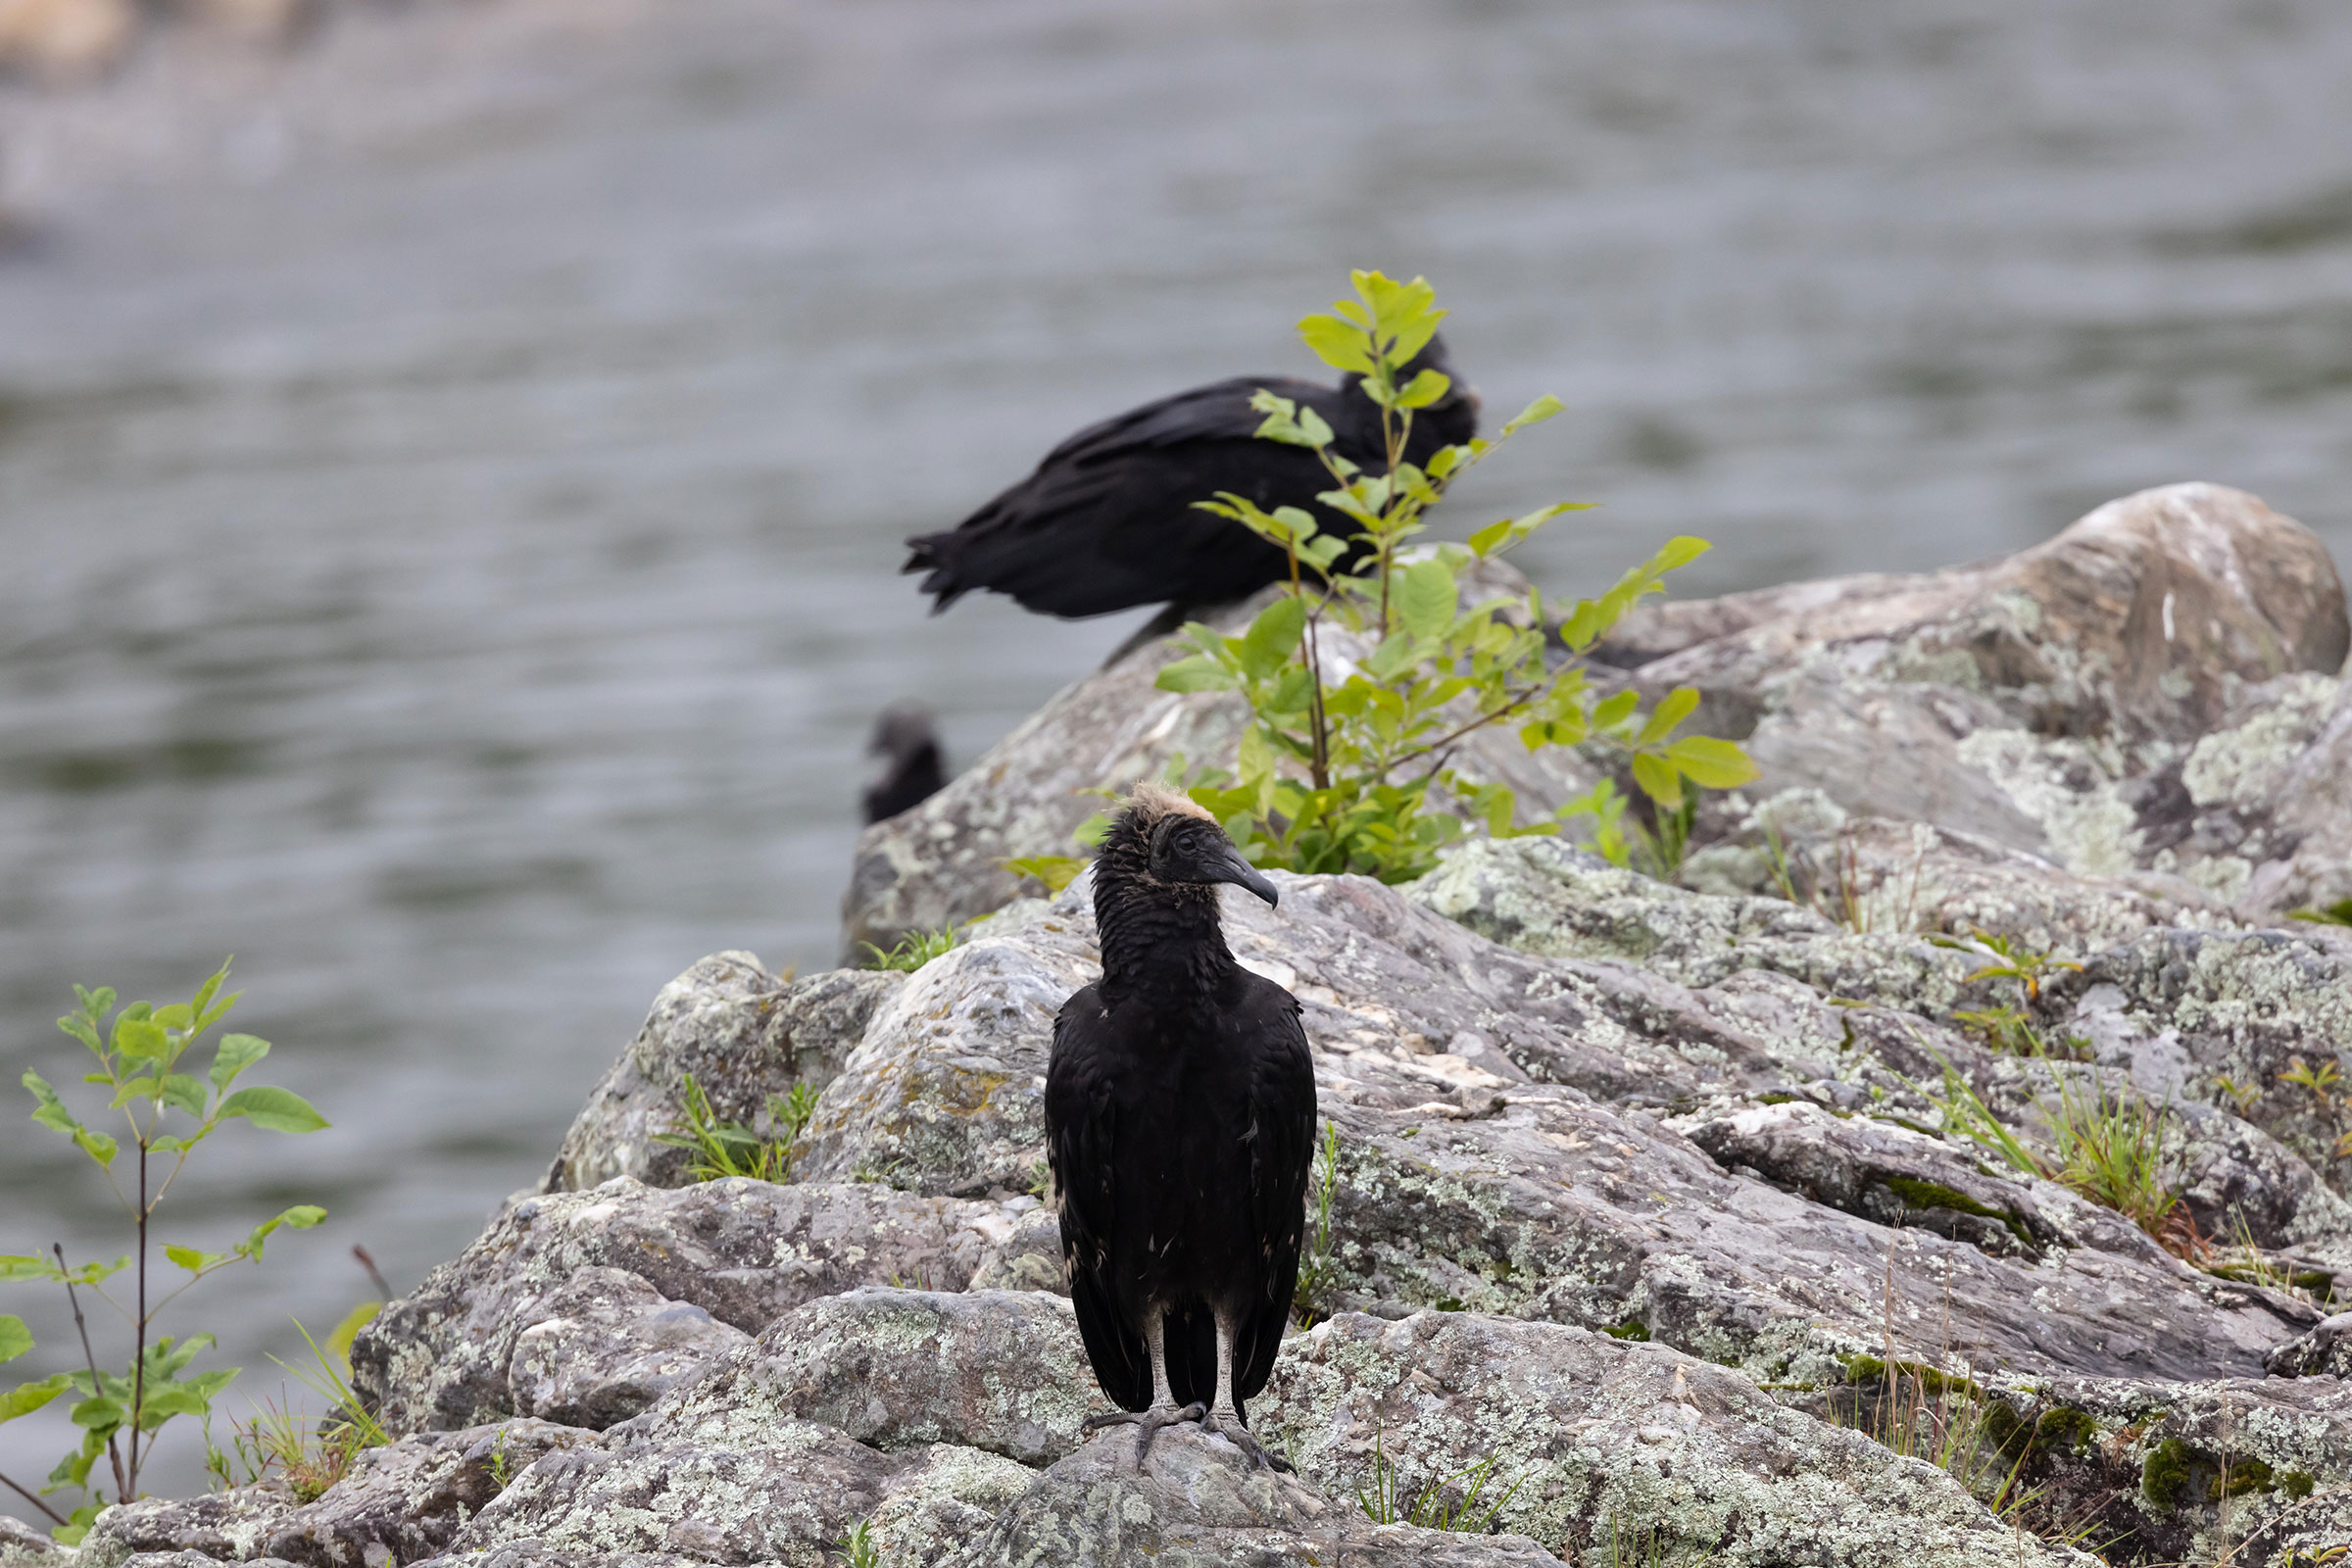
Introduction
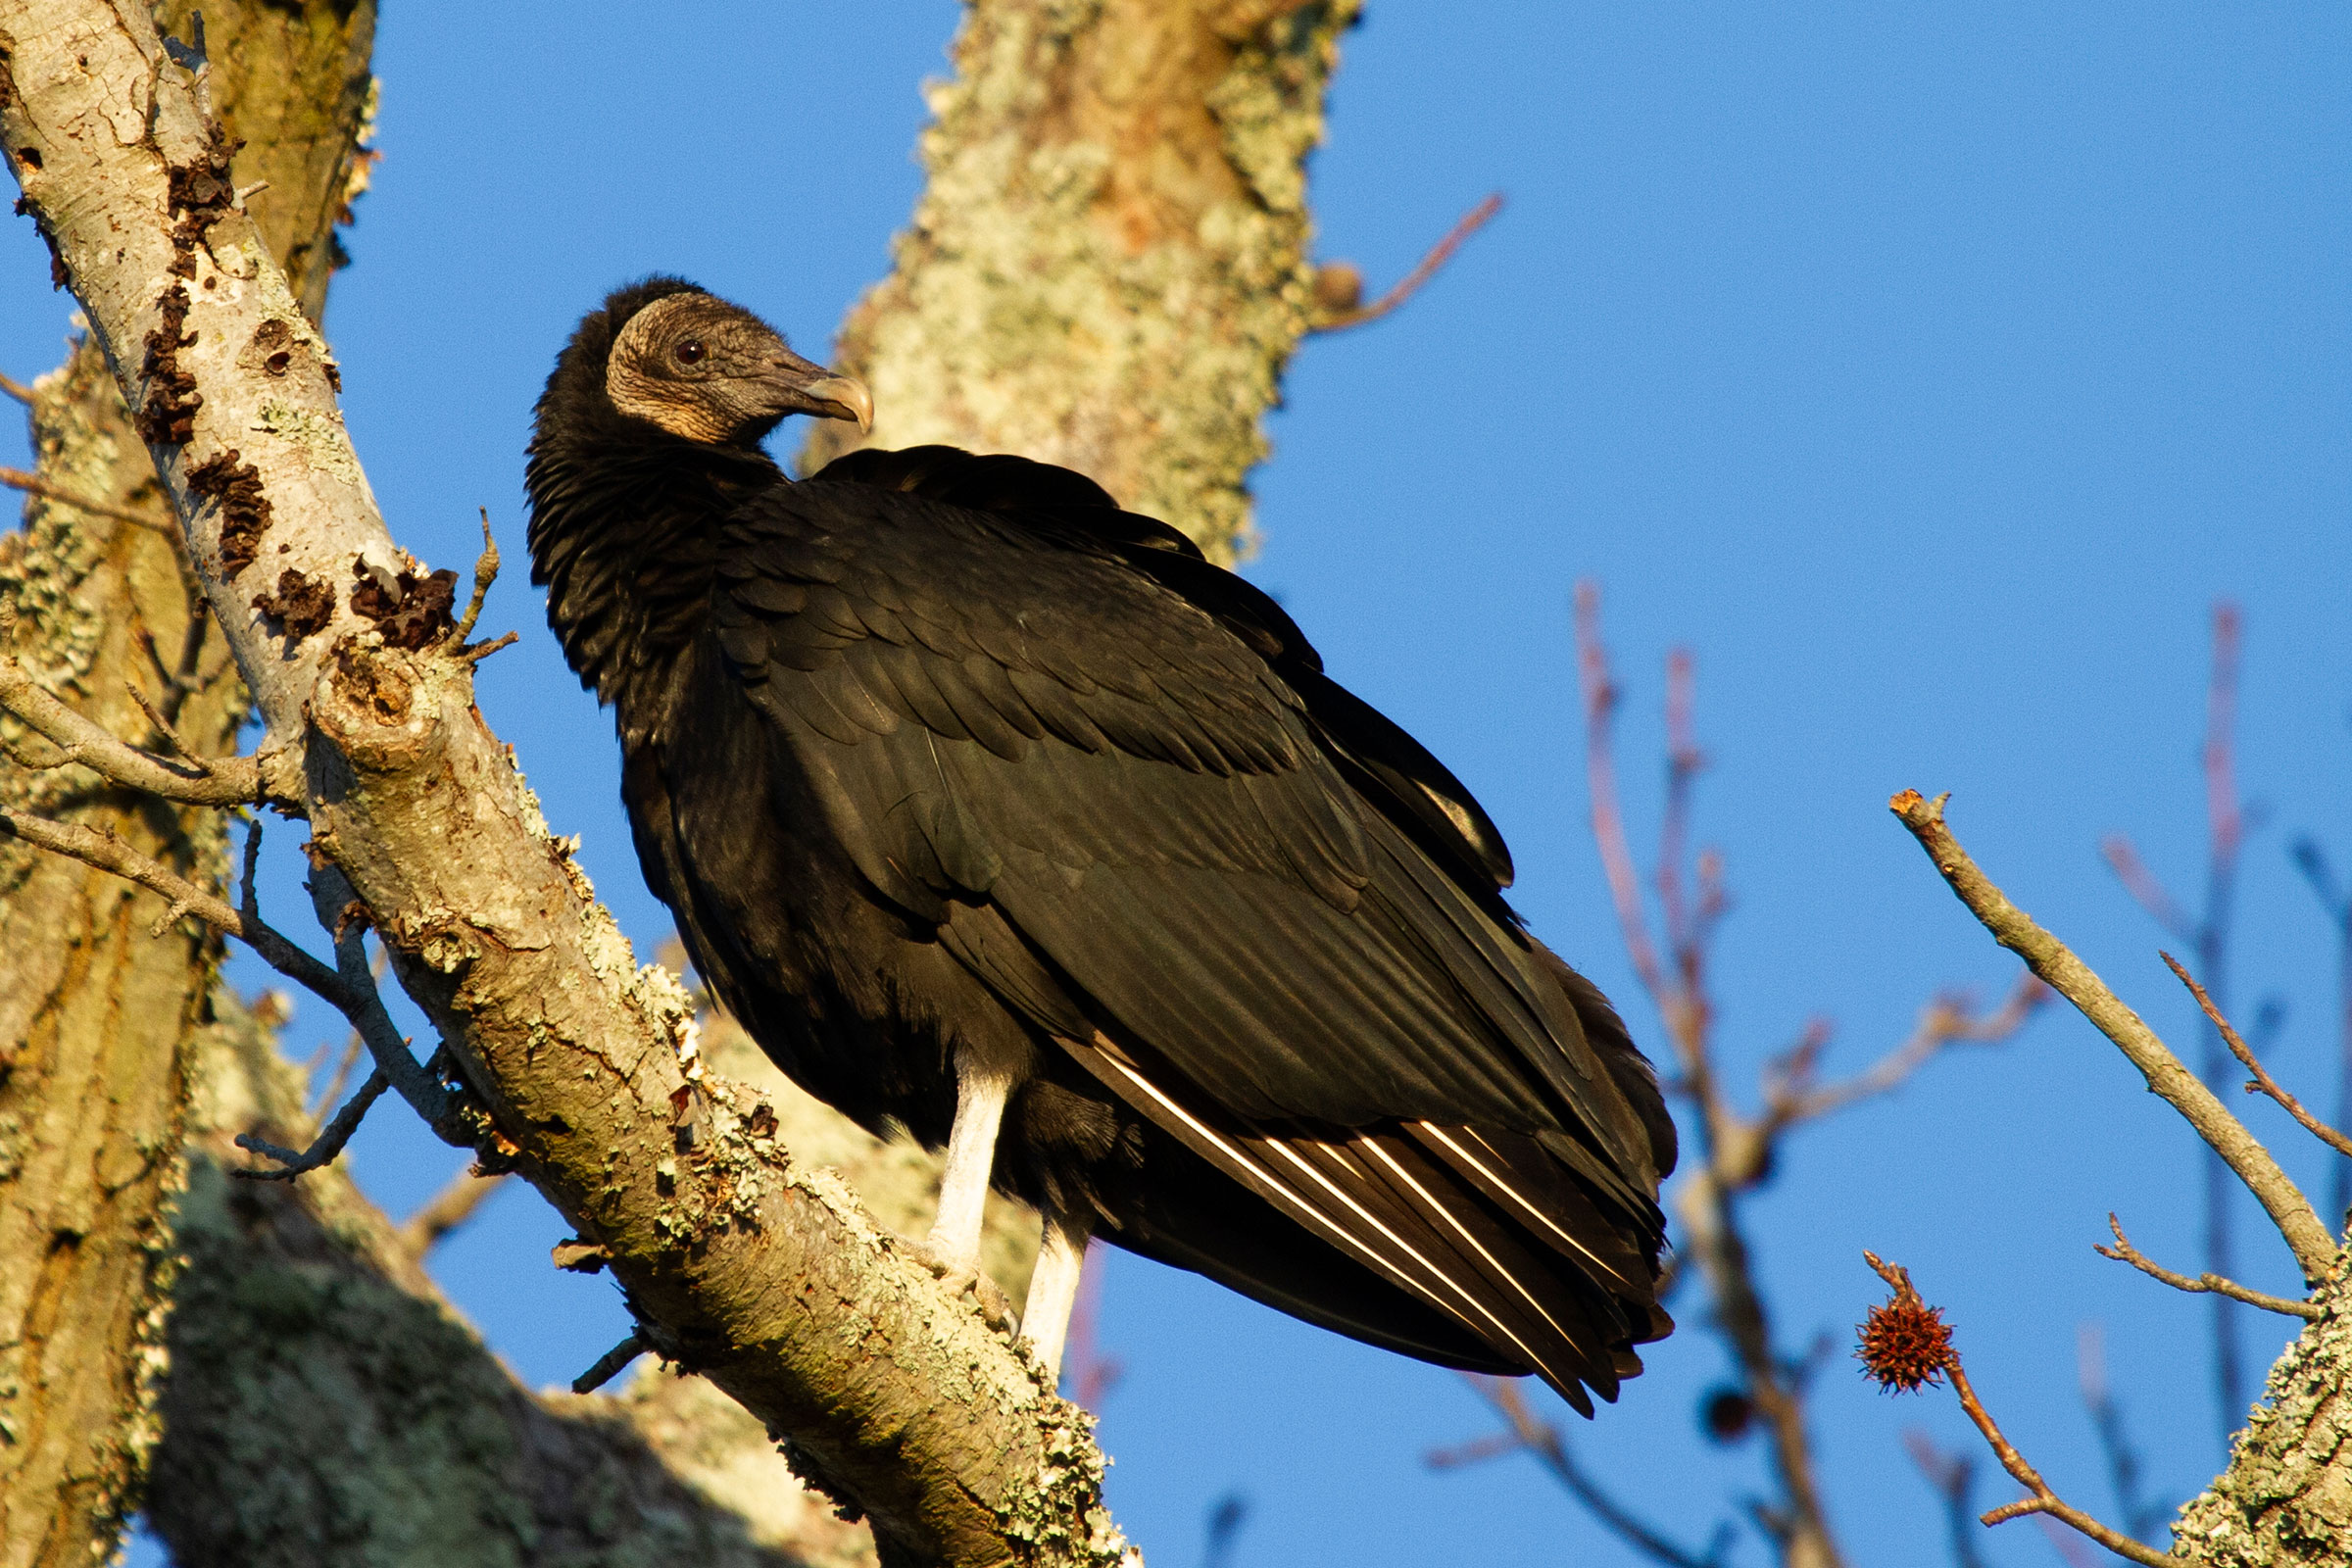
Black Vultures can be distinguished from Turkey Vultures (Cathartes aura) by their naked black (as opposed to red) heads and white stars under their wingtips. Black Vultures often, though not exclusively, use large communal roosts (Sweeny and Fraser 1986). From those roosts, they move to loafing areas until environmentally driven uplift develops (mostly formation of thermal but also orographic uplift). They follow one another (and Turkey Vultures) to food resources from loafing areas. There is a social structure at carcasses that allows some (often related individuals) to consume more food than others (Kluever et al. 2020).
Additionally, the range of Black Vultures in eastern North America has been expanding north and west. These expansions could be a response to large numbers of deer killed by collisions with vehicles and warmer temperatures spurred by climate change (Buckley et al. 2022). These expanding and increasing populations, combined with their social nature, cause conflicts with people. These conflicts include damage to structures (tearing roof shingles and upholstery, and fecal accumulation), livestock (they can kill newborn livestock), and collisions with aircraft. Damage to structures and risk of collisions with aircraft are exacerbated when Black Vultures congregate at loafing sites (structural damage) and soar in groups (aircraft) (Kluever et al. 2020).
Breeding Distribution
Black Vultures are found throughout the state, although they have a low likelihood of occurrence in the heavily forested portions of the Mountains and Valleys region and in some areas of the Coastal Plain, where year-round inundation of water prevents nesting and foraging (Figure 1). They are slightly more likely to occur in blocks with agricultural lands or a greater diversity of habitat types, which is consistent with their habits of typically nesting in a range of hidden areas, such as dark cavities, hollow trees, abandoned buildings, caves and stumps, and dense brush piles (Buckley et. 2022).
The change in their distribution during the First Atlas and change between the Atlas periods could not be modeled due to model limitations (see Interpreting Species Accounts). For more information on their distribution during the First Atlas, please see the Breeding Evidence section.
View Environmental Associations
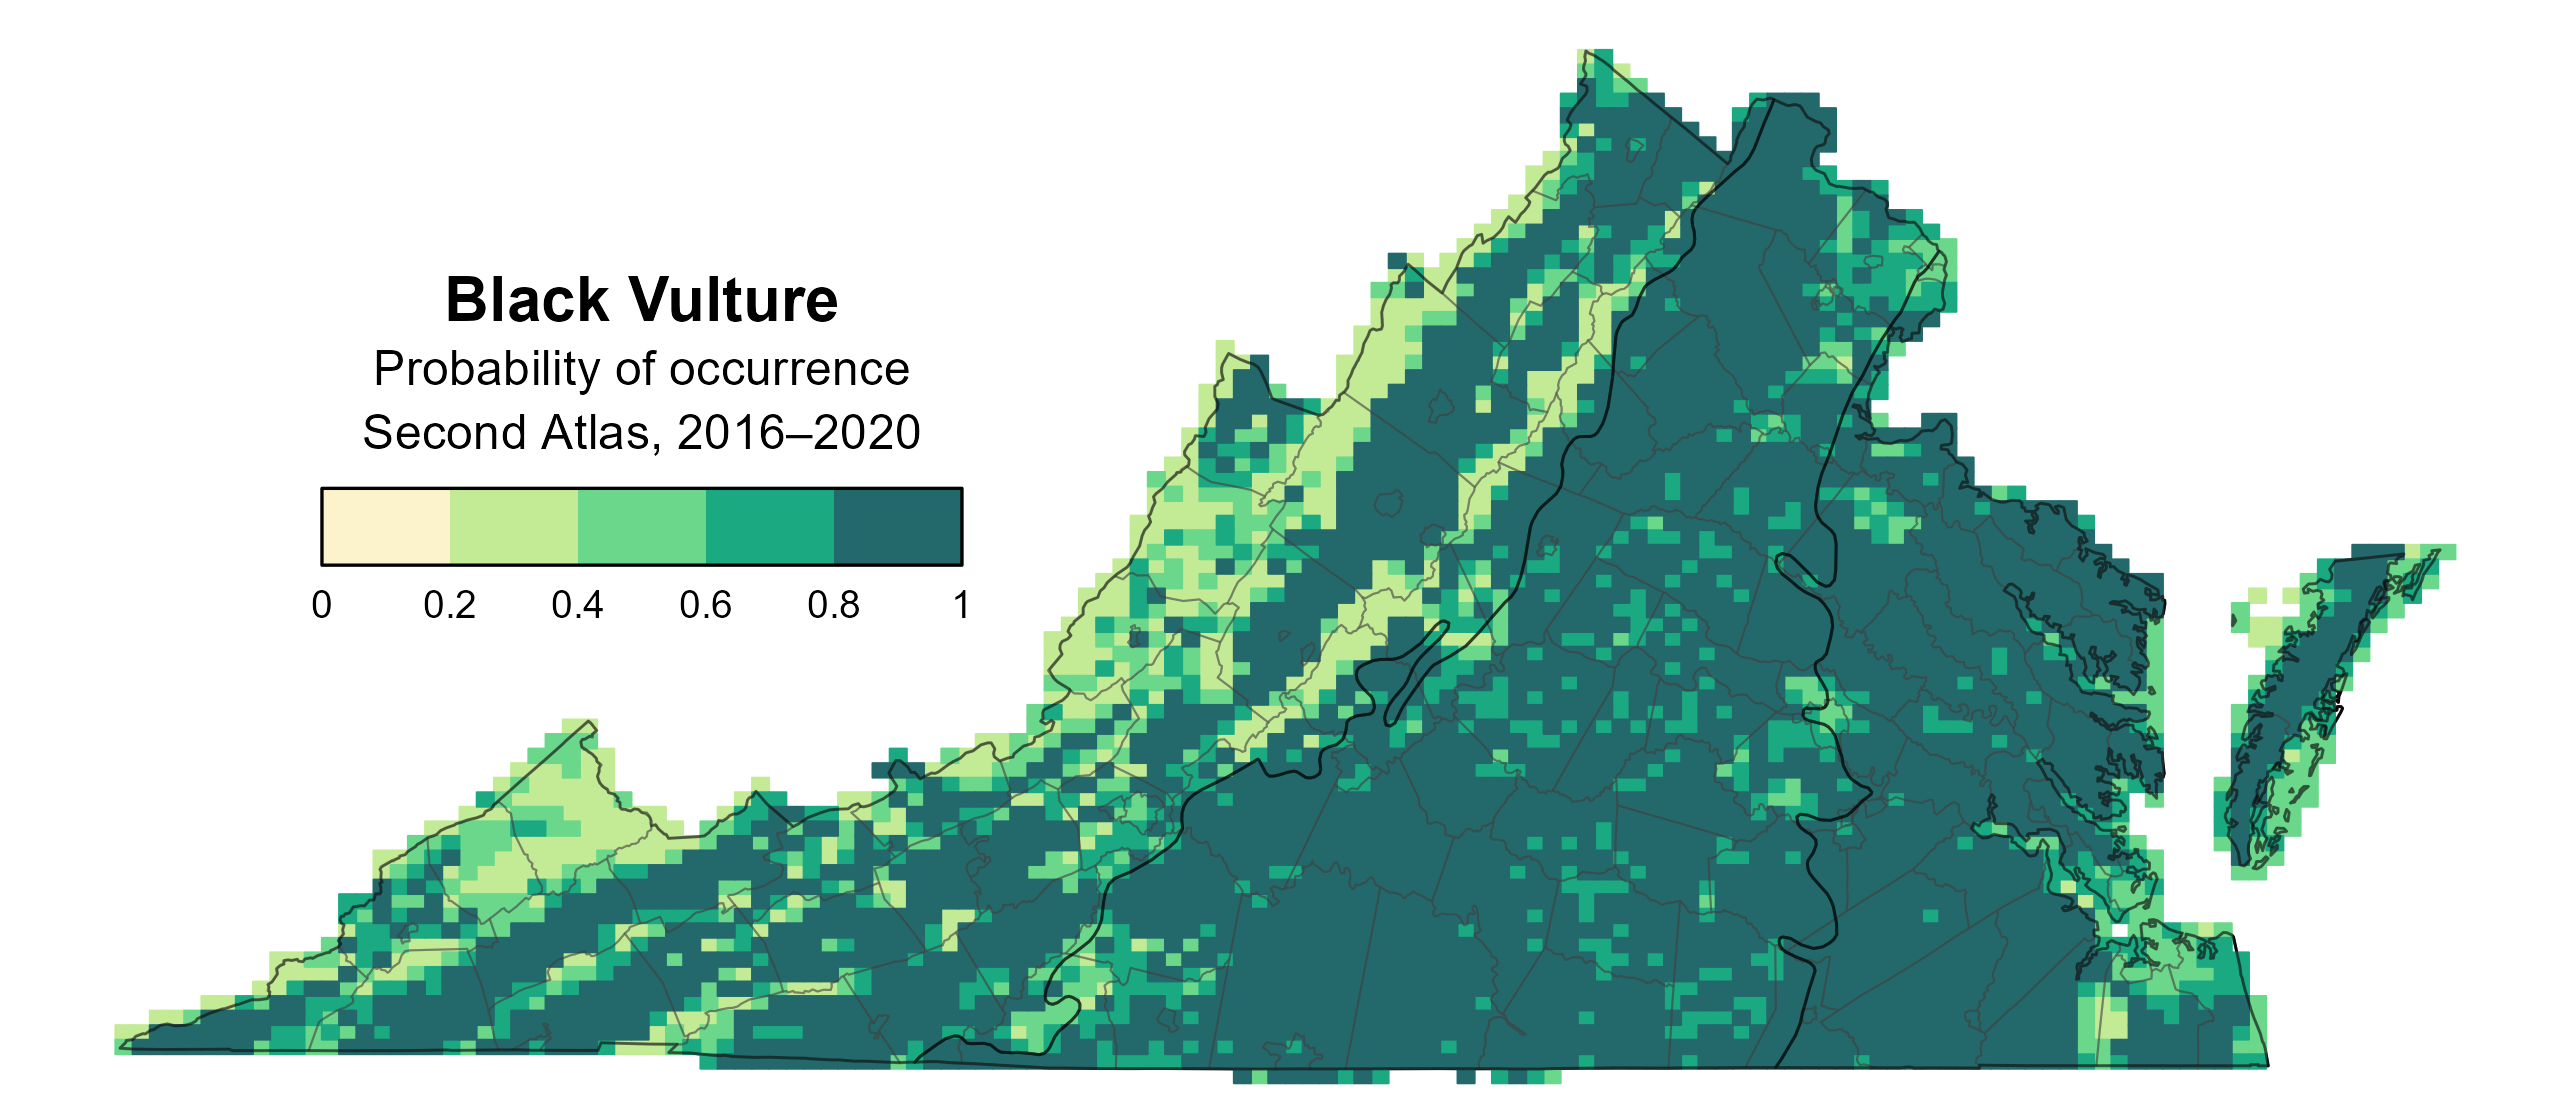
Figure 1: Black Vulture breeding distribution based on probability of occurrence (Second Atlas, 2016–2020). This map indicates the probability that this species will occur in an Atlas block (an approximately 10 mi2 [26 km2] survey unit) based on environmental (including habitat) factors and after adjusting for the probability of detection (variation in survey effort among blocks).
Breeding Evidence
Black Vultures were confirmed breeders in 76 blocks and 37 counties and were probable breeders in an additional 16 counties (Figure 2). Black Vulture breeding observations were much more numerous in the Second Atlas than in the First Atlas (Figures 1 and 2), which was likely due to the increase in population size (see Population Status) and increased survey effort during the Second Atlas.
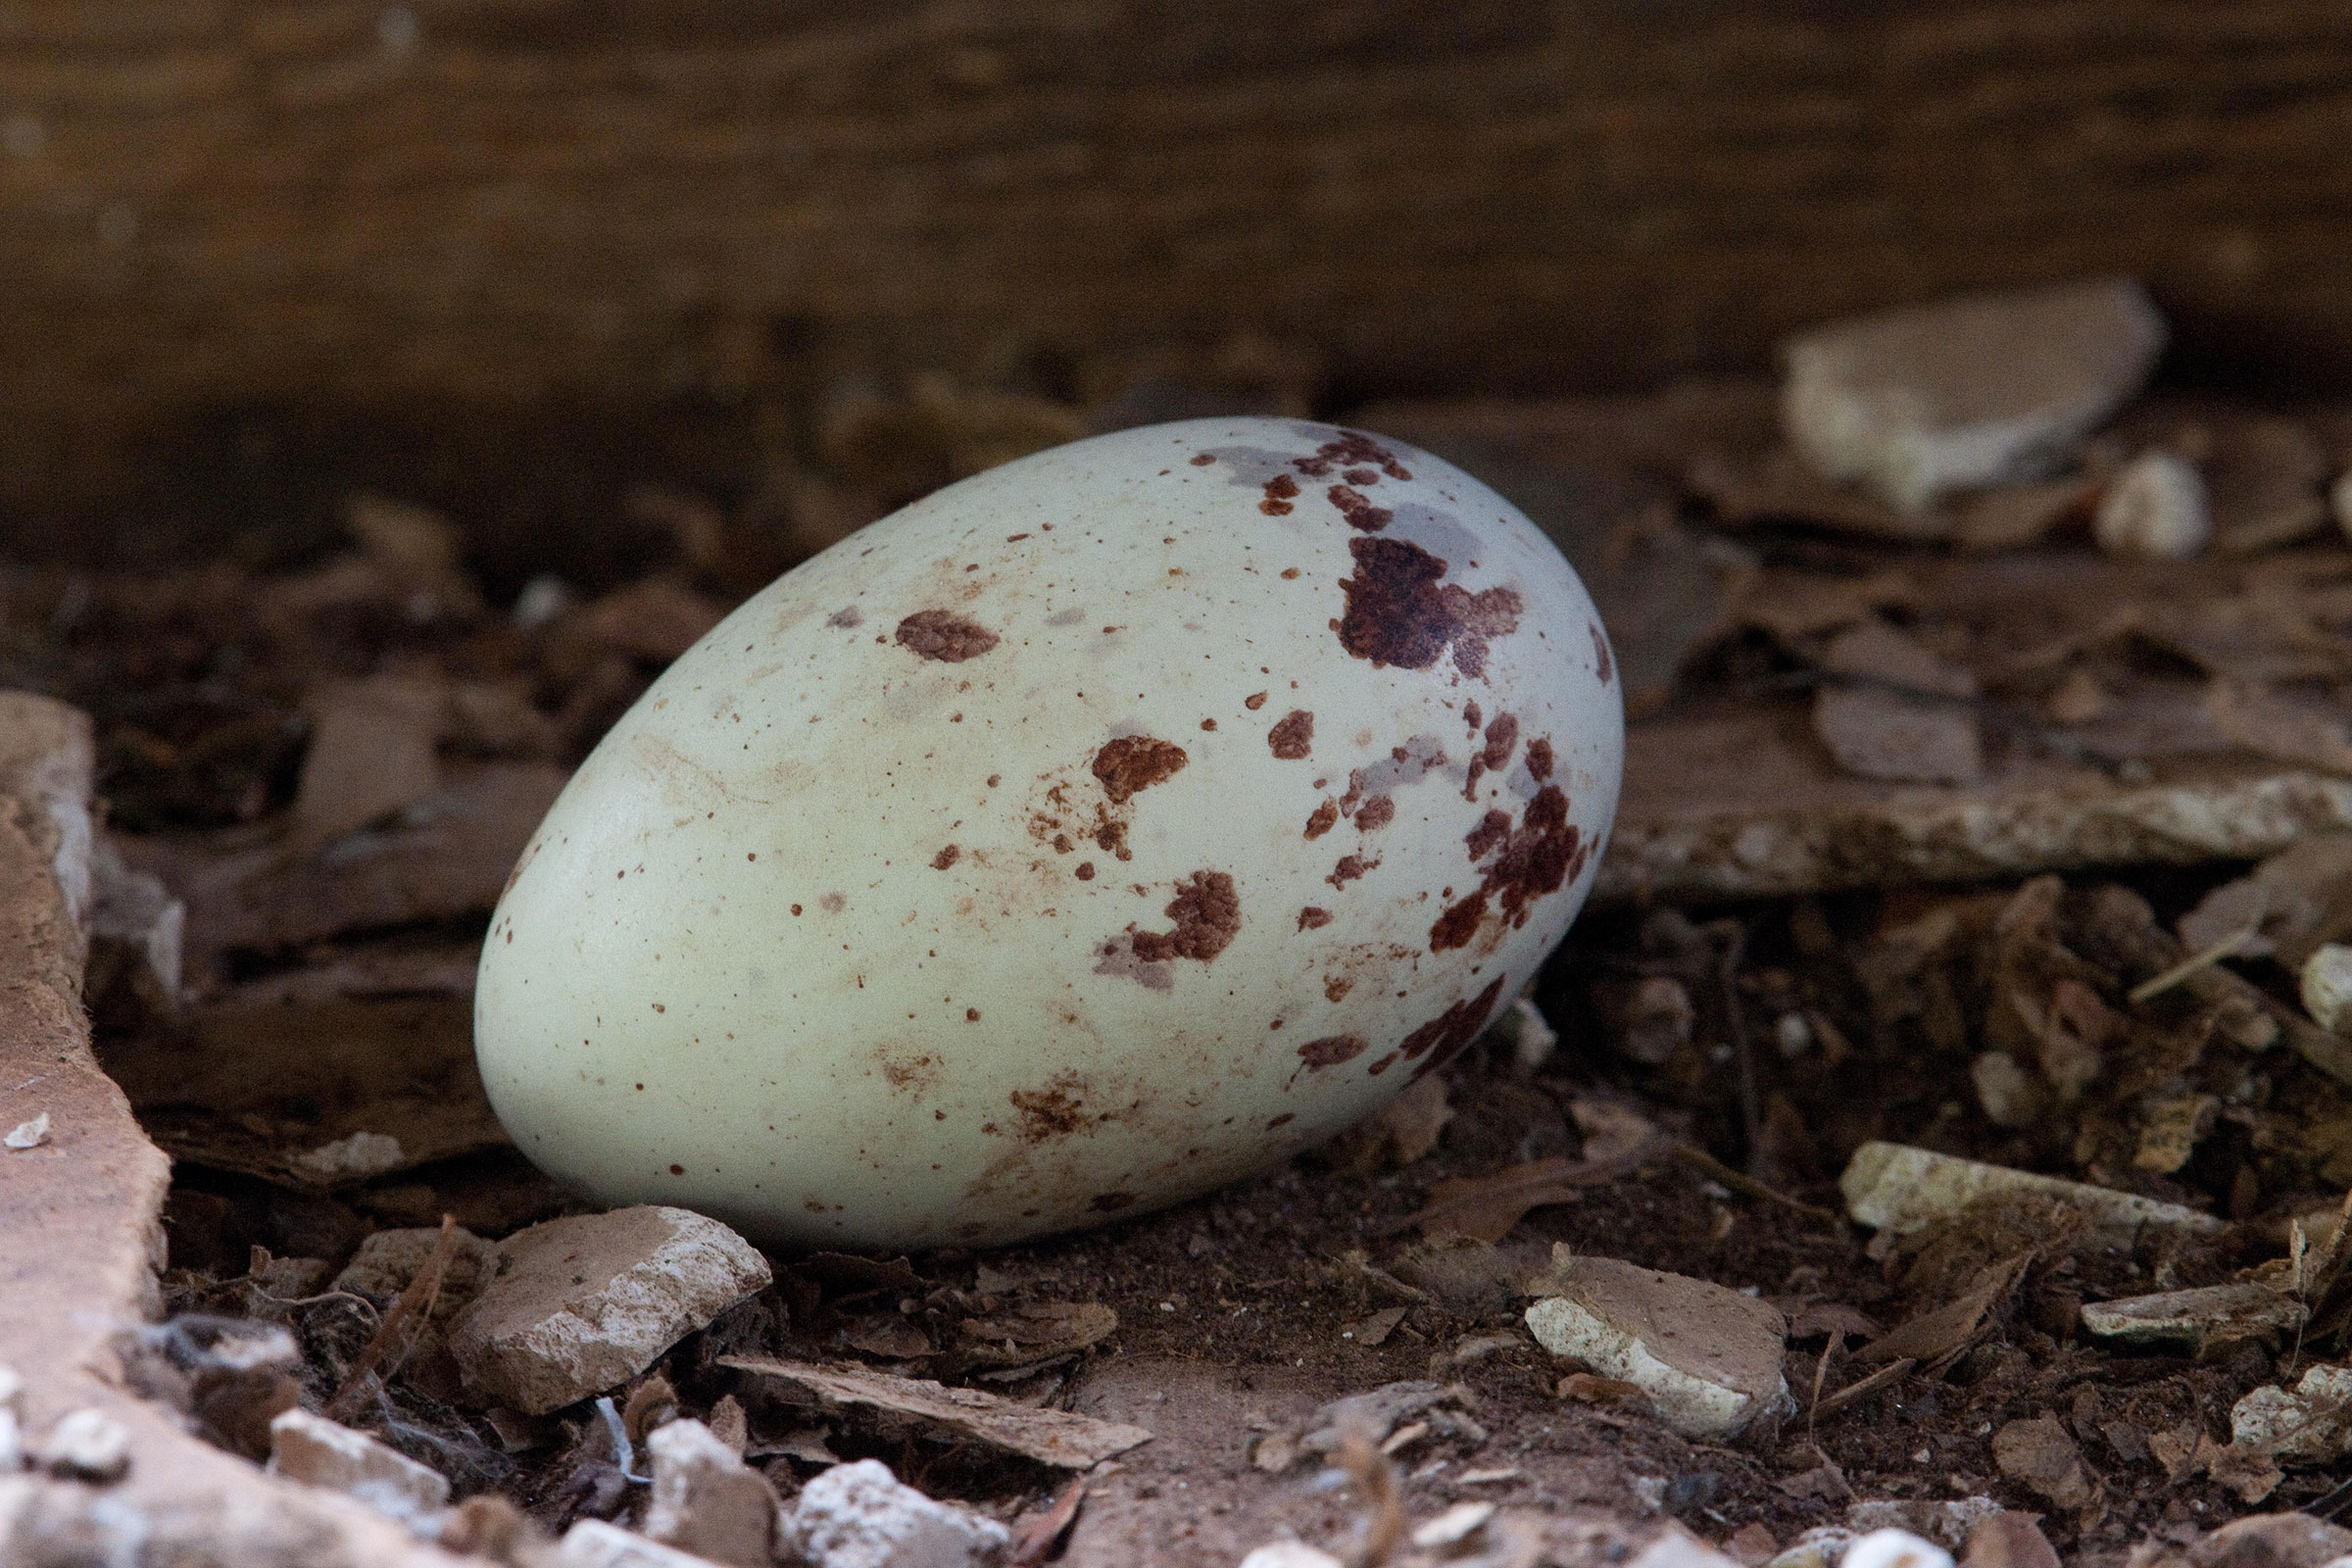
Black vulture breeding was confirmed when nests with eggs were observed in early March (Figure 4). Breeding continued throughout much of the year, ending at the end of December, when the last observation of adults feeding young was recorded. Throughout the season, the most common breeding behaviors were observations of recently fledged young (May 3 – September 23).
For more general information on the breeding habits of the Black Vulture, please refer to All About Birds.
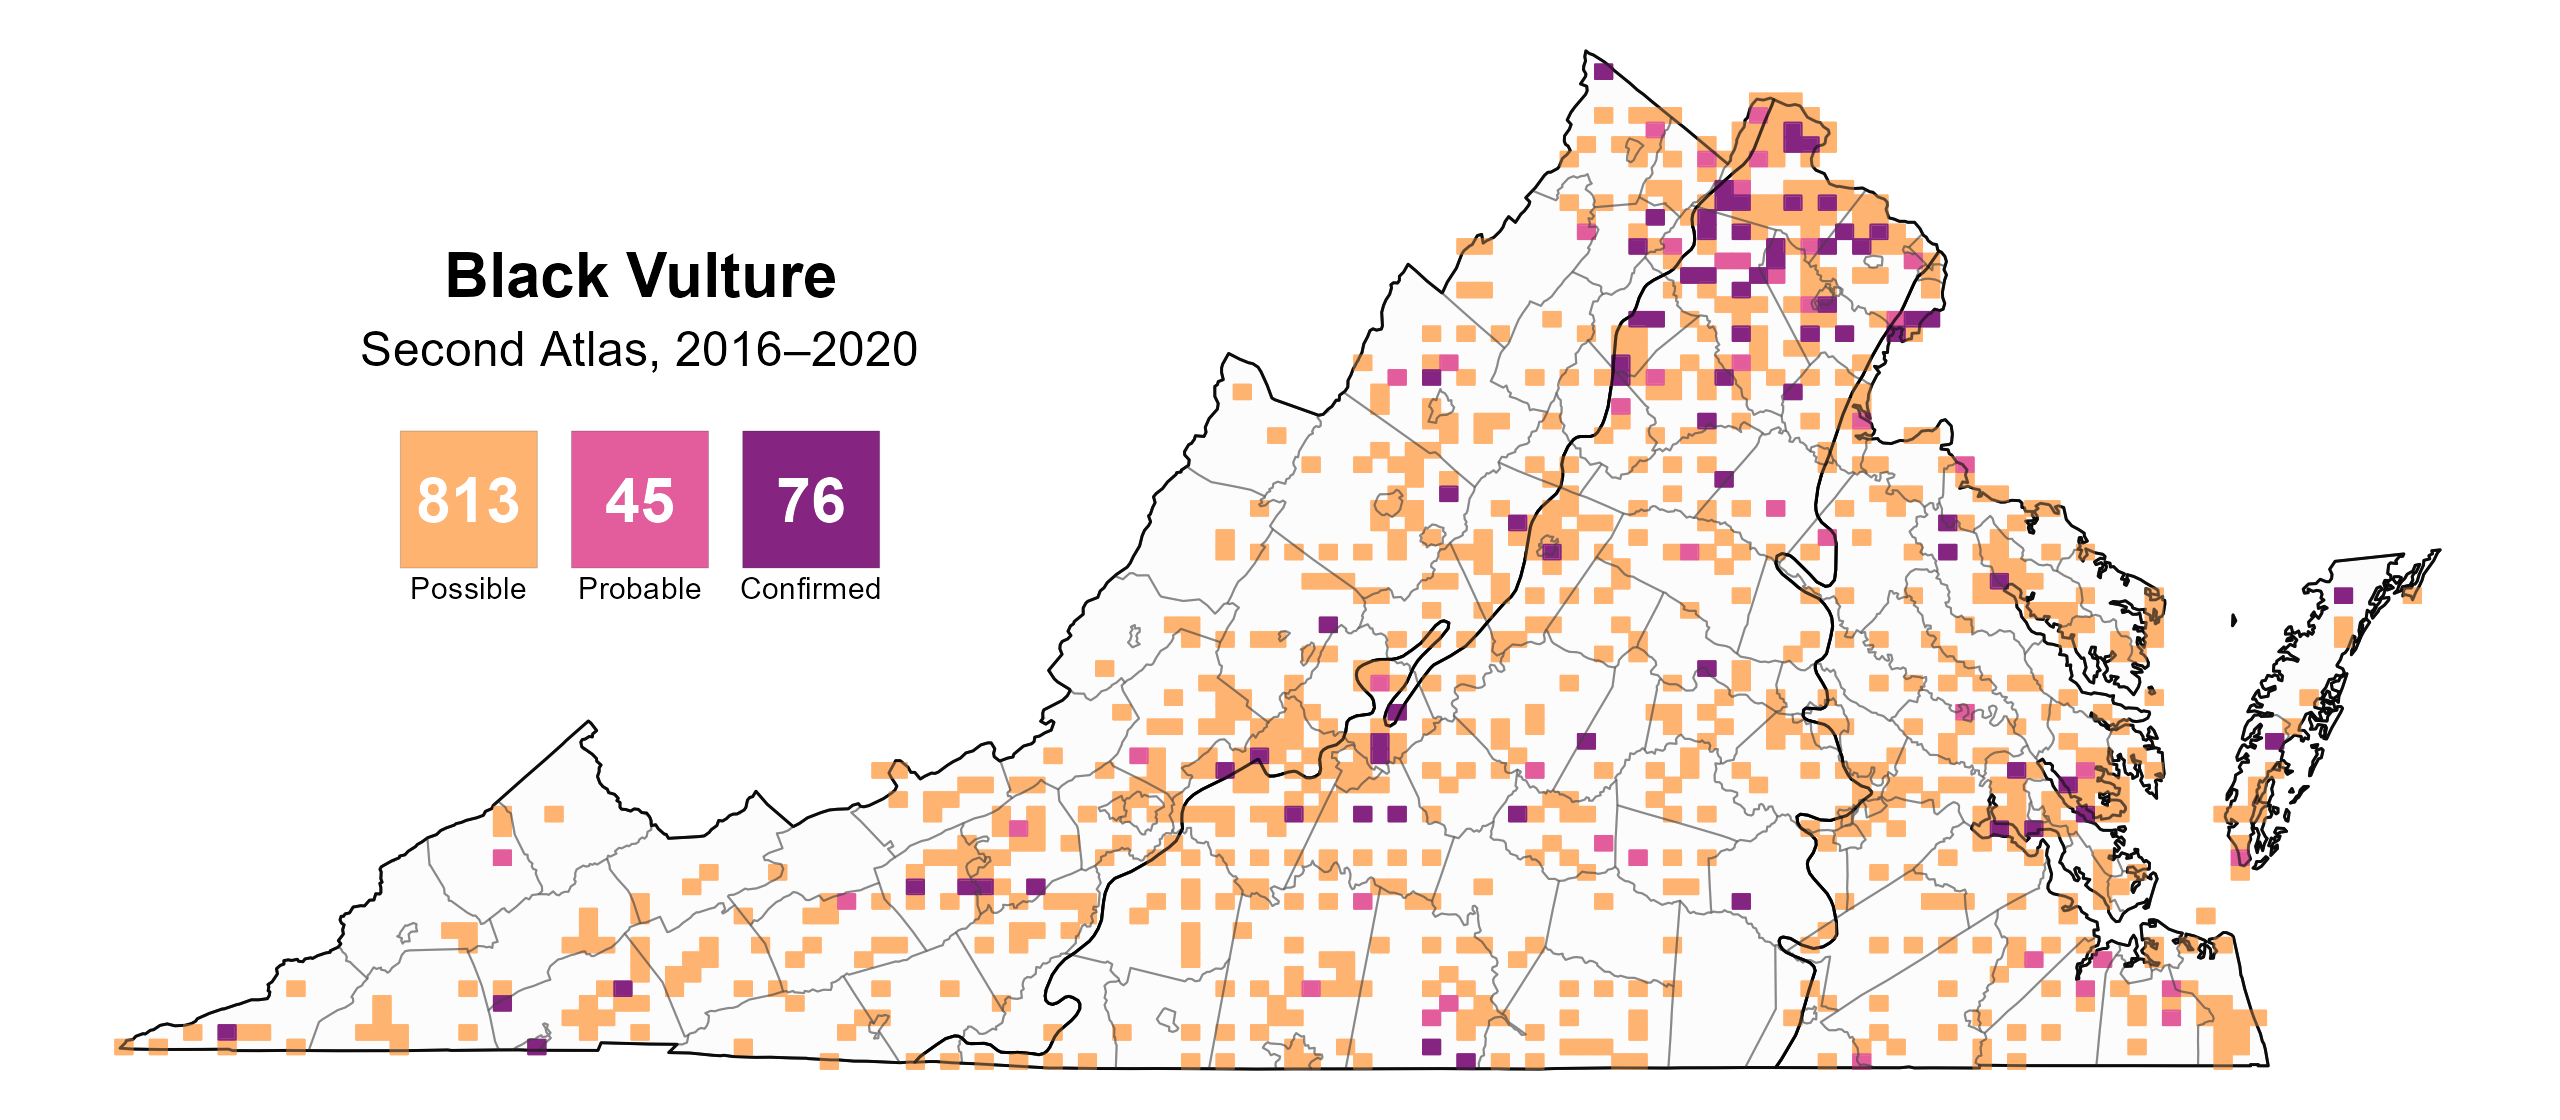
Figure 2: Black Vulture breeding observations from the Second Atlas (2016–2020). The colored boxes illustrate Atlas blocks (approximately 10 mi2 [26 km2] survey units) where the species was detected. The colors show the highest breeding category recorded in a block. The numbers within the colors in the legend correspond to the number of blocks with that breeding evidence category.
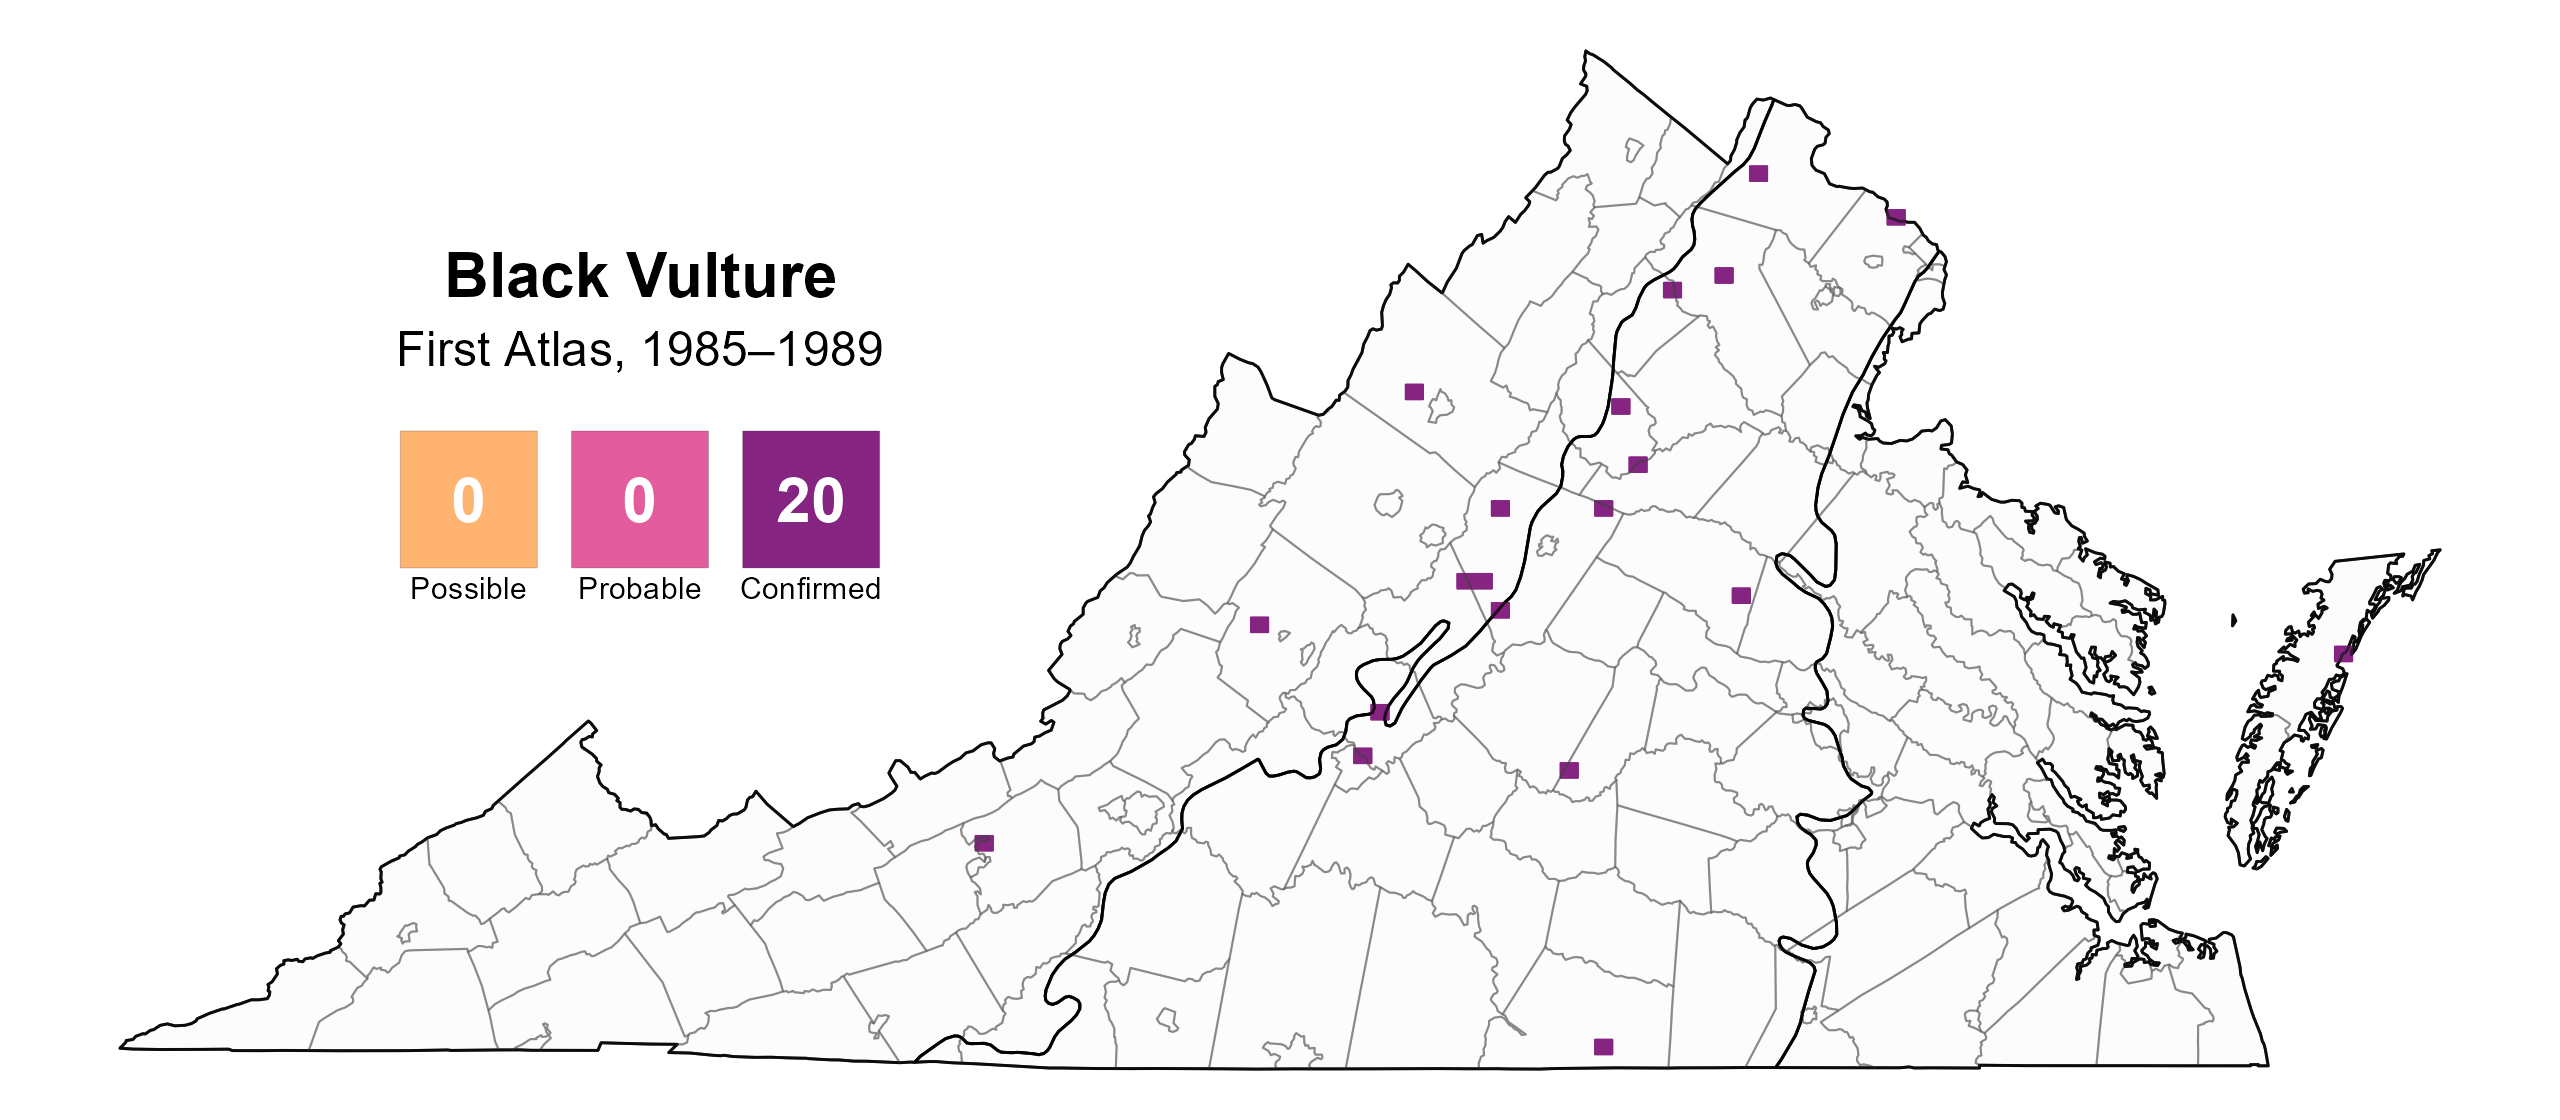
Figure 3: Black Vulture breeding observations from the First Atlas (1985–1989). The colored boxes illustrate Atlas blocks (approximately 10 mi2 [26 km2] survey units) where the species was detected. The colors show the highest breeding category recorded in a block. The numbers within the colors in the legend correspond to the number of blocks with that breeding evidence category.
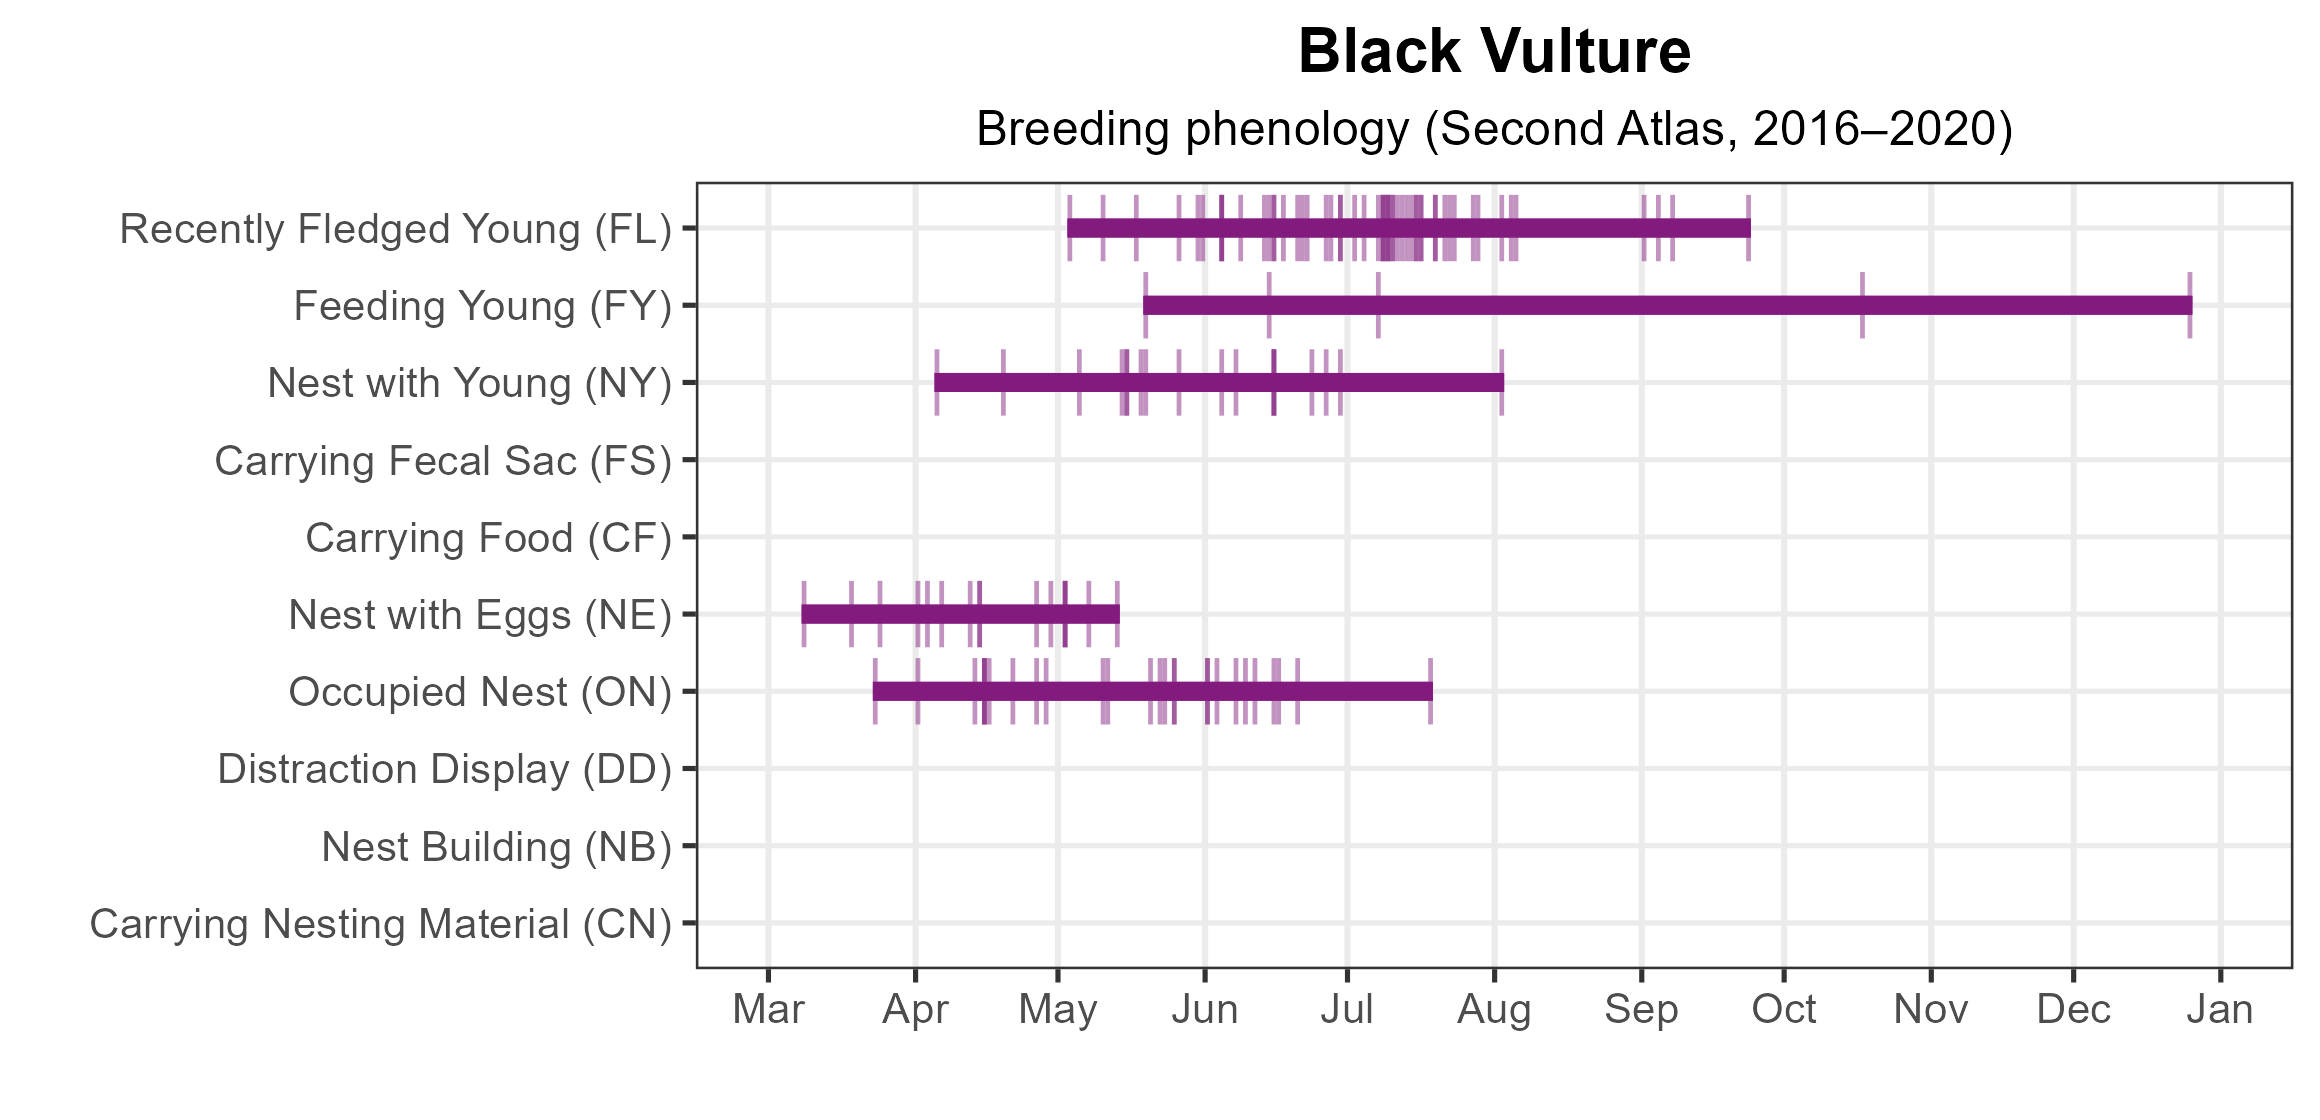
Figure 4: Black Vulture phenology: confirmed breeding codes. This graph shows a timeline of confirmed breeding behaviors. Tick marks represent individual observations of the behavior.
Population Status
Black Vulture relative abundance was estimated to be highest in the northern and western portions of the Piedmont region, around urban areas, and in much of the Coastal Plain region (Figure 5).
The total estimated Black Vulture population in the state is approximately 74,000 individuals (with a range between 24,000 and 236,000). In addition, the population size of Black Vultures is also growing. Based on data from the North American Breeding Bird Survey (BBS), from 1966–2022, the Black Vulture population grew by significant 3.9% annually in Virginia (Hostetler et al. 2023; Figure 6). The trend between Atlas periods was even greater, at a significant 4.92% increase per year from 1987–2018.
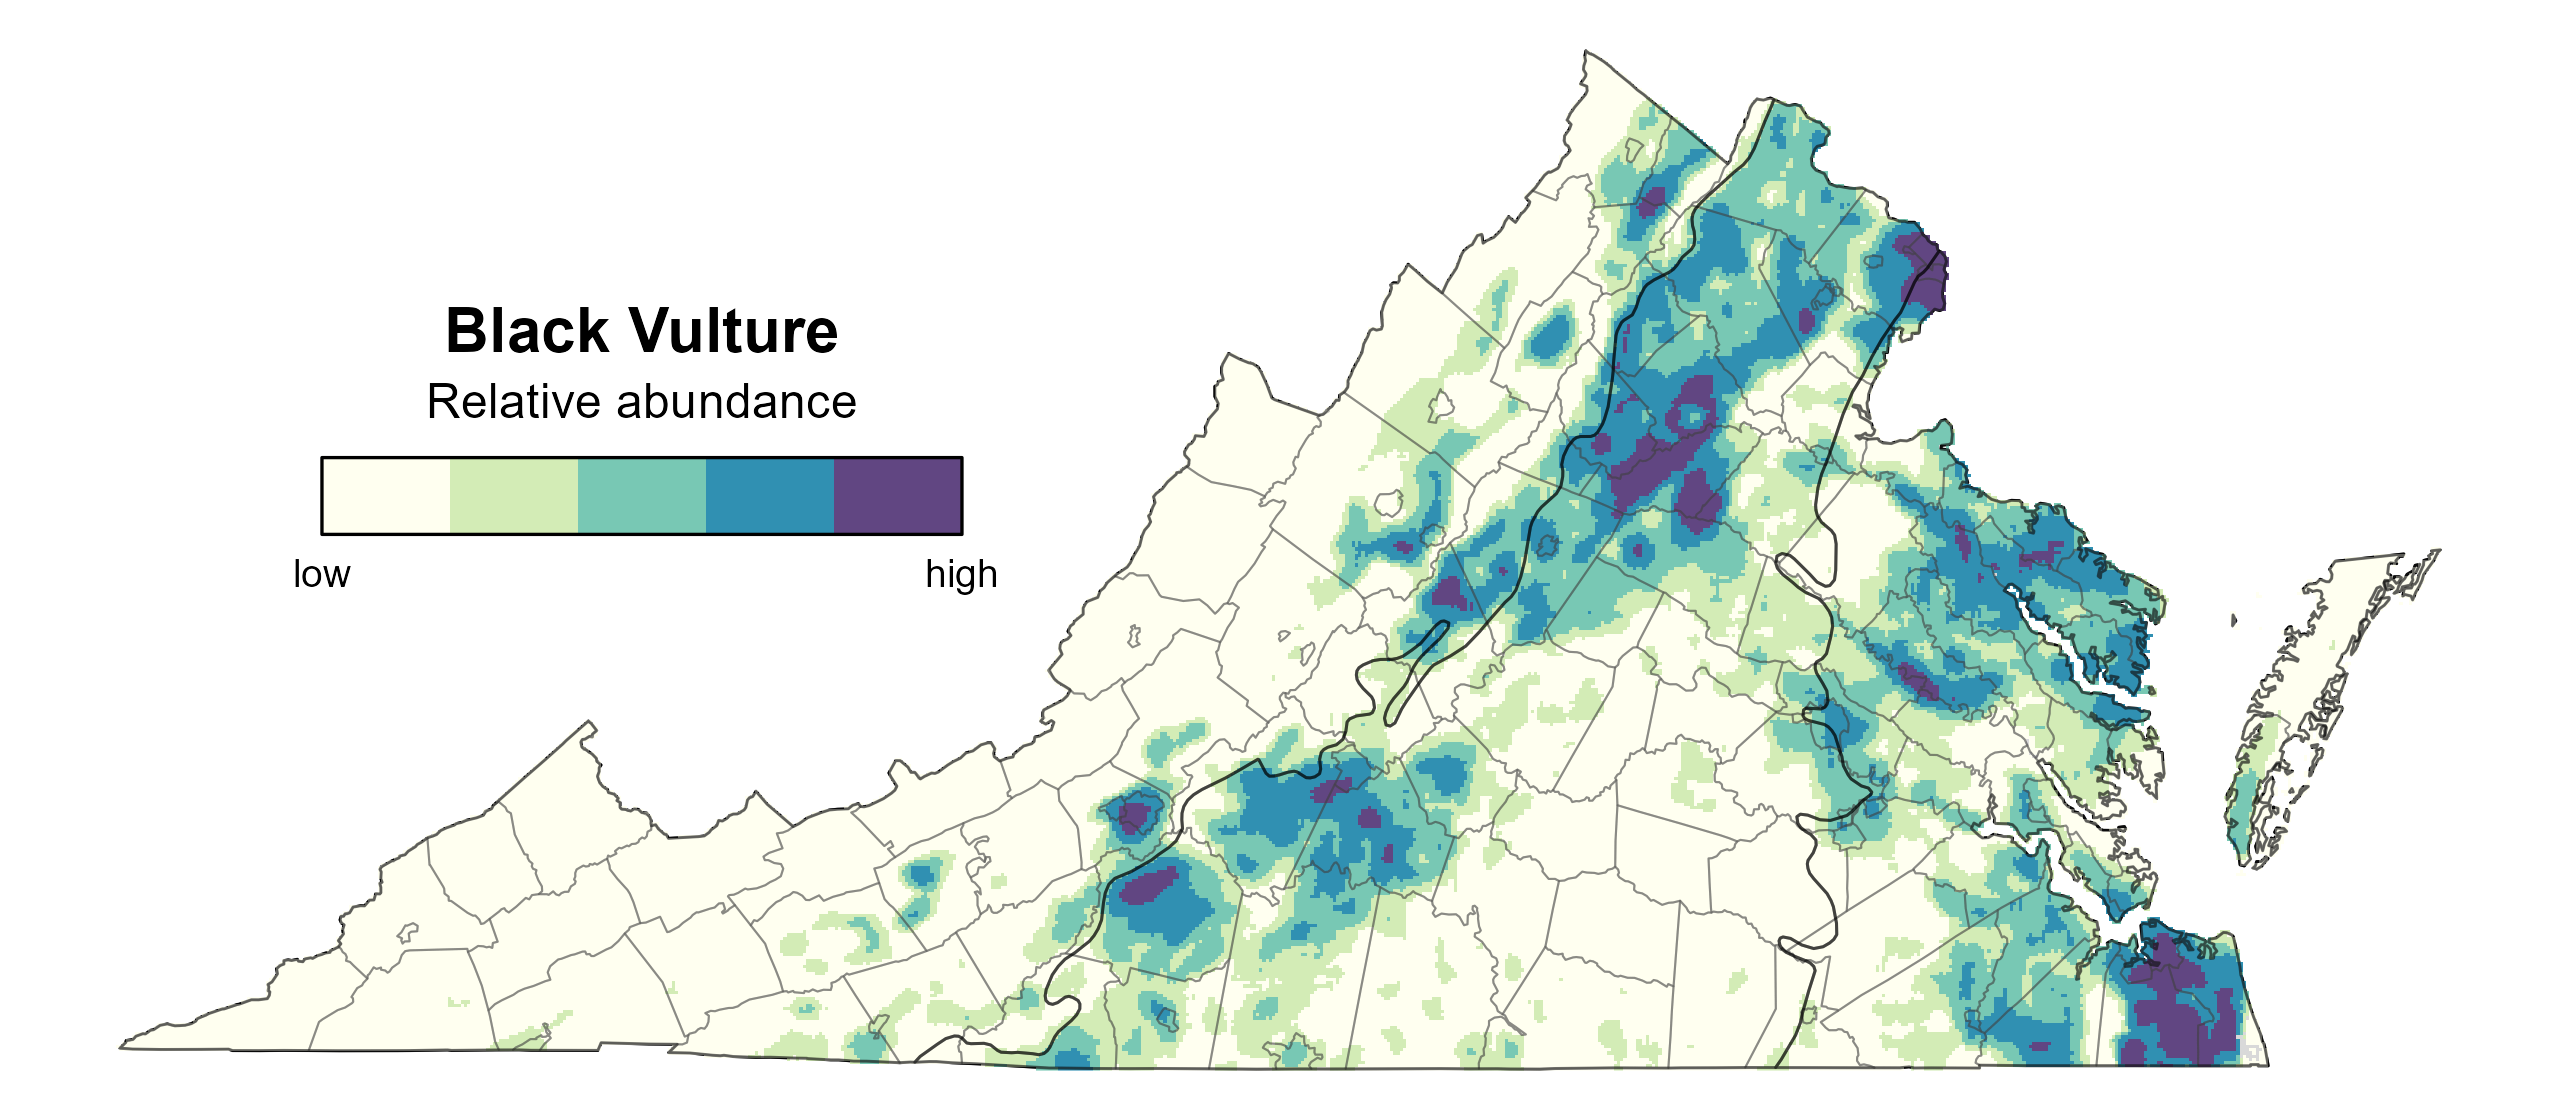
Figure 5: Black Vulture relative abundance (Second Atlas, 2016–2020). This map indicates the predicted abundance of this species at a 0.4 mi2 (1 km2) scale based on environmental (including habitat) factors. Abundance values are presented on a relative scale of low to high.
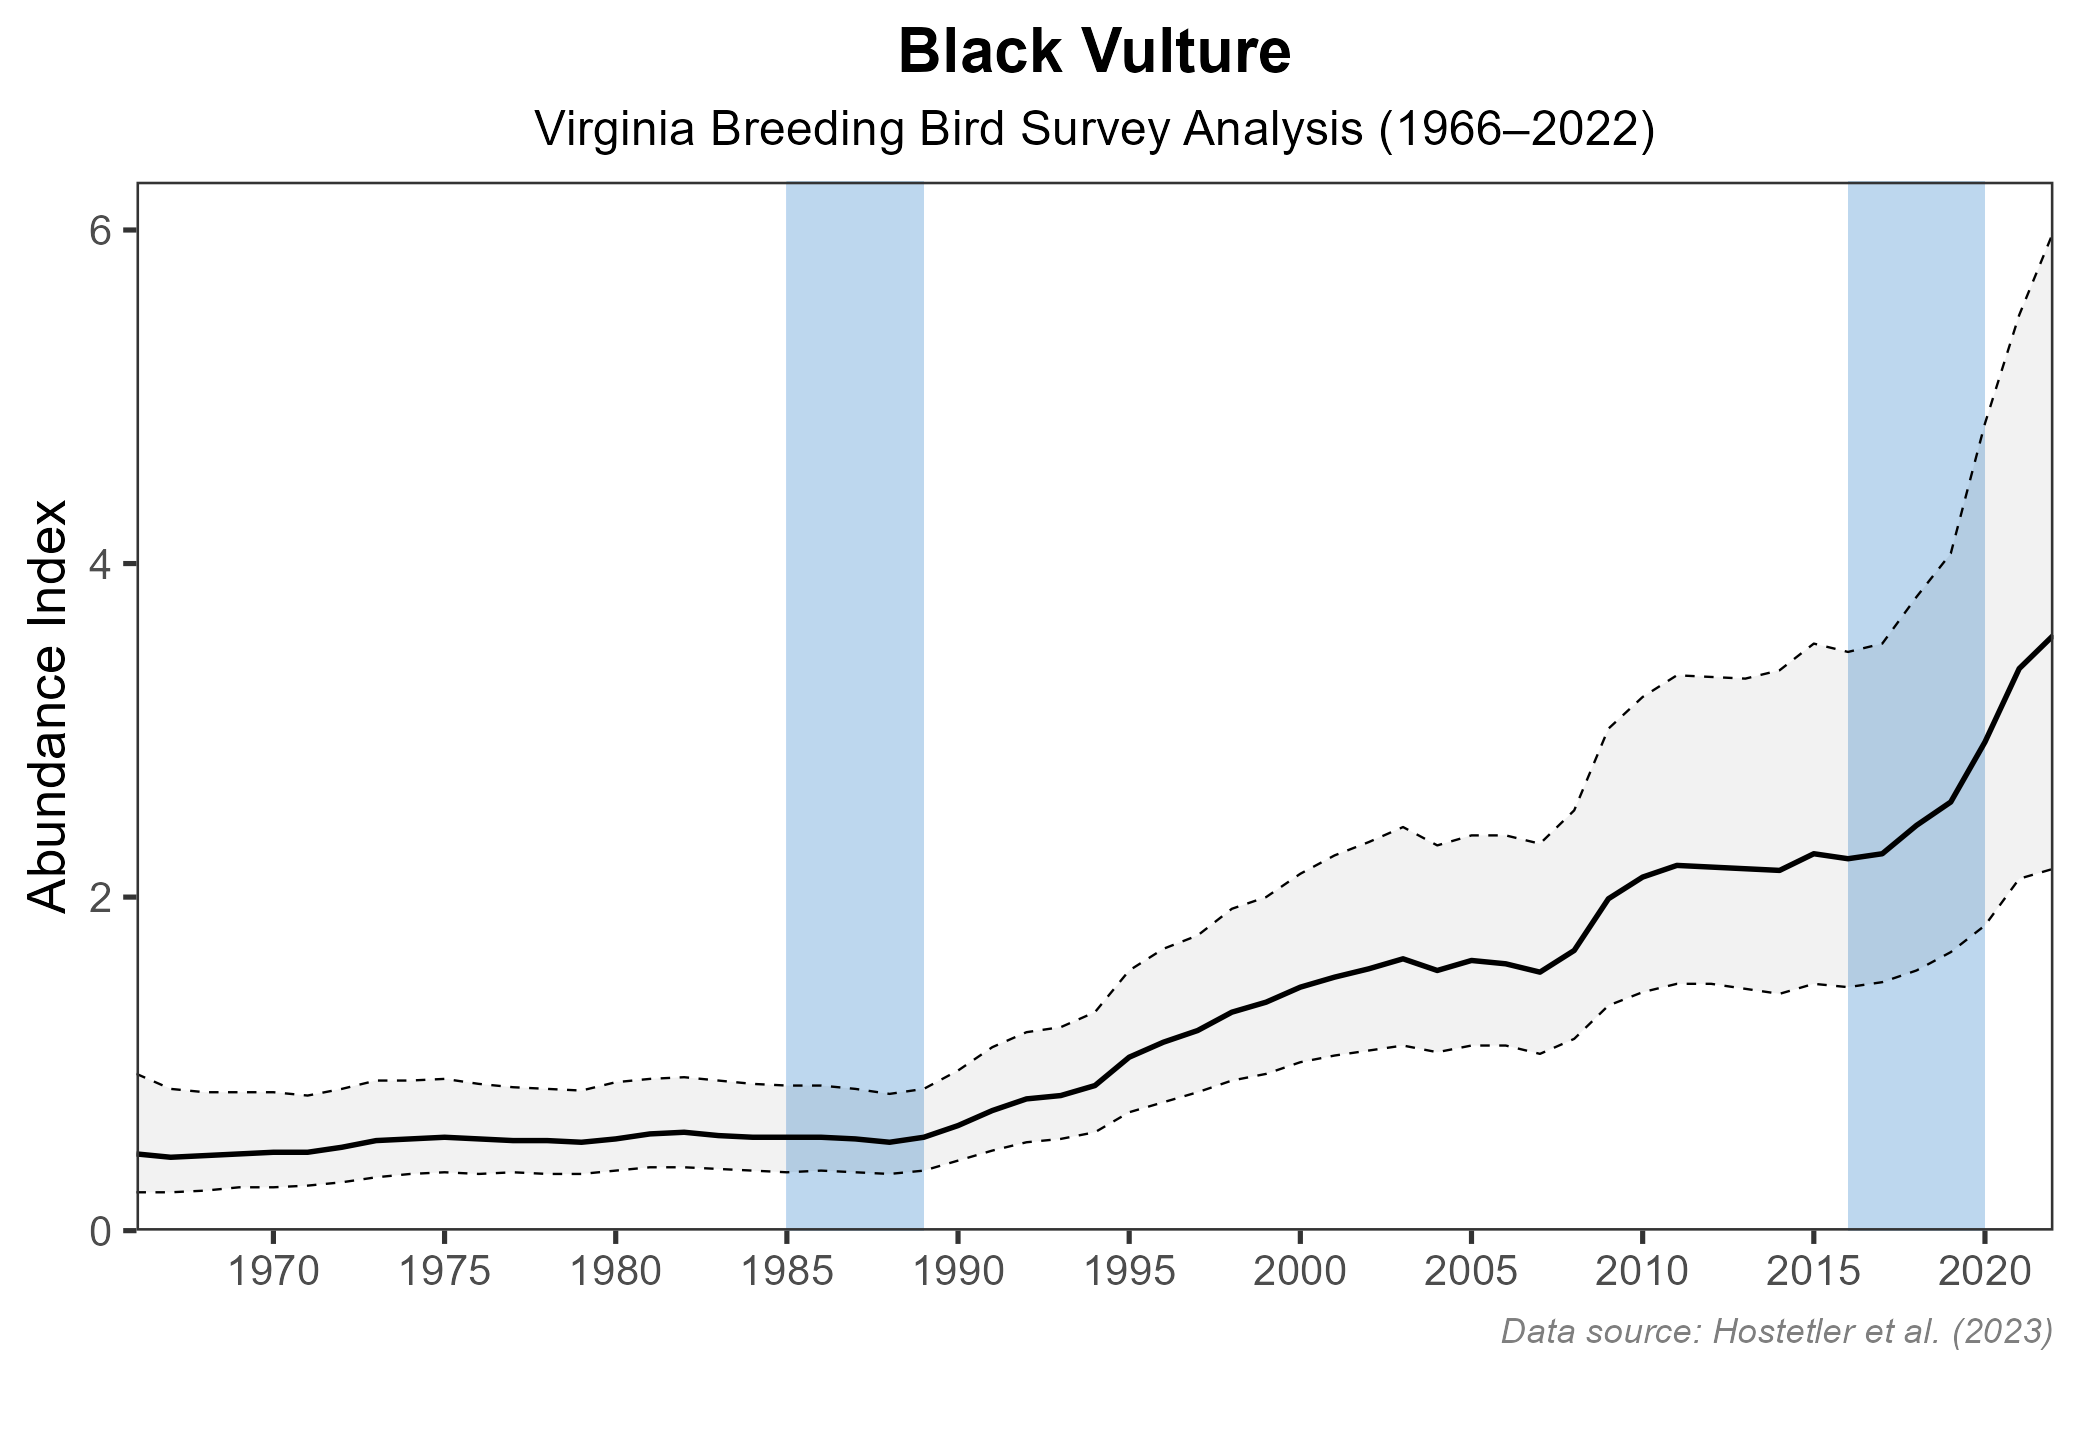
Figure 6: Black Vulture population trend for Virginia as estimated by the North American Breeding Bird Survey. The vertical axis shows species abundance; the horizontal axis shows the year. The solid line indicates the estimated population trend; there is a 97.5% probability that the true population trend falls between the dashed lines. The shaded bars indicate the First and Second Atlas periods.
Conservation
Given their habit of feeding on roadkill, Black Vultures are often struck by cars. They are also the source of a rising number of human-wildlife conflicts, such as when they damage vehicles by picking at windshield wipers, window seals, and other rubber or vinyl parts. In Virginia, Black Vultures are viewed as agricultural pests and thought to be a source of livestock mortality, prompting the Virginia Department of Agriculture and Consumer Services to issue depredation sub-permits to farmers and ranchers.
Interactive Map
The interactive map contains up to six Atlas layers (probability of occurrence for the First and Second Atlases, change in probability of occurrence between Atlases, breeding evidence for the First and Second Atlases, and abundance for the Second Atlas) that can be viewed one at a time. To view an Atlas map layer, mouse over the layer box in the upper left. County lines and physiographic regional boundaries (Mountains and Valleys, Piedmont, and Coastal Plain) can be turned on and off by checking or unchecking the box below the layer box. Within the map window, users can hover on a block to see its value for each layer and pan and zoom to see roads, towns, and other features of interest that are visible beneath a selected layer.
View Interactive Map in Full Screen
References
Buckley, N. J., B. M. Kluever, R. Driver, and S. A. Rush (2022). Black Vulture (Coragyps atratus), version 2.0. In Birds of the World (P. G. Rodewald and B. K. Keeney, Editors). Cornell Lab of Ornithology, Ithaca, NY, USA. https://doi.org/10.2173/bow.blkvul.02.
Hostetler, J. A., J. R. Sauer, J. E. Hines, D. Ziolkowski, and M. Lutmerding (2023). The North American breeding bird survey, analysis results 1966–2022. U.S. Geological Survey, Laurel, MD, USA. https://doi.org/10.5066/P9SC7T11.
Kluever, B., M. Pfeiffer, S. Barras, B. Dunlap, and L. Humberg (2020). Black Vulture conflict and management in the United States: damage trends, management overview, and research needs. Human–Wildlife Interactions 14.
Sweeney, T. M., and J. D. Fraser (1986). Vulture roost dynamics and monitoring techniques in Southwest Virginia. Wildlife Society Bulletin 14:49–54.